 2017, Vol. 35
Institute of Oceanology, Chinese Academy of Sciences
Article Information
- LEE Jee Eun, CHUNG Ik Kyo, LEE Sang-Rae
- Dynamic genetic features of eukaryotic plankton diversity in the Nakdong River estuary of Korea
- Chinese Journal of Oceanology and Limnology, 35(4): 844-857
- http://dx.doi.org/10.1007/s00343-017-6076-7
Article History
- Received Mar. 14, 2016
- accepted in principle Apr. 20, 2016
- accepted for publication May. 24, 2016


2 Marine Research Institute, Pusan National University, Busan 46241, Korea
Eukaryotic plankton is a key component of aquatic ecosystems, playing important ecological roles including those of primary producer, consumer, prey, predator, and decomposer. Plankton assemblages form the food web and respond to alterations in aquatic environments (Sherr et al., 2007; Suthers and Rissik, 2009). The community structure of several plankton species has been analyzed to investigate the relationships between biological and environmental factors (Duffy et al., 2007). Results from those examinations have been used to understand and predict such environmental changes (Hernando et al., 2015). In an estuarine aquatic ecosystem, dynamic fluctuations arise when various sources of water masses are mixed (e.g., freshwater from river runoff, coastal waters and pelagic seas). This mixing creates diverse aquatic environments that provide special niche habitats for plankton species (Newton and Horner, 2003; Quinlan and Phlips, 2007; Muylaert et al., 2009).
Man-made constructions (e.g., storm-surge barriers, multipurpose dams, and sea dikes) produce hydrological and environmental changes in any coastal region (Ibàñez et al., 1996; Paerl et al., 2011). In particular, an estuarine dam can bring about a rapid and dynamic fluctuation in water masses and plankton biodiversity because new construction artificially controls the input of freshwater (Domingues et al., 2012). One good example of this scenario is the mouth of the Nakdong River in Korea. This major estuary is located in the monsoon region, which has an annual pattern of high rainfall during the summer but low precipitation in winter (Chung et al., 2000). Since the multipurpose dam was built there in 1987, the lower part of the Nakdong River has shown characteristics of a hypertrophic river-reservoir system (Chung et al., 2000, 2013; Ha et al., 2002).
Researchers who investigate biological components require rapid and accurate systems for detecting aquatic biodiversity. Previously, analyses of the structure of plankton communities were done microscopically. However, this morphological approach was limited to resolving species identifications, and was unable to discern much overlap of intra-/inter-specific variations (Sarno et al., 2007; Duff et al., 2008; Balzano et al., 2011). Recent developments in molecular biology have presented many alternative methods to this traditional approach (Not et al., 2007; Guillou et al., 2008; Zinger et al., 2012; Caron and Hutchins, 2013). Metagenomics provides high resolution for the biodiversity of microbiomes within aquatic ecosystems, including lakes, coastal waters, and pelagic oceans (Sherr et al., 2007; DeLong, 2009; Lie et al., 2014). This technique is used to examine how spatial and temporal changes alter the succession of community structures (Balzano et al., 2015; Fortunato and Crump, 2015). Even though estuaries manifest interesting dynamic features of eukaryotic plankton in an aquatic ecosystem, this sequencing approach has not been widely applied for exploring plankton biodiversity (Zinger et al., 2012). Here, we analyze the eukaryotic plankton community in the Nakdong River estuary, Korea. Our goal has been to evaluate how the dynamic features of genetic diversity correspond to changes in salinity within this ecosystem.
2 MATERIAL AND METHOD 2.1 Study areaThe sampling site at Eulsukdo Bridge (ES) is located downstream of the Nakdong estuary barrage in the Nakdong River estuary of Korea, and is influenced by the freshwater input from the Mulgeum (MG) station (Fig. 1). For the current study, samples were collected at ES during summer and autumn 2011, i.e., on 5 August (ES110805), 29 August (ES110829), and 28 October (ES111028). Stations at Jangjado (JJ) and Sunam Bridge (SA) were considered as reference stations (Kim et al., 2010; Lee et al., 2010, 2012a). Water temperature and salinity were measured with YSI 50 meters (YSI Incorporated, USA). According to the conceptual model for salinity gradients developed by Whitfield et al. (2012), samples were classified as Freshwater (0.0 to 0.5), Oligohaline (0.5 to 5.0), Mesohaline (5.0 to 18.0), Polyhaline (18.0 to 30.0), Euhaline (30.0 to 40.0), or Hyperhaline ( > 40.0).

|
| Figure 1 Sites sampled near Nakdong River estuary for current research and previous investigations (with references where applicable) Eulsukdo Bridge (ES; this study plus Lee et al., 2012a), Sunam Bridge (SA; Kim et al., 2010), Jangjado (JJ; Lee et al., 2010), and Mulguem (MG; Lee et al., 2012a). |
For the molecular analysis, 500-mL samples of surface water were placed in sterile bottles and transported to the laboratory. The contents were then passed through a 0.2-μm mixed cellulose membrane filter (Advantec, Japan). Afterwards, the membranes were frozen at -80℃ prior to DNA extractions. All sampling procedures and molecular methods followed those we have used previously (Lee et al., 2010).
2.2 Molecular analysisAfter total genomic DNA was extracted with a DNeasy Plant Mini Kit (Qiagen, Germany) from the biomass-filtered environmental samples, Polymerase Chain Reactions (PCRs) were performed with amfiXpand PCR Master Mix (GenDEPOT, USA). The partial sequence for the 18S rDNA was amplified using Primer A (Medlin et al., 1988) and SSU-inR1 (Lee et al., 2010). Each PCR cycle consisted of initial denaturation at 94℃ for 3 min; then 40 cycles at 94℃ for 30 s, 50℃ for 30 s, and 72℃ for 1 min; followed by a final extension at 72℃ for 7 min. Clone libraries were constructed with TOPO TA Cloning Kits (Invitrogen, USA). The inserted 18S rDNA fragments were selected by colony-PCR and used in PCR-RFLP for pattern analysis. The PCR products with unique putative sequences were sequenced in both directions (Genotech, Korea). Chromatograms were analyzed via Sequencher 5.4 (Gene Codes Corporation, USA). Putative chimera sequences were checked by KeyDNA tools (Guillou et al., 2008) and then removed. The remaining 18S rDNA sequences were deposited in the GenBank database at the National Center for Biotechnology Information (NCBI; USA). Similarities among sequences were examined with the Basic Local Alignment Search Tool (BLAST) of GenBank. Taxonomic groups were selected as reference sequences for species with the highest similarity ( > 97%), based on BLAST results. Phylotypes with low similarity were categorized as unclassified eukaryotic clones after comparing them with known species. Any phylotype with the same species name was chosen for examining intra-/interspecific biodiversity, and the genetic distances among phylotypes and reference sequences were calculated by MEGA 5.0 (Tamura et al., 2011) and the Kimura-2 parameter method (Kimura, 1980). In cases where the NCBI database contained only one reference sequence for a particular genus or species, genetic distance could not be calculated. For phylogenetic analysis, sequences were aligned by Clustal X ver. 1.8 (Thompson et al., 1997) and phylogenetic trees were constructed by the Neighbor-Joining (NJ) method (Saitou and Nei, 1987), using PAUP 4.0 (Swofford, 2001). Bootstrap analyses were used with 2 000 replicates to estimate the robustness of the NJ trees. The communities of sequences were clustered based on Jaccard's Index (Jclass), using the MOTHUR program ver. 1.33.2 (Schloss et al., 2009). The sequence data set included phylotypes obtained from previous studies of the Nakdong River system: for freshwater, SA18S (Kim et al., 2010) and MG100929 (Lee et al., 2012a); for brackish water, JJ18S (Lee et al., 2010) and ES100929 (Lee et al., 2012a); and for seawater from the coast near the Nakdong River estuary, NH18S (Namhae, Kim et al., 2010) and NKC2, NKC3, and NKC4 (Nakdong river coast, Yoon et al., 2012).
3 RESULTOur data demonstrated wide fluctuations in water temperatures and salinity gradients across sampling dates at the fixed site. These included respective values of 27.3℃ and 0.3 recorded for ES110805, 25.6℃ and 10.8 for ES110829, and 18.6℃ and 29.5 for ES111028. The earliest sample was categorized as freshwater, while the samples taken later in summer had mesohaline characteristics (5 to 18), which is typical of brackish water. In contrast, salinity for the sample in autumn was close to that associated with seawater, i.e., polyhaline conditions (Whitfield et al., 2012).
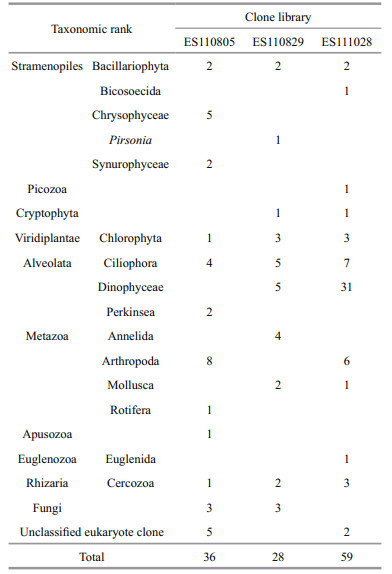
In all we analyzed 456 clones and isolated 122 phylotypes. For the ES110805 library, the 18S rDNA sequences of its 36 phylotypes/128 clones had Accession Numbers JN979515 through JN979550; for ES110829, its 28 phylotypes/168 clones were numbered JX945674 through JX945701; and for ES111028, its 59 phylotypes/160 clones were numbered JX945702 through JX945760. Various taxonomic groups were revealed in water samples collected from the same station (ES) on three separate dates. Our 18S rDNA metagenomics information matched that for autotrophic phytoplankton (e.g., Chlorophyta, seven phylotypes; Cercozoa, six; and Bacillariophyta, six), and many zooplankton groups were associated with members of Arthropoda, Annelida, Mollusca, and Rotifera. In addition, these phylotypes showed diverse taxonomic lineages affiliated with Stramenopiles, Cryptophyta, Ciliophora, Perkinsea, Apusozoa, Euglenozoa, Rhizaria, Picozoa, and Fungi. Arthropoda accounted for the highest proportion of diversity in the freshwater samples, while the seawater samples were dominated by Dinophyceae (Table 1, Fig. 2). Our estuarine environments also included seven unclassified eukaryotic clones, i.e., ES110805-21, -35, -68, -70, and -84; plus ES111028-66 and -72.
|

|
| Figure 2 Neighbor-joining trees constructed to depict molecular phylogenetic relationships among 18S rDNA phylotypes and reference sequences (a); simplification of other taxonomic groups (b); and positioning of Metazoan groups (c) Clone libraries are represented as hollow circle: ES110805 (Salinity: 0.3); grey dot: ES110829 (10.8); and black dot: ES111028 (29.5). |
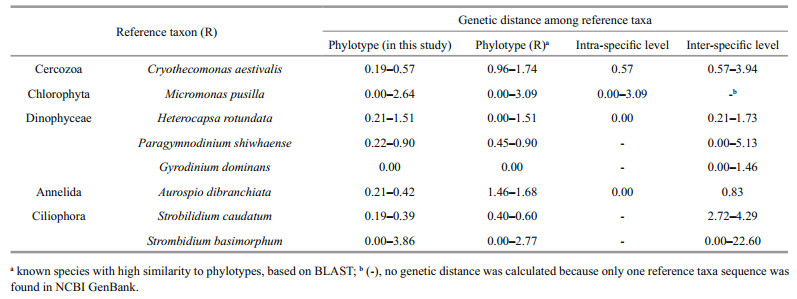
The extent of genetic diversity was calculated among several phylotypes from each clone library, i.e., Strobilidium caudatum (ES110805); Aurosipo dibranchiata (ES110829); and Heterocapsa rotundata and Paragymnodinium shiwhaense (ES111028). Diversity was also co-revealed from the libraries for Gyrodinium dominans, Strombidium basimorphum, Micromonas pusilla, and Cryothecomonas aestivalis when the ES110829 and ES111028 samples were compared (Table 2, Fig. 3). The genetic distance at the intra-/inter-specific level among reference taxa covered almost the entire range of genetic variation among phylotypes from the Nakdong River estuary (Table 2). Because we had selected clones with unique patterns via PCR-RFLP, the minimum values for intra-specific genetic distance of phylotypes from each clone library were higher than 0.00. For Strombidium basimorphum, the maximum intraspecific distance was 3.86, which was greater than the 2.77 calculated among known species. Therefore, we included ES111028-73 when analyzing inter-specific levels but not intra-specific levels.
|

|
| Figure 3 Phylogenetic tree constructed by NJ method from 18S rDNA sequences closely related to Heterocapsa rotundata (a), Gyrodinium dominans (b), Strobilidium caudatum (c), Aurospio dibranchiata (d), Paragymnodinium shiwhaense (e), Strombidium basimorphum (f), Micromonas pusilla (g), and Cryothecomonas aestivalis (h) |
The phylogenetic tree indicated that the phylotypes clustered together with reference sequences for the species and several environmental reference sequences (Fig. 3). The Heterocapsa, Gyrodinium, Strombidium, Aurospio, and Micromonas groups contained the phylotypes reported from previous studies of the Nakdong River system. The reference sequences for the Heterocapsa tree included six phylotypes from ES100929 (Fig. 3a; JN979490, JN979494, JN979498, JN979505, JN979507, and JN979508; Lee et al., 2012a), and the Gyrodinium groups clustered together with JN979489, JN979495, JN97950, and JN815001 (Fig. 3b). In the NJ tree of the Strobilidium group, phylotypes ES110805-1, -36, -65, and -97 were formed one clade with S. caudatum (Fig. 3c). The ES110829-3, -18, and -79 were associated with A. dibranchiata (EU340092) but formed a separate clade that included JN979509 (Fig. 3d). For the phylogenetic tree of Paragymnodinium, the group included only phylotypes from the Nakdong River estuary (Fig. 3e; ES111028-2, -3, -23, -99, and -134), which was similar to the groups for Strombidium (Fig. 3f; ES111029-91, -122, and GQ899155), Micromonas (Fig. 3g; ES110829-82 and GQ899155), and Cryothecomons (Fig. 3h; ES110829-49, -19, and -135). By comparison, the NJ trees of Strombidium showed no clustering of the sequence (ES111028-73) at the inter-specific level (Fig. 3f).
The dendrogram of similarity among our libraries and those for reference clones near the Nakdong River estuary revealed that environmental samples clustered together according to salinity (Fig. 4). Phylotypes from three clone libraries with different levels of salinity were restricted in their distribution patterns. Although a few 18S rDNA phylotypes were found in the ES110805 and ES111028 samples, almost all of the co-occurring phylotypes were represented between ES110805 and ES111028 (Fig. 5). Only one co-revealed phylotype was found between ES110805 and ES110829 [ES110805-9 and ES110829-54: 100% similarity with Skeletonema costatum (AB948141)] while two phylotypes were shared between ES110829 and ES111028 [ES110829-11 and ES111028-62: 100% similarity with uncultured eukaryote clone HM227074; ES110829-12 and ES111028-25: 100% similarity with Gyrodinium dominans (FN669510)]. No common sequences were observed between ES110805 and ES111028.

|
| Figure 4 Dendrogram including metagenomic phylotypes for samples from freshwater (SA18S, Kim et al., 2010; MG100929, Lee et al., 2012a), brackish water (JJ18S, Lee et al., 2010; ES100929, Lee et al., 2012a) in Nakdong River system, and seawater (NH18S, Kim et al., 2010; NKCs, Yoon et al., 2012) Symbols for libraries are explained in Fig. 2. |

|
| Figure 5 Categorization of known species based on water salinity of their habitats as reported here or in published references Black dot: phylotypes related to reference taxa and found in current study; arrow line: range reported for salinity values in taxonomic and ecological references for individual species. |
Various taxonomic groups identified in the present study have been previously described from the Nakdong River estuary. Chung et al. (2013) reviewed results from ecological research of plankton flora that had been conducted since barrage construction on the Nakdong River in 1987. Those earlier surveys described 12 higher taxonomic lineages, including three cyanobacterial groups and a group of Streptophyta land plants. There, microscopic examinations indicated that diatoms and chlorophytes were the dominant taxonomic groups. Even greater diversity was found among eukaryotes when the molecular approach was taken, as discussed here. Among taxonomic groups, eight were not previously reported, including Annelida, Apusozoa, Bicosoecida, Cercozoa, Mollusca, Perkinsea, Picozoa, and Pirsonia. Furthermore, although Ciliophora were not thoroughly investigated in earlier morphological studies (Chung et al., 2013), we were able to identify 16 phylotypes in that genus from freshwater, brackish, and seawater samples, thereby demonstrating the wide distribution of biodiversity along a salinity gradient despite important temporal variations. Our current evaluation also revealed seven clones of putative novel taxonomic groups that are considered unclassified eukaryotes.
When communities were considered, we found that those within ES110805 were similar to two freshwater environments, i.e., SA18S (Kim et al., 2010) and MG100929 (Lee et al., 2012a) while other clone libraries clustered with estuarine water samples from the Nakdong River, i.e., JJ18S (Lee et al., 2010) and ES100929 (Lee et al., 2012a). Kim et al. (2010) reported that freshwater samples from the Nakdong River system produced values of 3.2℃ and 0.29 on 3 January 2009 versus 23.0℃ and 28.0 for seawater samples at Namhae (NH18S) on July 30 of that year. Although none of the other studies included specific environmental measurements, this pattern in our 18S rDNA metagenomics information reflects the biodiversity that was associated with particular environments. Lozupone and Knight(2005, 2007) analyzed the bacterial diversity of 222 environmental samples and suggested that the microbial communities were arranged according to salinity. Although Balzano et al. (2015) reported that small eukaryote dissimilarities were not related to abiotic factors, the phylogenetic composition of a bacterial community could also change and adapt to intermediate salinity conditions, as shown in the estuary of Plum Island Sound, Massachusetts, USA (Crump et al., 2004) and the coastal margin of the Colombia River (Fortunato and Crump, 2015). Our phylotypes also matched sequences named in previous metagenomics studies near the Nakdong River estuary. Therefore this high reproducibility, which is typical of the metagenomics method, showed that it is possible to develop a database of species composition based on existing research and comparative analyses of genetic information (Bazin et al., 2014).
4.2 Presence of higher taxonomic groups and cryptic biodiversity at the intra-/inter-specific levelsThe Nakdong River estuary included several phylotypes of putative higher taxonomic ranks and cryptic biodiversity. Metagenomic analyses have revealed many unculturable organisms and novel lineages (Moon-van der Staay et al., 2001; Sogin et al., 2006; Not et al., 2007), and phylogenetic analyses have indicated considerable genetic heterogeneity of individuals within a particular species (Šlapeta et al., 2006; Guillou et al., 2008). Moreover, the environmental sequences obtained from the metagenomics analysis suggest that different groupings of some genera can co-occur within samples (Guillou et al., 2008). Although unclassified eukaryote clones from this estuary were very similar to uncultured environmental sequences derived via metagenomics research, they showed low similarity with other known taxa. For example, ES110805-70 was the least similar to Pirsonia guinaridiae (AJ561112; 88%) and was only distantly related to members of Synurophyceae and Chrysophyceae (Fig. 2). Our results using KeyDNA tools indicated that ES110805-70 could be placed in Dinophyceae and Arthropoda (data not shown). However, ES110805-70 was highly similar to uncultured eukaryote clone GU049602, but those phylotypes did not cluster with the Pirsonia group (Fig. 2). Based on their taxonomic positions, we might infer that they represent novel taxonomic entities not previously reported.
In comparing phylotypes from the same or different clone libraries, we detected several taxa with large genetic diversity and cryptic biodiversity (Table 2, Fig. 3). In one single-clone library, the dinoflagellates Heterocapsa spp. and Paragymnodinium shiwhaense, the ciliate Strobilidium caudatum, and phylotypes related to Aurospio dibranchiata (Annelida) presented diverse genotypes. For H. rotundata, the phylotypes grouped with reference sequences (AF274267; > 99%) while their environmental sequences from surface seawater samples were distinctive from H. triquetra. However, ES111028-16 clustered with another unclassified eukaryote, KJ757837 and AY664882 (Fig. 3a). The genetic variation among phylotypes, including ES111028-16, ranged from 0.2% to 1.5%, and those values were within the inter-specific level for Heterocapsa spp. (Table 2). Therefore, these findings demonstrate a potentially new taxonomic sequence for the genus Heterocapsa and indicate that diverse genotypes in some taxa can be identified based on information gained via the 18S rDNA metagenomics approach. This is especially apparent for the three phylotypes related to Micromonas pusilla, a unicellular phototroph that serves as a good example of a cryptic species complex (Šlapeta et al., 2006; Pedrós-Alió et al., 2015). Šlapeta et al. (2006) have examined M. pusilla strains isolated from several collection sites and reported distinct lineages based on multigene analyses. In the five lineages for Micromonas, we found that our ES111028-78 clone clustered with lineage E (DQ025753), which has been detected in regions of the Arctic and Mediterranean. Because the phylotypes from ES110829 formed another group, they may represent different cryptic diversities of Micromonas (Fig. 3).
4.3 Species composition and distribution along salinity gradientsOur metagenomics data provided evidence that the distribution pattern of community structure followed that of the salinity gradient. When zooplankton distribution was mapped, Pseudodiaptomus euryhalinus (KC815329) was found only in seawater while clones related to Bosmina and Moina occurred only in a freshwater environment (Fig. 5). Species that include diatoms, dinoflagellates, fungi, and Ciliophora are able to withstand changes across the salinity gradient (Muylaert et al., 2009). Even though we found little eukaryotic plankton over the whole range of salinity associated with this estuary, we sought to detect the co-presence of phylotypes among different samples. Phylotypes representing the marine diatom Skeletonema costatum appeared in both freshwater and brackish water, and Gyrodinium dominans occurred in brackish water and seawater. The species of Skeletonema are known as euryhaline, and dinoflagellates are tolerant of a broad range of salinities (Litaker et al., 2002). The euryhaline diatoms and dinoflagellates were influenced by changes in salinity and were the dominant species in estuarine environments (Quinlan and Phlips, 2007; Muylaert et al., 2009). Some marine species can also extend into low-saline environments and sometimes even into freshwater (Whitfield et al., 2012). In particular, S. costatum and S. subsalsum can survive salinity levels of 1 to 35 (Sarno et al., 2007; Balzano et al., 2011).
In the estuary of the Nakdong River, the opening and closing of the dam can rapidly disrupt the water environment (Chung et al., 2000). Due to the speed of these man-made changes, aquatic organisms such as eukaryotic plankton experience salinity shock rather than responding as they might to a natural salinity gradient (Domingues et al., 2012). When runoff rates are high, extreme freshwater inputs can alter estuarine habitats, making them more favorable for chlorophytes, Cryptomonas, chrysophytes (Paerl et al., 2006; Valdes-Weaver et al., 2006), and Moina spp. (Petrusek, 2002). The community structure in our freshwater sample ES110805 reflected this type of change. Moreover, the environments associated with intermediate levels of salinity can host a mixture of river and coastal ocean members (Whitfield et al., 2012; Fortunato and Crump, 2015). Our assessment of the habitats supporting closely related dinoflagellate species showed that the presence of many of these phylotypes was affected by high salinity and that the inflow of seawater had an adverse influence on populations at our estuarine sampling station. Almost all of the dinoflagellate clones sampled from seawater belonged to Gyrodinium spp., Heterocapsa spp., Paragymnodinium shiwhaense, and Amoebophrya spp. The large proportion of dinoflagellates in seawater were quite similar to that described from the East Sea (Lee et al., 2012b) or the Tara Oceans project (Lima-Mendez et al., 2015).
5 CONCLUSIONIn this metagenomics analysis, the 122 phylotypes (456 clones) of 18S rDNAs from the aquatic environment showed that this estuary comprises various species and exhibits cryptic genetic diversity at the intra-and inter-specific levels. The pattern of seawater phylotypes indicates that dinoflagellates account for the large proportion of overall diversity. Moreover, the biodiversity of freshwater samples demonstrates that extreme freshwater inputs can alter estuarine habitats. This pattern of biodiversity can reflect the ecological relationship between activity by microbial organisms and their aquatic environment according to salinity gradients. These detailed and accurate databases, along with results obtained through a metagenomics approach, can provide biological information suitable to help identify the environmental characteristics of organisms as well as their capacity to adapt to different ecological niches.
| Balzano S, Abs E, Leterme S C, 2015. Protist diversity along a salinity gradient in a coastal lagoon. Aquat. Microb. Ecol., 74(3): 263–277. Doi: 10.3354/ame01740 |
| Balzano S, Sarno D, Kooistra W H C F, 2011. Effects of salinity on the growth rate and morphology of ten Skeletonema strains. J. Plankton Res., 33(6): 937–945. Doi: 10.1093/plankt/fbq150 |
| Bazin P, Jouenne F, Friedl T, Deton-Cabanillas A F, Le Roy B, Véron B, 2014. Phytoplankton diversity and community composition along the estuarine gradient of a temperate macrotidal ecosystem:combined morphological and molecular approaches. PLoS One, 9(4): e94110. Doi: 10.1371/journal.pone.0094110 |
| Caron D A, Hutchins D A, 2013. The effects of changing climate on microzooplankton grazing and community structure:drivers, predictions and knowledge gaps. J. Plankton Res., 35(2): 235–252. Doi: 10.1093/plankt/fbs091 |
| Chung I K, Kang Y J, Kwon O S, Seo J K, 2000. The ecology of phytoplankton in the Naktong estuary. Algae, 15(2): 99–110. |
| Chung I K, Kim N L, Song E H, Lee J E, Lee S R, 2013. Literature survey on the phytoplankton flora in the Nakdong River estuary, Korea. Kor. J. Fish. Aquat. Sci., 46(4): 467–487. |
| Crump B C, Hopkinson C S, Sogin M L, Hobbie J E, 2004. Microbial biogeography along an estuarine salinity gradient:combined influences of bacterial growth and residence time. Appl. Environ. Microbiol., 70(3): 1 494–1 505. Doi: 10.1128/AEM.70.3.1494-1505.2004 |
| DeLong E F, 2009. Review article the microbial ocean from genomes to biomes. Nature, 459(7244): 200–206. Doi: 10.1038/nature08059 |
| Domingues R B, Barbosa A B, Sommer U, Galvão H M, 2012. Phytoplankton composition, growth and production in the Guadiana estuary (SW Iberia):unraveling changes induced after dam construction. Sci. Total Environ., 416: 300–313. Doi: 10.1016/j.scitotenv.2011.11.043 |
| Duff R J, Ball H, Lavrentyev P J, 2008. Application of combined morphological-molecular approaches to the identification of planktonic protists from environmental samples. J. Eukaryot. Microbiol., 55(4): 306–312. Doi: 10.1111/jeu.2008.55.issue-4 |
| Duffy J E, Cardinale B J, France K E, Mclntyre P B, Thébault E, Loreau M, 2007. The functional role of biodiversity in ecosystems:incorporating trophic complexity. Ecol. Lett., 10(6): 522–538. Doi: 10.1111/ele.2007.10.issue-6 |
| Fortunato C S, Crump B C, 2015. Microbial gene abundance and expression patterns across a river to ocean salinity gradient. PLoS One, 10(11): e0140578. Doi: 10.1371/journal.pone.0140578 |
| Guillou L, Viprey M, Chambouvet A, Welsh R M, Kirkham A R, Massana R, Scanlan D J, Worden A Z, 2008. Widespread occurrence and genetic diversity of marine parasitoids belonging to Syndiniales (Alveolata). Environ. Microbiol., 10(12): 3 349–3 365. Doi: 10.1111/emi.2008.10.issue-12 |
| Ha K, Jang M H, Joo G J, 2002. Spatial and temporal dynamics of phytoplankton communities along a regulated river system, the Nakdong River, Korea. Hydrobiologia, 470(1-3): 235–245. |
| Hernando M, Schloss I R, Malanga G, Almandoz G O, Ferreyra G A, Aguiar M B, Puntarulo S, 2015. Effects of salinity changes on coastal Antarctic phytoplankton physiology and assemblage composition. J. Exp. Mar. Biol. Ecol., 466: 110–119. Doi: 10.1016/j.jembe.2015.02.012 |
| Ibàñez C, Prat N, Canicio A, 1996. Changes in the hydrology and sediment transport produced by large dams on the lower Ebro River and its estuary. Regul. Rivers Res. Manag., 12(1): 51–62. Doi: 10.1002/(ISSN)1099-1646 |
| Kim B K, Lee S R, Lee J A, Chung I K, 2010. Molecular monitoring of plankton diversity in the Seonakdong River and along the coast of Namhae. The Sea, 15(1): 25–35. |
| Kimura M, 1980. A simple method for estimating evolutionary rates of base substitutions through comparative studies of nucleotide sequences. J. Mol. Evol., 16(2): 111–120. Doi: 10.1007/BF01731581 |
| Lee J E, Lee S R, Youn S H, Chung S O, Lee J A, Chung I K, 2012a. Molecular monitoring of eukaryotic plankton diversity at Mulgeum and Eulsukdo in the lower reaches of the Nakdong River. The Sea, 17(3): 160–180. Doi: 10.7850/jkso.2012.17.3.160 |
| Lee S R, Oak J H, Chung I K, Lee J A, 2010. Effective molecular examination of eukaryotic plankton species diversity in environmental seawater using environmental PCR, PCR-RFLP, and sequencing. J. Appl. Phycol., 22(6): 699–707. Doi: 10.1007/s10811-010-9509-7 |
| Lee S R, Rho T K, Oak J H, Lee J A, Lee T, Chung I K, 2012b. Metagenomic examination of diversity within eukaryotic plankton from the Ulleung Basin in the East Sea of Korea. J. Plant Biol., 55(4): 310–315. Doi: 10.1007/s12374-011-0031-0 |
| Lie A A Y, Liu Z F, Hu S K, Jones A C, Kim D Y, Countway P D, Amaral-Zettler L A, Cary S C, Sherr E B, Sherr B F, Gast R J, Caron D A, 2014. Investigating microbial eukaryotic diversity from a global census:insights from a comparison of pyrotag and full-length sequences of 18S rRNA genes. Appl. Environ. Microbiol., 80(14): 4 363–4 373. Doi: 10.1128/AEM.00057-14 |
| Lima-Mendez G, Faust K, Henry N, et al, 2015. Determinants of community structure in the global plankton interactome. Science, 348(6237): 1262073. Doi: 10.1126/science.1262073 |
| Litaker R W, Tester P A, Duke C S, Kenney B E, Pinckney J L, Ramus J, 2002. Seasonal niche strategy of the bloomforming dinoflagellate Heterocapsa triquetra. Mar. Ecol. Prog. Ser., 232: 45–62. Doi: 10.3354/meps232045 |
| Lozupone C A, Knight R, 2007. Global patterns in bacterial diversity. Proc. Natl. Acad. Sci. U. S. A., 104(27): 11 436–11 440. Doi: 10.1073/pnas.0611525104 |
| Lozupone C, Knight R, 2005. UniFrac:a new phylogenetic method for comparing microbial communities. Appl. Environ. Microbiol., 71(12): 8 228–8 235. Doi: 10.1128/AEM.71.12.8228-8235.2005 |
| Medlin L, Elwood H J, Stickel S, Sogin M L, 1988. The characterization of enzymatically amplified eukaryotic 16S-like rRNA-coding regions. Gene, 71(2): 491–499. Doi: 10.1016/0378-1119(88)90066-2 |
| Moon-van der Staay S Y, de Wachter R, Vaulot D, 2001. Oceanic 18S rDNA sequences from picoplankton reveal unsuspected eukaryotic diversity. Nature, 409(6820): 607–610. Doi: 10.1038/35054541 |
| Muylaert K, Sabbe K, Vyverman W, 2009. Changes in phytoplankton diversity and community composition along the salinity gradient of the Schelde estuary(Belgium/The Netherlands). Estuar. Coast. Shelf Sci., 82(2): 335–340. Doi: 10.1016/j.ecss.2009.01.024 |
| Newton J A, Horner R A, 2003. Use of phytoplankton species indicators to track the origin of phytoplankton blooms in Willapa Bay, Washington. Estuaries, 26(4): 1 071–1 078. Doi: 10.1007/BF02803364 |
| Not F, Gausling R, Azam F, Heidelberg J F, Worden A Z, 2007. Vertical distribution of picoeukaryotic diversity in the Sargasso Sea. Environ. Microbiol., 9(5): 1 233–1 252. Doi: 10.1111/emi.2007.9.issue-5 |
| Paerl H W, Hall N S, Calandrino E S, 2011. Controlling harmful cyanobacterial blooms in a world experiencing anthropogenic and climatic-induced change. Sci. Total Environ., 409(10): 1 739–1 745. Doi: 10.1016/j.scitotenv.2011.02.001 |
| Paerl H W, Valdes L M, Peierls B L, Adolf J E, Harding Jr L W, 2006. Anthropogenic and climatic influences on the eutrophication of large estuarine ecosystems. Limnol. Oceanogr., 51(1part2): 448–462. Doi: 10.4319/lo.2006.51.1_part_2.0448 |
| Pedrós-Alió C, Potvin M, Lovejoy C, 2015. Diversity of planktonic microorganisms in the Arctic Ocean. Prog. Oceanogr., 139: 233–243. Doi: 10.1016/j.pocean.2015.07.009 |
| Petrusek A, 2002. Moina (Crustacea:Anomopoda, Moinidae) in the Czech Republic:a review. Acta. Soc. Zool. Bohem., 66: 213–220. |
| Quinlan E L, Phlips E J, 2007. Phytoplankton assemblages across the marine to low-salinity transition zone in a blackwater dominated estuary. J. Plankton Res., 29(5): 401–416. Doi: 10.1093/plankt/fbm024 |
| Saitou N, Nei M, 1987. The neighbor-joining method:a new method for reconstructing phylogenetic trees. Mol. Biol. Evol., 4(4): 406–425. |
| Sarno D, Kooistra W H C F, Balzano S, Hargraves P E, Zingone A, 2007. Diversity in the genus Skeletonema (Bacillariophyceae):Ⅲ. Phylogenetic position and morphological variability of Skeletonema costatum and Skeletonema grevillei, with the description of Skeletonema ardens sp. nov.. J. Phycol., 43(1): 156–170. Doi: 10.1111/jpy.2007.43.issue-1 |
| Schloss P D, Westcott S L, Ryabin T, Hall J R, Hartmann M, Hollister E B, Lesniewski R A, Oakley B, Parks D H, Robinson C J, Sahl J W, Stres B, Thallinger G G, Van Horn D J, Weber C F, 2009. Introducing MOTHUR:open-source, platform-independent, community-supported software for describing and comparing microbial communities. Appl. Environ. Microbiol., 75(23): 7 537–7 541. Doi: 10.1128/AEM.01541-09 |
| Sherr B F, Sherr E, Caron D A, Vaulot D, Worden A Z, 2007. Oceanic protists. Oceanography, 20(2): 130–134. Doi: 10.5670/oceanog |
| Šlapeta J, López-García P, Moreira D, 2006. Global dispersal and ancient cryptic species in the smallest marine eukaryotes. Mol. Biol. Evol., 23(1): 23–29. |
| Sogin M L, Morrison H G, Huber J A, Welch D M, Huse S M, Neal P R, Arrieta J M, Herndl G J, 2006. Microbial diversity in the deep sea and the underexplored "rare biosphere". Proc. Natl. Acad. Sci. U. S. A., 103(32): 12 115–12 120. Doi: 10.1073/pnas.0605127103 |
| Suthers I M, Rissik D. 2009. Plankton: A Guide to Their Ecology and Monitoring for Water Quality. CSIRO Publishing, Collingwood, VIC, Australia. 256p. |
| Swofford D L. 2001. PAUP Phylogenetic Analysis Using Parsimony (and other methods), Version 4. Sinauer Associates, Sunderland, MA, USA. |
| Tamura K, Peterson D, Peterson N, Stecher G, Nei M, Kumar S, 2011. MEGA5:molecular evolutionary genetics analysis using maximum likelihood, evolutionary distance, and maximum parsimony methods. Mol. Biol. Evol., 28(10): 2 731–2 739. Doi: 10.1093/molbev/msr121 |
| Thompson J D, Gibson T J, Plewniak F, Jeanmougin F, Higgins D G, 1997. The CLUSTAL_X windows interface:flexible strategies for multiple sequence alignment aided by quality analysis tools. Nucl. Acids Res., 25(24): 4 876–4 882. Doi: 10.1093/nar/25.24.4876 |
| Valdes-Weaver L M, Piehler M F, Pinckney J L, Howe K E, Rossignol K, Paerl H W, 2006. Long-term temporal and spatial trends in phytoplankton biomass and class-level taxonomic composition in the hydrologically variable Neuse-Pamlico estuarine continuum, North Carolina, U.S.A.. Limnol. Oceanogr., 51(3): 1 410–1 420. Doi: 10.4319/lo.2006.51.3.1410 |
| Whitfield A K, Elliott M, Basset A, Blaber S J M, West R J, 2012. Paradigms in estuarine ecology-a review of the Remane diagram with a suggested revised model for estuaries. Estuar. Coast. Shelf Sci., 97: 78–90. Doi: 10.1016/j.ecss.2011.11.026 |
| Yoon J M, Lee J E, Lee S R, Rho T K, Lee J A, Chung I K, Lee T S, 2012. Metagenomic approach on the eukaryotic plankton biodiversity in coastal water of Busan (Korea). The Sea, 17(2): 59–75. Doi: 10.7850/jkso.2012.17.2.059 |
| Zinger L, Gobet A, Pommier T, 2012. Two decades of describing the unseen majority of aquatic microbial diversity. Mol. Ecol., 21(8): 1 878–1 896. Doi: 10.1111/j.1365-294X.2011.05362.x |