 2017, Vol. 35
Institute of Oceanology, Chinese Academy of Sciences
Article Information
- GUO Xiaoyi(郭肖伊), XU Bochao(许博超), YU Zhigang(于志刚), LI Xiuqin(李秀芹), NAN Haiming(南海明), JIAN Huimin(简慧敏), JIANG Xueyan(江雪艳), DIAO Shaobo(刁少波), GAO Maosheng(高茂生)
- Radium isotopes assess water mixing processes and its application in the Zhujiang River estuary
- Chinese Journal of Oceanology and Limnology, 35(5): 1108-1116
- http://dx.doi.org/10.1007/s00343-017-6069-6
Article History
- Received Mar. 10, 2016
- accepted in principle Apr. 22, 2016
- accepted for publication Jul. 23, 2016


2 Laboratory of Marine Ecology and Environmental Science, Qingdao National Laboratory for Marine Science and Technology, Qingdao 266100, China;
3 College of Chemistry and Chemical Engineering, Ocean University of China, Qingdao 266100, China;
4 South China Sea Environmental Monitoring Center, State Oceanic Administration, Guangzhou 510300, China;
5 Qingdao Institute of Marine Geology, Qingdao 266071, China
In estuarine area, river flow provides a source of nutrients, metals and other components into the coastal ocean. As a result, this process would have an impact on the coastal ecosystem. Water age, which was derived from Ra isotopes, has been proved to be an important parameter for understanding the "metabolic rate" of a coastal ecosystem (Moore, 2006a). 223Ra, 224Ra and 226Ra are three naturally occurring radium (Ra) isotopes with half-lives that cover a large temporal range, 3.66 d, 11.4 d and 1 600 y, respectively. The combination of different isotopes could be used as robust tracer for assessment of water mixing and transportation under variable time scales. Short-lived Ra isotopes (224Ra and 223Ra) are especially suitable and popular for spatiotemporal scales like estuarine-coastal zones over days to weeks (e.g., Moore, 2000, 2006b; Peterson et al., 2008; Knee et al., 2011; Xu et al., 2013). Since the early 1990's, some models had been build up to assess 'water age' in coastal regions (Moore and Todd, 1993; Moore, 2000). Water age here, originally is regarded as "the time elapsed since the water sample became enriched in Ra and was isolated from the source" (Moore, 2000). It is an apparent age of an observed site relevant to the chosen source area, which in common cases will be inner shelf water (Moore, 2000), groundwater (Hougham and Moran, 2007;TomaskyHolmes et al., 2013), river water (Moore and Krest, 2004; Dulaiova and Burnett, 2008), or the sampling site with highest activity ratio collected (Peterson et al., 2008; Xu et al., 2016). However, if one just wants to simply compare the relevant hydrodynamics of two sampling sites, either site could be deployed as the source (site 1) and then calculates the apparent water age of the other place (site 2). If a positive age obtained in site 2, water flushing rate there was thought to be slower than which in site 1, and vice versa.
As the second largest river in China, the Zhujiang (Pearl) River is important culturally and economically (Yin and Harrison, 2008). During the past few decades, massive economic growth and urban development in the Zhujiang River estuary (ZRE) have led to an excessive volume of waste water being released into the sea through this estuary. Assessment of estuarine water ages is important to provide a more complete understanding of the flow dynamics for managing the ecological environment effectively. In previous studies, researchers mainly used physical models to examine the estuarine hydrodynamics of the ZRE (Huang et al., 2013; Pei et al., 2013; Ren et al., 2014), but few studies published so far have been based on isotope-tracer techniques (Liu et al., 2012; Wang, 2014). For better understand the estuarine water mixing and transportation processes, it will be more conversable to involve geochemical isotopes data as a synergy.
Therefore, in this work, we try to use Ra isotopes as tracers to assess estuarine hydrodynamics and its ecological influence in the ZRE. The spatial and temporal distribution patterns of all three Ra isotopes (223Ra, 224Ra and 226Ra) in the mouth of the ZRE were examined. By using the "Apparent Radium Age" model, water ages were then calculated and compared to better understand the flow dynamics two different seasons (December and July). Combining these observations with nutrient data (dissolved inorganic nitrogen (DIN) and dissolved inorganic phosphorus (DIP)), chlorophyll-a (chl-a), and suspended particulate matter (SPM) distribution patterns, the ecological influence of the estuarine hydrodynamics was evaluated. Although we only have limited data set, we found that the hydrodynamic difference between western and eastern zone of the ZRE was indeed smaller in summer than which in winter. Our preliminary observation is constant with previous modeling results, which could semi-quantitatively support that river discharge more intensively influenced the east zone of the Zhujiang River estuary in summer. The results of this study will help to improve the knowledge of flow patterns and biogeochemistry within the ZRE.
2 MATERIAL AND METHOD 2.1 Site description and sample collectionThe ZRE is situated along the northern shelf of the South China Sea (Ren et al., 2014). The Zhujiang River is the third longest river in China after the Changjiang (Yangtze) and the Huanghe (Yellow) Rivers (Dong et al., 2004). It consists of three major tributaries: the West River, the North River and the East River (Guo et al., 2008). The rivers in the lower reaches are separated in a radial pattern with eight water channels that eventually flow into the South China Sea. These eight outlets include Humen, Jiaomen, Hengmen, Hongqili, Modaomen, Jitimen, Hutiaomen and Yamen (Nie et al., 2005). About half of the river flow enters the Lingdingyang, which was referred to as "the Zhujiang River estuary" in this paper, through the east four outlets (Fig. 1). The ZRE ecosystem is very important for the economic development of Guangdong, Hong Kong and Macau. Unfortunately, it has been suffering from serious pollution issues due to the rapid industrialization and urbanization in the area (Cai and Li, 2011).

|
| Figure 1 Location of the study area (ZRE) (a); sampling stations in the ZRE (b) Circles denoted by lowercase letters represent stations in December 2012, and triangles denoted by uppercase letters were from July 2013. |
One transect was set up with four sampling sites along the mouth of the ZRE (Fig. 1). Two cruises were conducted in December 2012 (circles) and July 2013 (triangles), respectively. Sampling time were coincided with periods of normal flow year and high flow year, with annual river discharge of 306.1×10⁹ m3 in 2012 and 333.3×10⁹ m3 in 2013 (Zhujiang River Water Resources Commission of the Ministry of Water Resources). The annual average discharge of the whole basin is 10 524 m3/s, 20% of which occurs during the dry season from October to March, and the other 80% occurs during the wet season from April to September (Zhao, 1990; Yin, 2002; Yin et al., 2004; Dai et al., 2008). Temperature and salinity were directly measured on-site. Surface water samples were collected for analysis of Ra isotopes, DIN, DIP, chl-a and SPM.
2.2 Ra isotopes analysisThe concentrations of Ra isotopes could be determined by various methods (Moore, 1984; Butts et al., 1988; Kim et al., 2001). The delayed coincidence counting system (RaDeCC) pioneered by Giffin et al.(1963) and developed by Moore and Arnold (1996) is a state-of-the-art technique for measurement of 223Ra and 224Ra combined with the Mn-fiber extraction method. Recent studies show that the 226Ra activity can also be determined by RaDeCC based on the difference of alpha decay records in all three counting channels (Waska et al., 2008; Peterson et al., 2009). For analysis of Ra, 60 L water was collected for each sample from the surface layer (about 0.5 m). Ra was extracted by passing water samples through Mn-fiber cartridges with flow rates < 1 L/min. Fiber samples were sent back to our laboratory within 3 days. After being washed and moisture adjusted, 223Ra and 224Ra were counted three times within one month via RaDeCC (Moore and Arnold, 1996; Xia et al., 2016). Excess 224Ra activities were corrected for that portion supported by 228Th (Moore and Krest, 2004; Wang et al., 2014). After the analysis of short-lived Ra isotopes, 226Ra was also counted via RaDeCC following the procedures described by Peterson et al.(2009) and Waska et al. (2008). Uncertainties of Ra activities were determined by statistical counting deviation within a 1-σ confidence interval.
2.3 Nutrients (DIN and DIP) analysisFor nutrients, DIN was reported as the sum of NOˉ 3, NO- 2, and NH+ 4; and DIP as PO43-. The water samples were filtered immediately after collection with acetate cellulose filters with 0.45 μm pore-size, and then quickly frozen at -20℃ (Chen et al., 2002). These samples were measured by a QUAATRO ContinuousFlow Analyzer (BRAN+LUEBBE, Germany) in accordance with the methods described by Grasshoff et al. (1999). The analytical precision for all nutrients was better than 3%.
2.4 SPM analysisFor SPM, samples were filtered with 0.45 μm poresize pre-weighted filters. After filtration, the filters were rinsed with Milli-Q water to remove salt and kept frozen. All filter samples were dried in a 60℃ drying oven and weighted to obtain the SPM concentration (GB17378.4-1998).
2.5 Chl-a analysisFor Chl-a, 250 mL water samples were collected and 2 mL (10 g/L) saturated MgCO3 solution was added. After thoroughly mixing, the water samples were filtered with fiberglass filters with 0.45 μm poresize under a vacuum pressure of 50 kPa. Then 10 mL acetone solution (ratio of volume is 9:1) was added, vibrated and placed for 14–24 h in -4℃ to extract the chl-a with the centrifuged solution at a rotation rate of 3 000–4 000 r/min. Finally, the fluorescence of the extract was measured with a spectrophotometer at an excitation wavelength of 436 nm and emission wavelength of 750 nm (GB17378.7-2007). The analytical precision was about 5 %.
3 RESULT AND DISCUSSIONSpatial and temporal variations in temperature, salinity, Ra activity, DIN, DIP, SPM and Chl-a for surface water in the ZRE during winter and summer seasons are presented below. For the benefit of a clear compare, we selected four sites (a(A), b(B), c(C), and d(D)) for further discussion.
3.1 Hydrological characteristicsThe spatial and temporal distributions of temperature and salinity in the ZRE are presented in Fig. 2. It shows high salinity and low temperature in December and the reverse relationship in July. The Zhujiang River discharge is low from October to March, and it starts to increase in April and reaches a maximum in July (Zhao, 1990; Yin et al., 2011). During the dry season in the Zhujiang River basin, seawater could easily enter into the ZRE, especially along the eastern section of the study area (with the average salinity of 32.0 between sites c and d). With prevailing northeast winds in winter (Su, 2004), river water will mainly exit from the western section (with the average salinity of 20.4 between sites a and b), where water was observed to have relatively lower salinity. During the July observations, the river discharge increased resulting in much lower salinities compared with those in December. Lower salinities at sites A and B than at sites C and D implies that the river flow also occurs mainly in the western section. However, there is less of a salinity difference between the western and eastern sections compare to those observed in winter, perhaps because the southwest monsoon resulted in more fresh water being discharged in the eastern part of the ZRE during the summer (Dong et al., 2004). In previous studies, researchers also found that the river plume has distinct monsoonal characteristics. For example, Su (2004) found that ocean water directly entered the middle reach of the ZRE during winter seasons. Ou et al. (2007) reported that low-salinity river runoff was extended progressively westward, and seawater was constrained along the eastern portion of the ZRE during summer. For the convenience of discussion, the study area will be denoted as a western zone (sites a (A) and b (B) with low salinity), and an eastern zone (sites c (C) and station d (D) with high salinity).

|
| Figure 2 Distributions of salinity and temperature in the ZRE in December 2012 and July 2013 Triangles represent data in July and open circles are for samples collected in December. We denote the study area as a western zone (sites a (A) and b (B) with low salinity), and an eastern zone (sites c (C) and station d (D) with high salinity) for the convenience of discussion. a, b, c, d represent stations in winter, A, B, C, D represent stations in summer. |
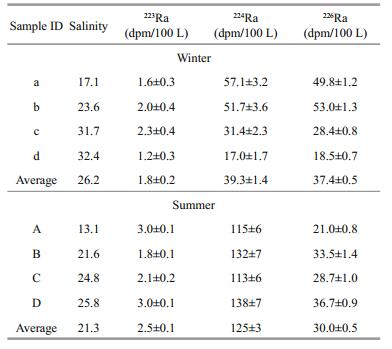
The activities of all three Ra isotopes are shown in Table 1. These data are consistent with results from previous studies. Wang (2014), for example, reported all three Ra isotopes activities in surface waters of the ZRE in summer (August 2012), autumn (October 2012) and winter (December 2010) were 0.41– 11.1 dpm/100 L (223Ra), 6.30–179 dpm/100 L (224Ra) and 8.91–109 dpm/100 L(226Ra), respectively.
|
The seasonal variation patterns for 223Ra, 224Ra and 226Ra in the ZRE are shown in Fig. 3. In summer, 224Ra exhibits significantly higher activities (more than 3 times) than winter. Meanwhile, 223Ra concentrations were also elevated (about 40% higher) in summer. The average values of 226Ra in summer and winter, however, were not significant different. There was more and faster river discharge in summer than which in winter (60% or times higher, e.g., Zhao, 1990; Yin, 2002; Yin et al., 2004; Dai et al., 2008), so more abundant of short lived radium isotopes (with less decay loss) would be observed in the ocean side of the estuary. Long lived 226Ra, however, were not quite different between two seasons. Desorption from SPM via ion-exchange processes would likely be another important Ra source in estuaries, which again, especially for the short-lived species (224Ra and 223Ra) with more regeneration during SPM transportation (Dulaiova and Burnett, 2008). The average SPM concentration was 8 mg/L in winter, which increased by 50% in summer (12 mg/L). Therefore, higher short-lived Ra isotopes in summer may be also related to somehow of a SPM acting as a radium source. The natural activity of 223Ra is about one order of magnitude lower than 224Ra (Dulaiova et al., 2006), so it is not surprising that the seasonal fluctuation of 223Ra was not as notable as 224Ra. With a half-life of 1 600 years, 226Ra would have negligible regeneration on SPM.

|
| Figure 3 Concentrations of 223Ra, 224Ra and 226Ra activities in the mouth of the ZRE in December 2012 and July 2013 Triangles represent data in July and open circles are for samples collected in December. Error bars represent the uncertainties derived from statistical counting deviation of three Ra isotopes. |
The salinity of estuarine water could be another factor that determines the concentrations of dissolved Ra isotopes (Table 1). A typical non-conservative radium-salinity distribution pattern in estuaries shows the peak Ra activities usually appear in the intermediate salinity areas (salinity of 5 to 25). Yuan et al. (2014) conducted a series of laboratory desorption/diffusion experiments and concluded that Ra desorption is greatest at a salinity of 25. However, a slow desorption of Ra will also occur in the salinity range of 25 to 30. Cable et al. (2009) also performed a series of sediment column experiments and the results indicated that radium desorption is strongest at the salinity of 18. Thus, the salinity of maximum Ra desorption is not necessarily constant but may depend upon the SPM characteristics (mineralogy, grain size, etc.). In our case, estuary water was constrained with a relatively moderate salinity range (13.4–25.8) during July. While in December, because of weaker river flow, seawater with higher salinities (17.1–32.4) and lower Ra was more dominant in the ZRE. Therefore, river discharge, the concentration of SPM and salinity were all possible factors leading to the Ra seasonal distribution patterns.
The spatial distribution patterns for radium isotopes in surface waters of the study area are also shown in Fig. 3. In the December sampling, 224Ra and 226Ra concentrations in the western zone were higher than in the eastern zone while the reverse trend was found in July. The spatial distribution patterns of Ra were most likely influenced by the river flow (Dong et al., 2004). River water, containing higher Ra concentrations, tended to flush out of the river mouth along the western coast in both seasons, especially in winter. Because of weaker river flow and the prevailing northeast monsoon in December, seawater with lower Ra would be constrained near the eastern zone of the estuary. However, higher river discharge and a southwestern monsoon during July would direct the river plume to the eastern zone resulting in a reversed Ra distribution pattern between the two seasons. This information was more apparently displayed by using radium than salinity and/or temperature as tracers.
3.3 Apparent water ages in the ZREThe "Apparent Radium Age" model was originally introduced by Moore (2000) and used by multiple authors over the past decade (Dulaiova et al., 2008; Knee et al., 2011). Short-lived Ra isotopes (224Ra and 223Ra) were used to estimate relative water ages in this study area. Here the activity ratio of the shorter-lived isotope (224Ra to 223Ra) was employed to calculate the apparent radium ages:
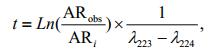
where ARobs refers to the activity ratio at a specific sampling location; ARi is the initial activity ratio (in this case, closest to the source); and λ223 and λ224 represent the 223Ra and 224Ra decay constants, 0.060 8/d and 0.189/d, respectively. The apparent water age, t, represents the calculated time elapsed since the short-lived radium isotopes were added to the system and isolated from the source. In this study, we used the Moore (2000) age model in a different way. We did not intend to quantify the exact water ages of the whole estuary. We just want to compare the hydraulic difference between the east and west part of the estuary, so we deployed the sampling stations in the western zone as the source and calculate the apparent water age of eastern sites.
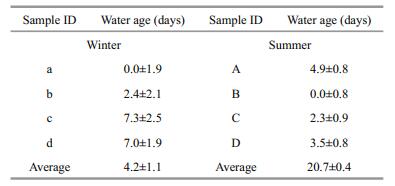
The average apparent water ages based on this model were 2.7±0.4 days in July and 4.2±1.1 days in December (Table 2). The results are consistent with stronger river flow in the ZRE during July. The estimate shows that the relative ages in eastern zone are longer than those in the western sector, and the difference is exaggerated in December. In December, the average water age in the eastern zone (7.1±1.6 days) was higher than that in the western zone (1.2±1.4 days) indicating that the water flushing rate in the western zone was about 5 days faster than the eastern zone. This can also qualitatively conclude from the salinity distribution that large portion of river discharge flushed out of the mouth through the western zone in winter. Therefore, a relatively low river discharge leads to a weaker estuarine dynamics (longer water residence time) in the eastern zone of the ZRE. In July, the average water age in the eastern zone (2.9±0.6 days) was about the same as which in the western zone (2.4±0.6 days). The salinity distributions also confirmed that the difference between the eastern and western zones was smaller in July than that in December (Fig. 3). In the western zone, salinity values in summer were slightly lower than which in winter (Fig. 2). However, even assume the estuarine hydrodynamics was the same, it is still reasonable to infer that river discharge influence in the eastern zone was much higher in summer than winter.
Chl-a is the main green photosynthetic pigment. Jiang et al. (2010) found that chl-a concentration was significantly correlated with primary productivity in the ZRE by using Pearson correlation analysis. Therefore, chl-a was treated as an index to show the intensity of phytoplankton activities in the study area. As previously discussed, the ZRE was mainly controlled by river runoff in July according to the relatively younger water ages. More nutrients could be transported to the estuary sooner by river discharge in summer, and higher nutrient concentrations were observed in studying area, especially DIP (Fig. 4). Previous studies documented that the ZRE ecosystem is generally recognized as stoichiometric P-limitation (Yin et al., 2004), which means DIP is important for primary production in this area. Theoretically, higher DIP concentrations should trigger more intense primary productions. However, as shown in Fig. 4, chl-a concentrations in winter were significantly higher than which in summer. At the same time, we found the SPM concentrations showed significant seasonality. Light penetration is also a very important factor for phytoplankton growth, and the river discharge was found to be the main source of SPM in the estuary (Jia et al., 2005). In summer, estuarine hydrodynamics was strong, and the ZRE was more turbid (SPM ranged from 9.0 to 20.3 mg/L). As a result the optical transmissivity of waters would be largely influenced by suspended particles. It could reduce the photosynthesis by phytoplankton and ultimately lead to low chl-a concentrations. In December, on the other hand, the river discharge was lower and older apparent water ages suggest a more stabilized estuarine environment. Low concentrations of SPM would led to light penetrate deeper into the water. Therefore, phytoplanktons had sufficient time uptake nutrients in a more suitable environment, leading to a higher level of chl-a was in December.

|
| Figure 4 Concentrations of DIN, DIP, SPM and chl-a in the ZRE in December 2012 and July 2013 Triangles represent data in July and open circles are for samples collected in December. |
Previous studies also found that the primary production in the ZRE was mainly limited by SPM. Cai et al. (2004) proposed that light is the main limiting factor to the primary production of the Zhujiang River estuary. Kuang and Jiang (2011) used an ecological model (which was designed in conjunction with a three-dimensional hydrodynamic and sediment model) to estimate the influence factors on the ecologic system in the ZRE. The results showed that the biological growth in summer was mainly limited by SPM, and DIN was abundant that it could not limit the biological growth in the ZRE.
4 CONCLUSIONRa isotopes are useful tracers to investigate water transport processes in the ZRE. The temporal and spatial distribution patterns of 223Ra, 224Ra and 226Ra can be used to indicate the direction of river plume under the changing effects of monsoon and river discharge. "Apparent Radium Age" model was used to estimate relative water ages, and the modelling results indicate that in July the average water age in the western zone was about 5 days longer than in the eastern zone, which in winter were about the same. Based on the comparison of the age differences between the western and eastern zones of the ZRE during the two sampling seasons, one can see that the estuarine hydrodynamics in the eastern zone were significantly enhanced in July. Although nutrient concentrations were higher during July, lower chl-a concentrations indicated lower primary production. This might be caused by high SPM (low light penetration).
5 ACKNOWLEDGEMENTWe would like to thank DONG Xia and the OUC SRDP group members for their assistance during Ra sample analysis. We also acknowledge Professor William C. Burnett for constructive comments and language correction.
| Butts J, Todd J F, Lerche I, Moore W S, Moore D G, 1988. A simplified method for 226Ra determinations in natural waters. Marine Chemistry, 25(4): 349–357. Doi: 10.1016/0304-4203(88)90115-6 |
| Cable J E, Smith C G, Blanford W J, 2009. Dispersivity and distribution coefficients in marine sediments using 3H and 226Ra. Radioprotection, 44(5): 185–190. Doi: 10.1051/radiopro/20095038 |
| Cai M F, Li K M, 2011. Economic losses from marine pollution adjacent to Pearl River Estuary, China. Procedia Engineering, 18: 43–52. Doi: 10.1016/j.proeng.2011.11.008 |
| Cai W J, Dai M H, Wang Y C, Zhai W D, Huang T, Chen S T, Zhang F, Chen Z Z, Wang Z H, 2004. The biogeochemistry of inorganic carbon and nutrients in the Pearl River estuary and the adjacent Northern South China Sea. Continental Shelf Research, 24(12): 1301–1319. Doi: 10.1016/j.csr.2004.04.005 |
| Chen H T, Chen S Z, Zhang J, Liu S M, Wu Q M, 2002. Distribution and changes of specification of phosphorus in the Yellow Sea. Marine Science Bulletin, 4(2): 32–38. |
| Dai M H, Wang L F, Guo X H, Zhai W D, Li Q, He B Y, Kao S J, 2008. Nitrification and inorganic nitrogen distribution in a large perturbed river/estuarine system:the Pearl River Estuary, China. Biogeosciences, 5(5): 1227–1244. Doi: 10.5194/bg-5-1227-2008 |
| Dong L X, Su J L, Wong L A, Cao Z Y, Chen J C, 2004. Seasonal variation and dynamics of the Pearl River plume. Continental Shelf Research, 24(16): 1761–1777. Doi: 10.1016/j.csr.2004.06.006 |
| Dulaiova H, Burnett W C, Wattayakorn G, Sojisuporn P, 2006. Are groundwater inputs into river-dominated areas important? The Chao Phraya River-Gulf of Thailand. Limnology and Oceanography, 51(5): 2232–2247. Doi: 10.4319/lo.2006.51.5.2232 |
| Dulaiova H, Burnett W C, 2008. Evaluation of the flushing rates of Apalachicola Bay, Florida via natural geochemical tracers. Marine Chemistry, 109(3-4): 395–408. Doi: 10.1016/j.marchem.2007.09.001 |
| Giffin C, Kaufman A, Broecker W, 1963. Delayed coincidence counter for the assay of actinon and thoron. Journal of Geophysical Research, 68(6): 1749–1757. Doi: 10.1029/JZ068i006p01749 |
| Grasshoff K, Kremling K, Ehrhardt M. 1999. Methods of Seawater Analysis. 3rd edn. John Wiley & Sons, New York. 600p. |
| Guo X H, Cai W J, Zhai W D, Dai M H, Wang Y C, Chen B S, 2008. Seasonal variations in the inorganic carbon system in the Pearl River (Zhujiang) estuary. Continental Shelf Research, 28(12): 1424–1434. Doi: 10.1016/j.csr.2007.07.011 |
| Hougham A L, Moran S B, 2007. Water mass ages of coastal ponds estimated using 223Ra and 224Ra as tracers. Marine Chemistry, 105(3-4): 194–207. Doi: 10.1016/j.marchem.2007.01.013 |
| Huang S B, Li K M, Jiang G Q, Lu J Q, 2013. Research on water exchange in Pearl River Estuary based on MIKE3 model. Environmental Science and Management, 38(8): 134–140. |
| Jia J J, Gao S, Gao J H, Pan S M, Wang A J, 2005. Linkage of grain size information with river sediment discharge and estuarine deposition at the Pearl River estuary. Advances in Marine Science, 23(3): 297–304. |
| Jiang W X, Lai Z N, Pang S X, Yang W L, Wang C, Gao Y, 2010. Spatio-temporal distribution of chlorophyll-a and primary productivity in the Pearl River Estuary. Journal of Ecology and Rural Environment, 26(2): 132–136. |
| Kim G, Burnett W C, Dulaiova H, Swarzenski P W, Moore W S, 2001. Measurement of 224Ra and 226Ra activities in natural waters using a radon-in-air monitor. Environmental Science & Technology, 35(23): 4680–4683. |
| Knee K L, Garcia-Solsona E, Garcia-Orellana J, Boehm A B, Paytan A, 2011. Using radium isotopes to characterize water ages and coastal mixing rates:a sensitivity analysis. Limnology and Oceanography-Methods, 9(9): 380–395. Doi: 10.4319/lom.2011.9.380 |
| Kuang F F, Jiang Y W, 2011. Numerical study of the effect of suspended sediment and nutrient on biological growth in Pearl River Estuary in summer. Journal of Xiamen University (Natural Science), 50(3): 586–592. |
| Liu Q, Dai M, Chen W, Huh C A, Wang G, Li Q, Charette M A, 2012. How significant is submarine groundwater discharge and its associated dissolved inorganic carbon in a river-dominated shelf system?. Biogeosciences, 9(5): 1777–1795. Doi: 10.5194/bg-9-1777-2012 |
| Moore W S, Arnold R, 1996. Measurement of 223Ra and 224Ra in coastal waters using a delayed coincidence counter. Journal of Geophysical Research, 101(C1): 1321–1329. Doi: 10.1029/95JC03139 |
| Moore W S, Krest J, 2004. Distribution of 223Ra and 224Ra in the plumes of the Mississippi and Atchafalaya Rivers and Gulf of Mexico. Marine Chemistry, 86(3-4): 105–119. Doi: 10.1016/j.marchem.2003.10.001 |
| Moore W S, Todd J F, 1993. Radium isotopes in the Orinoco estuary and eastern Caribbean Sea. Journal of Geophysical Research, 98(C2): 2233–2244. Doi: 10.1029/92JC02760 |
| Moore W S, 1984. Radium isotope measurements using germanium detectors. Nuclear Instruments and Methods in Physics Research, 223(2-3): 407–411. Doi: 10.1016/0167-5087(84)90683-5 |
| Moore W S, 2000. Ages of continental shelf waters determined from 223Ra and 224Ra. Journal of Geophysical Research, 105(C9): 22117–22122. Doi: 10.1029/1999JC000289 |
| Moore W S, 2006a. The role of submarine groundwater discharge in coastal biogeochemistry. Journal of Geochemical Exploration, 88(1-3): 389–393. Doi: 10.1016/j.gexplo.2005.08.082 |
| Moore W S, 2006b. Radium isotopes as tracers of submarine groundwater discharge in Sicily. Continental Shelf Research, 26(7): 852–861. Doi: 10.1016/j.csr.2005.12.004 |
| Nie X P, Lan C Y, Wei T L, Yang Y F, 2005. Distribution of polychlorinated biphenyls in the water, sediment and fish from the Pearl River estuary, China. Marine Pollution Bulletin, 50(5): 537–546. Doi: 10.1016/j.marpolbul.2004.11.046 |
| Ou S Y, Zhang H, Wang D X, He J, 2007. Horizontal characteristics of buoyant plume off the Pearl River Estuary during summer. Journal of Coastal Research, 50: 652–657. |
| Pei M F, Li S Y, Hu J T, Hu X S, 2013. Simulation of the water exchange in the Pearl River Estuary during wet and dry seasons. Journal of Tropical Oceanography, 32(6): 28–35. |
| Peterson R N, Burnett W C, Dimova N T, Santos I R, 2009. Comparison of measurement methods for radium-226 on manganese-fiber. Limnology and Oceanography Methods, 7(2): 196–205. Doi: 10.4319/lom.2009.7.196 |
| Peterson R N, Burnett W C, Taniguchi M, Chen J Y, Santos I R, Misra S, 2008. Determination of transport rates in the Yellow River-Bohai Sea mixing zone via natural geochemical tracers. Continental Shelf Research, 28(19): 2700–2707. Doi: 10.1016/j.csr.2008.09.002 |
| Ren Y H, Lin B L, Sun J, Pan S Q, 2014. Predicting water age distribution in the Pearl River Estuary using a threedimensional model. Journal of Marine Systems, 139: 276–287. Doi: 10.1016/j.jmarsys.2014.07.005 |
| Su J L, 2004. Overview of the South China Sea circulation and its influence on the coastal physical oceanography outside the Pearl River Estuary. Continental Shelf Research, 24(16): 1745–1760. Doi: 10.1016/j.csr.2004.06.005 |
| Tomasky-Holmes G, Valiela I, Charette M A, 2013. Determination of water mass ages using radium isotopes as tracers:implications for phytoplankton dynamics in estuaries. Marine Chemistry, 156: 18–26. Doi: 10.1016/j.marchem.2013.02.002 |
| Wang S L. 2014. Submarine groundwater discharge and associated fluxes of nutrients and carbon into the Pearl River estuary. Xiamen University, Xiamen, China. 52p. (in Chinese with English abstract) |
| Wang X L, Du J Z, Ji T, Wen T Y, Liu S M, Zhang J, 2014. An estimation of nutrient fluxes via submarine groundwater discharge into the Sanggou Bay-A typical multi-species culture ecosystem in China. Marine Chemistry, 167: 113–122. Doi: 10.1016/j.marchem.2014.07.002 |
| Waska H, Kim S, Kim G, Peterson R N, Burnett W C, 2008. An efficient and simple method for measuring 226Ra using the scintillation cell in a delayed coincidence counting system (RaDeCC). Journal of Environmental Radioactivity, 99(12): 1859–1862. Doi: 10.1016/j.jenvrad.2008.08.008 |
| Xia D, Yu Z G, Xu B C, Gao M S, Mi T Z, Jiang X Y, Yao P, 2016. Variations of hydrodynamics and submarine groundwater discharge in the Yellow River estuary under the influence of the water-sediment regulation scheme. Estuaries and Coasts, 39(2): 333–343. Doi: 10.1007/s12237-015-9994-7 |
| Xu B C, Dimova N T, Zhao L, Jiang X Y, Yu Z G, 2013. Determination of water ages and flushing rates using short-lived radium isotopes in large estuarine system, the Yangtze River Estuary, China. Estuarine, Coastal and Shelf Science, 121-122: 61–68. Doi: 10.1016/j.ecss.2013.02.005 |
| Xu B C, Yang D S, Burnett W C, Ran X B, Yu Z G, Gao M S, Diao S B, Jiang X Y, 2016. Artificial water sediment regulation scheme influences morphology, hydrodynamics and nutrient behavior in the Yellow River estuary. Journal of Hydrology, 539: 102–112. Doi: 10.1016/j.jhydrol.2016.05.024 |
| Yin K D, Harrison P J, Broom M, Chung C H, 2011. Ratio of nitrogen to phosphorus in the Pearl River and effects on the estuarine coastal waters:nutrient management strategy in Hong Kong. Physics and Chemistry of the Earth, Parts A/B/C, 36(9-11): 411–419. Doi: 10.1016/j.pce.2010.04.014 |
| Yin K D, Harrison P J, 2008. Nitrogen over enrichment in subtropical Pearl River estuarine coastal waters:possible causes and consequences. Continental Shelf Research, 28(12): 1435–1442. Doi: 10.1016/j.csr.2007.07.010 |
| Yin K D, Lin Z F, Ke Z Y, 2004. Temporal and spatial distribution of dissolved oxygen in the Pearl River Estuary and adjacent coastal waters. Continental Shelf Research, 24(16): 1935–1948. Doi: 10.1016/j.csr.2004.06.017 |
| Yin K D, 2002. Monsoonal influence on seasonal variations in nutrients and phytoplankton biomass in coastal waters of Hong Kong in the vicinity of the Pearl River estuary. Marine Ecology Progress Series, 245: 111–122. Doi: 10.3354/meps245111 |
| Yuan X J, Guo Z R, Liu J, Ma Z Y, Wang B, 2014. Characteristics of radium desorption from sediments in the salt water environment. Acta Geoscientica Sinica, 35(5): 582–588. |
| Zhao H T. 1990. Evolution of the Pearl River Estuary. Ocean Press, Beijing. 358p. (in Chinese) |