 2017, Vol. 35
Institute of Oceanology, Chinese Academy of Sciences
Article Information
- NIU Mingxiang(牛明香), WANG Jun(王俊)
- Variation in the distribution of wintering anchovy Engraulis japonicus and its relationship with water temperature in the central and southern Yellow Sea
- Chinese Journal of Oceanology and Limnology, 35(5): 1134-1143
- http://dx.doi.org/10.1007/s00343-017-6134-1
Article History
- Received May. 9, 2016
- accepted in principle Jun. 23, 2016
- accepted for publication Jul. 11, 2016


2 Laboratory for Marine Ecology and Environmental Science, Qingdao National Laboratory for Marine Science and Technology, Qingdao 266200, China;
3 Key Laboratory of Sustainable Development of Marine Fisheries, Ministry of Agriculture, Qingdao 266071, China;
4 Shandong Provincial Key Laboratory of Fishery Resources and Ecological Environment(SFREE), Qingdao 266071, China
Numerous authors have reported on the effects of climate change on marine ecosystems and fisheries (Brander, 2010; Pörtner and Peck, 2010; Jones et al., 2015). An increasing number of studies have focused on climate-driven changes in the abundance and geographical distribution of marine fishes (Rose, 2005; Overholtz et al., 2011; Tu et al., 2015). In the northern hemisphere, some studies indicate that shifts in the spatial distribution of many species are generally towards the north or offshore to deeper water (Perry et al., 2005; Dulvy et al., 2008; Nye et al., 2009). Climate has been confirmed as a vital factor influencing changes in abundance (Hare et al., 2010; Simpson et al., 2011). These studies are very important because climate-induced variation in species distribution may lead to consequences for the whole ecosystem (MacNeil et al., 2010).
The Yellow Sea is an important fisheries area in China, and is one of the most exploited water bodies in the world. Clear signs of warming have been recorded in the Yellow Sea over the past several decadal years (Lin et al., 2005; Niu, 2012; Park et al., 2015). Sea surface temperature (SST) in the central Yellow Sea increased 2℃ from 1977 to 2010, with a much larger increase in SST during winter compared with other seasons (Huang et al., 2012). Consequently, the management of fisheries in the Yellow Sea is facing new challenges. Understanding the relationship between species distribution and water temperature will assist with the management and utilization of fish resources as the climate changes.
Japanese anchovy (Engraulis japonicus) are a small pelagic and highly migratory marine species. This species overwinters during December and February in the Yellow Sea, and the stock is most concentrated and stable from the end of December to January. From March, Japanese anchovy begin to migrate north-west for spawning, and the population becomes scattered. The spawning season is spread out, but frequently occurs from mid-May to late June, and ends largely in August. After spawning, schools of anchovy migrate for feeding in deeper water areas. From November the stock begins to migrate southwards to the wintering grounds (Zhao, 2006).
Engraulis japonicus feeds mainly on zooplankton and is prey for 30–40 higher trophic level species (Wei and Jiang, 1992). It is a key species in the Yellow Sea ecosystem (Tang, 2000; Zhao et al., 2003). The stock has fluctuated greatly since the 1980s (Zhao et al., 2003; Jin et al., 2005) and its growth shows obvious inter-annual variation (Zhu et al., 2007). Many studies have documented that wintering anchovy are susceptible to changes in water temperature and prefer to be located in a specific temperature range (Ma, 1987, 1989; Li et al., 2007; Niu et al., 2014).
The relationship between spatio-temporal environmental factors and the distribution and abundance of wintering anchovy was discussed by Niu et al. (2014). This paper demonstrated the important role of water temperature on influencing the distribution and abundance of anchovy stocks. In the current study, shifts in the spatial distribution of wintering anchovy between years in the central and southern Yellow Sea are investigated. The specific effects of water temperature on the distribution of wintering anchovy were examined using qualitative and quantitative techniques. Our purpose is to investigate the association between changes in water temperature and the distribution of wintering anchovy, and to provide useful information for the continued management of the anchovy resource in the Yellow Sea, as the climate changes.
2 MATERIAL AND METHOD 2.1 Study areaThe Yellow Sea, a semi-enclosed sea, is connected with the North Pacific Ocean. The Yellow Sea cold water mass (YSCWM) and the Yellow Sea warm current (YSWC) are the mainly hydrography (Su et al., 1994). The Yellow Sea coastal current (YSCC) also has a significant effect on regional hydrological characteristics (Wei et al., 2011). These currents play important roles in exchanging water and nutrients throughout the area, and in forming favorable habitats for living species. The area is a spawning, feeding and wintering ground for many marine fishery species. The study area includes the central and southern Yellow Sea (32.0°–37.0°N, 121.0°–125.5°E), where wintering grounds for Japanese anchovy are concentrated (Fig. 1).

|
| Figure 1 Sampling area in the central and southern Yellow Sea |
Anchovy are a migratory species, and exhibit the most concentrated and stable distribution pattern during the wintering period (Jin et al., 2005). Survey catch data for January were extracted from 2000 to 2015 (for years 2000, 2002–2007, 2010–2011 and 2015), using annual bottom trawl survey data carried out to assess the fishery stock status in the Yellow Sea. The surveys were carried out by the research vessel, RV Beidou, using a fixed station survey design. Every sampling station was predetermined and covered an area of 0.5°N×0.5°E. The net specifications of all surveys were the same. The codend mesh size of the bottom trawl was 24 mm, the headline was estimated by a net-sounder to be 5–7 m, and the distance between the wings was 18–20 m. Each trawl lasted between 0.5 h and 1 h at each sampling station, and the net was towed at a speed of 3 knots. Catches were separated into species and weighed on board. The data recorded included time, location (longitude, latitude), depth, species composition, and the catch weight and number for each species. All catches were standardized to 1h. Catch per unit effort (CPUE), was used to represent the relative stock density, and was calculated as the catch per hour per haul (g/(h·net) or ind/(h·net)).
2.2.2 Environmental dataSea surface temperature (SST) and chlorophyll-a (Chl-a) concentrations were obtained from NASA (http://oceancolor.gsfc.nasa.gov) from January 2000 to January 2015. The temporal resolution was one month and the spatial resolution was 9 km×9 km. All data were offered in hierarchical data format (HDF). We obtained the values using interactive data language (IDL) and averaged the data to a spatial grid of 0.5°×0.5° to match the fishery data.
Thermal gradient (TGR), the SST-related variable, an expression of thermal gradient and frontal intensity, was also used in the present study, and was calculated as follows:
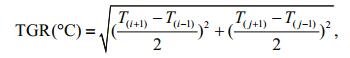
where Ti, j is the SST(℃) at co-ordinates i, j of the fishing area.
2.3 Data analysis 2.3.1 Spatial distributionTo obtain an objective measure of the distribution of wintering anchovy each year, following Óskarsson et al. (2009), we calculated the distribution center for wintering anchovy as the CPUE-weighted mean longitude and latitude. The distribution center was calculated as follows:
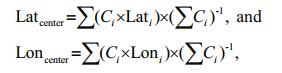
C is CPUE, for both biomass and abundance, and i is each fishing location.
Two methods were used to assess changes in the distribution of wintering anchovy. First, the latitude of the two locations with the greatest difference between distributional centers were compared. Second, a mid-latitude value was set as a boundary between the northern and southern parts of the distributional range. The mean values of latitudes that were higher than the boundary and lower than the boundary were compared. Geographic information system (GIS) was used to examine changes in the distribution of wintering anchovy.
2.3.2 Preferred temperature isothermThe preferred temperature isotherm expresses the suitable temperature where most wintering anchovy were located, which was used to represent the preferred spatial habitat of wintering anchovy in this study. The preferred temperature for wintering anchovy was selected based on information on fishery resource density, the frequency of fishing area of wintering anchovy and SST during 2000–2015, as well as published reports on temperature preference (Ma, 1989; Chen et al., 1997; Niu et al., 2014). The mean latitude of the preferred temperature isotherm was calculated using the Raster Calculator function in ArcGIS (a geographic information system by ESRI) software.
2.3.3 Relationship between wintering anchovy distribution and water temperatureWater temperature influences the latitudinal distribution of fishes (Perry et al., 2005; Chen et al., 2013). The latitude of the distribution center of wintering anchovy was compared with the latitude of the preferred temperature isotherm. In winter, the seawater temperature isotherm moves north in the Yellow Sea, in response to climate warming. A uniform change in latitude for both the spatial distribution of anchovy and water temperature may indicate a distributional response of the fish. Associations between the distribution centers of wintering anchovy and preferred water temperature isotherms were tested using Pearson's correlations (P < 0.1).
2.3.4 Modelling wintering anchovy distribution to water temperatureGeneralized additive models (GAMs) can illustrate non-linear relationships between fisheries and environmental predictors (Sacau et al., 2005; França et al., 2012). Generalized additive models have been used to demonstrate the impacts of environmental factors on fishery distribution and density in recent years (Van Der Kooij et al., 2008; Tian et al., 2009; Wang et al., 2012; Furey and Rooker, 2013). As catches can be zero, even with some fishing effort, two approaches were used to build the GAMs used in this study, a one-step model (Damalas et al., 2007) and a two-step model (Su et al., 2008; Van Der Kooij et al., 2008). Both approaches were used to understand the relationship between anchovy distribution and water temperature.
(1) For one-step model, the logarithm of the anchovy biomass +1 was treated as the response, the model was:
log(CPUE+1)~s(year)+s(hour)+s(longitude)+ s(latitude)+s(SST)+s(TGR)+s(chl-a)+s(depth) family=Gaussian
(2) For the two-step model, first, the presence/absence (P/A) model was built, relating anchovy presence/absence to each of the covariates using logistic regression. Second, anchovy biomass (CPUE model), given presence, was related to spatiotemporal and environmental factors assuming a lognormal distribution for the response variable. The P/A and CPUE models were:
PA~s(year)+s(hour)+s(longitude)+s(latitude)+ s(SST)+s(TGR)+s(chl-a)+s(depth) family=binomial log(CPUE)~s(year)+s(hour)+s(longitude)+ s(latitude)+s(SST)+s(TGR)+s(chl-a)+s(depth)
family=Gaussian
The Chi-test (P < 0.1) was used to assess the significance of the variables influencing anchovy presence and biomass in all analyses.
All GAM analyses were conducted using the software S-plus (Version 8.0).
3 RESULT 3.1 Spatial distributionWintering anchovy were most abundant in a band between about 34°N and 36°N during 2000–2015, with obvious variations among years (Fig. 2). The biomass center of wintering anchovy was located at 35.90°N, the northern-most point in the study, in 2005. The most southern biomass center in the study was found in 2011, at 34.30°N. No general directional trend in the latitudinal distribution of wintering anchovy was identified.

|
| Figure 2 Distribution of biomass center of wintering anchovy for the years 2000–2015 |
A latitudinal shift in the biomass center of wintering anchovy was shown in Fig. 3. Although the distributional range of anchovy expanded further south in 2005 than in 2011 (Fig. 4), the biomass center for wintering anchovy was about 1.5 degrees of latitude further north in 2005 compared with 2011 (Fig. 3a). Based on the biomass center of distribution of wintering anchovy (Fig. 2), 35°N was regarded as a boundary value. Years with a biomass center of less than 35°N were considered low latitude years, while the years with a biomass center greater than 35°N were considered high latitude years. The range in the average distribution of anchovy between low latitude years and high latitude years was about 0.9 degrees of latitude (Fig. 3b). Therefore, wintering anchovy distribution changes in latitude among years.

|
| Figure 3 Latitudinal shift of wintering anchovy a. range in the center of biomass for the two years with the largest difference in latitude (2005 and 2011); b. range in average latitude between low latitude years and high latitude years. Low latitude years occur when the biomass center is less than 35°N. High latitude years occur when the biomass center is greater than 35°N. |

|
| Figure 4 Sampling locations where wintering anchovy were found in 2005 and 2011 |
January sea surface temperature varied among years (2000–2015) in the central and southern Yellow Sea, but in general showed a slight ascending trend (Fig. 5). However, wintering anchovy did not move north following a rise in water temperature. Water temperature was the highest in 2015 (Fig. 5), but the biomass center of anchovy distribution was located in the south of the range (Fig. 2).

|
| Figure 5 SST in the central and southern Yellow Sea in January for the years 2000–2015 |
Both the frequency of fishing area and CPUE percentage data for wintering anchovy were related to SST (Fig. 6). Most wintering anchovy were found where SST was between 6℃ and 13℃, and were most concentrated where sea surface temperature was between 8℃ and 10℃. Isotherms of 10℃ and 11℃ were selected to represent the preferred spatial habitat of wintering anchovy.

|
| Figure 6 Relationships between the frequency of fishing area (where anchovy was caught), CPUE percentage for Japanese anchovy and sea surface temperature |
There were positive, significant correlations between the latitude of the center of biomass for wintering anchovy and the 10℃ isotherm and the 11℃ isotherm (Table 1). No significant correlations were observed between the latitude of the center of abundance for wintering anchovy and the 10℃ or 11℃ isotherms (Table 1). The center of biomass and of abundance, of wintering anchovy, generally followed the same trends as the 10℃ and 11℃ isotherms with respect to changes in latitude for each year of sampling (Fig. 7). However the correspondence between fish distribution and water temperature was weaker in 2002 and 2004 (Fig. 7).

|

|
| Figure 7 The center of distribution of wintering anchovy, for biomass and abundance measures, represented by latitude (solid line), and the latitude of the 10℃ and 11℃ isotherms (dashed line) |
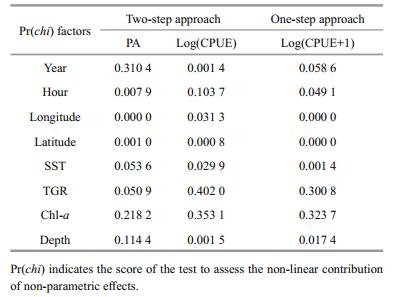
Associations between the distribution of wintering anchovy and possible influencing factors were investigated using generalized additive models (GAMs) (Table 2). The influence of the factors Year, Hour, TGR and Depth, differed between the two models. For example, Year was not significant in the presence/ absence (P/A) model, but was significant in the Log(CPUE) and Log(CPUE+1) models. Longitude, Latitude and Sea surface temperature (SST) all had a significant association with anchovy distribution in both the two-step and the one-step approach.
|
The relationship between SST and wintering anchovy distribution (presence and biomass) are shown in Fig. 8. Sea surface temperature (SST) had a strong influence on the presence and biomass of wintering anchovy. Wintering anchovy were more likely to be present where the SST was between about 7℃ and 12℃, and presence increased slightly with increasing SST (Fig. 8a). In the Log(CPUE) model, anchovy biomass, was highest between 7.5℃ and 11℃, with a peak at 9.5℃. At temperatures less than 9.5℃ there was an increase in biomass, and there was a decrease in biomass when temperatures were higher than 9.5℃ (Fig. 8b). In the one-step model, the highest biomass was also found when SST was between 7℃ and 11℃, with a peak at 9.5℃. However the rate of change in biomass was more rapid at temperatures that were less than or greater than 9.5℃ (Fig. 8c).

|
| Figure 8 The impacts of SST on wintering anchovy distribution (presence and biomass) inferred from the GAM a. PA model; b. Log(CPUE) model; c. Log(CPUE+1) model. |
Annual changes in the distribution of anchovy (Engraulis japonicus), wintering in the central and southern Yellow Sea were examined from the year 2000 to 2015. The position of the center of biomass for wintering anchovy changed between years, with the largest difference being about 1.5 degrees of latitude, but no consistent trend in the direction of change was detected during 2000–2015. This result does not match the universal pattern of a shift in fish distribution towards the north as the climate changes (Perry et al., 2005). Tu et al. (2015) also found that some species did not trend towards the north in the Tsushima Warm Current region of the Japan Sea. It is possible that the distribution range of wintering anchovy shifted poleward in response to water warming, beyond the fixed survey area sampled in this study.
In addition to the environmental factors examined in this study, processes such as population size, age structure and fish condition could also influence the distribution of wintering anchovy (Loots, 2010; Planque et al., 2011). Individual fish with different body sizes responded differently to changes in water temperature (Planque et al., 2010). Previous studies have reported that the wintering stock of Engraulis japonicus was mainly made up of 1-year-olds in 2004 (Zhao, 2006), however the proportion of 1-year-olds had decreased by 24% in 2010 and the stock of 2-yearold individuals increased by 33.3% (Zhang, 2011). There were large changes in the anchovy resource between years. Zhao (2006) concluded that anchovy stock in the Yellow Sea almost collapsed in 2003 after overfishing in consecutive years. Niu et al. (2014) considered that anchovy abundance declined drastically during 2000–2004, was relatively stable from 2004 to 2008, and increased after 2010. Changes in age-structure and abundance of wintering anchovy may have an important influence on changes in the distribution of this species between years (Zheng et al., 2001). Species interactions such as competition and predation may also play a role in mediating responses to climate change (Tu et al., 2015).
Although many factors affect fish distribution, water temperature is well-known to influence the suitability of fish habitats. Engraulis japonicus are very sensitive to changes in temperature (Ma, 1987, 1989; Li et al., 2007; Niu et al., 2014), and are therefore likely to be affected by a long-term warming trend. Therefore the relationship between the distribution of wintering anchovy and water temperature was the focus of our investigation.
Anchovy biomass, abundance, and the area where most fishing occurred in the central and southern Yellow Sea, were all concentrated where the winter water temperature was between 8℃ and 10℃ (Fig. 6). A previous study demonstrated a good correlation between water temperature and the location of anchovy wintering grounds (Huang et al., 2010). Ma (1989) and Li et al. (2007) found that water temperature between 8℃ and 15℃, was suitable for wintering anchovy although most anchovy were found where SST was between 11℃ and 13℃. Niu et al.(2010, 2014) noted that wintering stock were mainly located in waters of 7–11℃. These findings are consistent with the results of the current study. Based on this information, we selected both the 10℃ and 11℃ isotherms to represent the preferred spatial habitat of wintering anchovy.
Water temperature affected the latitudinal distribution of wintering anchovy in the central and southern Yellow Sea. There was a good correspondence between the center of distribution of wintering anchovy (biomass and abundance) and water temperature, especially with the 10℃ isotherm (Fig. 7; Table 1). When the preferred isotherm shifted northward, the center of anchovy distribution moved northward too (Fig. 7). In winter, the Yellow Sea warm current (YSWC) and the Yellow Sea coastal current (YSCC) play a major role in anchovy distribution (Chen et al, 1997). Anchovy gather at the edges of the warm water tongue formed by the intrusion of the YSWC (Li et al., 2007). Therefore, when the preferred isotherm moves north, and the YSWC becomes stronger, its warm water tongue will shift northward. The region where anchovy are concentrated will move in the same direction. Notably, the shifting trend in latitude of distribution center and the preferred isotherm for wintering anchovy is identical only during the adjoining years, and they are not absolutely compared at each year. It is possible that other factors also influenced the distributional response of this species to water temperature.
Generalized additive models (GAM) provide a quantitative assessment of the relationship between fishery and environmental factors. A GAM model was used to examine the effects of water temperature on anchovy distribution. The results revealed significant correlations between water temperature and anchovy presence and biomass (Table 2; Fig. 8). Sea surface temperature (SST) was significantly correlated with the response factor in both the one-step model and two-step model, indicating that water temperature had an influence on the distribution of wintering anchovy. However, the pattern of effect of SST on anchovy presence and biomass differed between the two models (Fig. 8).
In summary, our findings indicate that the center of distribution of wintering anchovy changed in latitude among years and that water temperature played an important role in this shift. Climate-induced marine environment changes are unavoidable (Friedland and Hare, 2007; Overholtz et al., 2011), so understanding the relationship between fish location and water temperature is important. Since Japanese anchovy (Engraulis japonicus) are sensitive to water temperature, the latitudinal distribution is likely to be affected by a long-term warming trend. Changes in water temperature must be taken into account in the management of the anchovy fishery. Stock characteristics such as population size and age structure are also likely to influence the distribution of anchovy and should also be considered. Anchovy are a key species in the Yellow Sea ecosystem, and a shift in distribution would also affect other marine species, therefore the results of this study are important in a wider context.
5 CONCLUSION(1) The latitudinal distribution of wintering anchovy (Engraulis japonicus) varied among years (2000–2015) in the central and southern Yellow Sea. The largest difference in the distribution center (biomass) of anchovy was about 1.5 degrees of latitude, for the years 2005 and 2011. However, no consistent pattern in the direction of change (north or south) in the spatial distribution of anchovy was found during the study period; (2) although wintering anchovy did not shift northwards with rising water temperature in the central and southern Yellow Sea, shifts in distribution were consistent with the location of 10℃ and 11℃ isotherms. The relationship between water temperature and wintering anchovy distribution was examined using one-step and two-step GAMs. The results indicated that SST was significantly correlated with both presence and biomass of anchovy; (3) although water temperature plays an important role in determining the distribution of fish, stock characteristics such as population size, age structure and condition also influence distribution. These additional factors should be taken into account in future research.
6 ACKNOWLEDGEMENTWe are grateful to the two anonymous reviewers whose insightful comments improved the manuscript greatly. We also thank the crew of the RV Beidou and our colleagues for their kind assistance with the collection of survey data. We would like to acknowledge NASA for offering the sea surface temperature and Chl-a concentration data used in the study.
| Brander K, 2010. Impacts of climate change on fisheries. Journal of Marine Systems, 79(3-4): 389–402. Doi: 10.1016/j.jmarsys.2008.12.015 |
| Chen J F, Ma S S, Wang W L, 1997. Variation characteristics of three large water systems influencing the behavior and distribution of anchovy Engraulis japonicus in the Yellow Sea and East China Sea in autumn and winter. Marine Fisheries Research, 18(1): 54–59. |
| Chen Y J, Lin L S, Liao Y C, Zhang J, Song P Q, Yu X G, Wu R S, Shao K T, 2013. Composition of fish species in Bering Sea and Chukchi Sea and its responses to changes of ecological environment. Acta Oceanologica Sinica, 35(2): 113–125. |
| Damalas D, Megalofonou P, Apostolopoulou M, 2007. Environmental, spatial, temporal and operational effects on swordfish (Xiphias gladius) catch rates of eastern Mediterranean Sea longline fisheries. Fisheries Research, 84(2): 233–246. Doi: 10.1016/j.fishres.2006.11.001 |
| Dulvy N K, Rogers S L, Jennings S, Stelzenmüller V, Dye S R, Skjoldal H R, 2008. Climate change and deepening of the North Sea fish assemblage:a biotic indicator of warming seas. Journal of Applied Ecology, 45(4): 1029–1039. Doi: 10.1111/jpe.2008.45.issue-4 |
| França S, Vasconcelos R P, Fonseca V F, Tanner S E, Santos P R, Costa M J, Cabral H N, 2012. Predicting fish community properties within estuaries:influence of habitat type and other environmental features. Estuarine, Coastal and Shelf Science, 107: 22–31. Doi: 10.1016/j.ecss.2012.04.013 |
| Friedland K D, Hare J A, 2007. Long-term trends and regime shifts in sea surface temperature on the continental shelf of the northeast United States. Continental Shelf Research, 27(18): 2313–2328. Doi: 10.1016/j.csr.2007.06.001 |
| Furey N B, Rooker J R, 2013. Spatial and temporal shifts in suitable habitat of juvenile southern flounder (Paralichthys lethostigma). Journal of Sea Research, 76: 161–169. Doi: 10.1016/j.seares.2012.08.007 |
| Hare J A, Alexander M A, Fogarty M J, Williams E H, Scott J D, 2010. Forecasting the dynamics of a coastal fishery species using a coupled climate-population model. Ecological Applications, 20(2): 452–464. Doi: 10.1890/08-1863.1 |
| Huang D J, Ni X B, Tang Q S, Zhu X H, Xu D F. 2012. Spatial and temporal variability of sea surface temperature in the Yellow Sea and East China Sea over the past 141 years. In: Wang S Y, Gillies R R eds. Modern Climatology. InTech, Rijeka, Croatia, p. 213-234. |
| Huang D J, Zhang T, Zhou F, 2010. Sea-surface temperature fronts in the Yellow and East China Seas from TRMM microwave imager data. Deep Sea Research part Ⅱ:Topical Studies in Oceanography, 57(11-12): 1017–1024. Doi: 10.1016/j.dsr2.2010.02.003 |
| Jin X S, Zhao X Y, Meng T X, Cui Y, 2005. Biological resources and habitat in the Yellow Sea and Bohai Sea. Science Press, Beijing, Chinap.262-274. |
| Jones M C, Dye S R, Pinnegar J K, Warren R, Cheung W W L, 2015. Using scenarios to project the changing profitability of fisheries under climate change. Fish and Fisheries, 16(4): 603–622. Doi: 10.1111/faf.2015.16.issue-4 |
| Li Y, Zhao X Y, Zhang T, Li X S, Wei H, 2007. Wintering migration and distribution of anchovy in the Yellow Sea and its relation to physical environment. Marine Fisheries Research, 28(2): 104–112. |
| Lin C, Ning X, Su J, Lin Y, Xu B, 2005. Environmental changes and the responses of the ecosystems of the Yellow Sea during 1976-2000. Journal of Marine Systems, 55(3-4): 223–234. Doi: 10.1016/j.jmarsys.2004.08.001 |
| Loots C, Vaz S, Planque B, Koubbi P, 2010. What controls the spatial distribution of the North Sea plaice spawning population? Confronting ecological hypotheses through a model selection framework. ICES Journal of Marine Science, 67(2): 244–257. Doi: 10.1093/icesjms/fsp238 |
| Ma S S, 1987. The hydrologic characteristics of the southern Huanghai Sea and East Sea during winter and their relations to fishing grounds of anchovy. Marine Forecasts, 4(4): 37–44. |
| Ma S S, 1989. Relationship between distribution and hydrological conditions of the wintering anchovy in Yellow Sea and East China Sea. Journal of Fisheries of China, 13(3): 201–206. |
| MacNeil M A, Graham N A J, Cinner J E, Dulvy N K, Loring P A, Jennings S, Polunin N V C, Fisk A T, McClanahan T R, 2010. Transitional states in marine fisheries:adapting to predicted global change. Philosophical Transactions of the Royal Society B:Biological Sciences, 365(1558): 3753–3763. Doi: 10.1098/rstb.2010.0289 |
| Niu M X, Jin X S, Li X S, Wang J, 2014. Effects of spatiotemporal and environmental factors on distribution and abundance of wintering anchovy Engraulis japonicus in central and southern Yellow Sea. Chinese Journal of Oceanology and Limnology, 32(3): 565–575. Doi: 10.1007/s00343-014-3166-7 |
| Niu M X, Li X S, Zhao G X, 2010. Spatial distribution of wintering Engraulis japonicus and its relationship with the inter-annual variations of water temperature in central and southern Yellow Sea. Chinese Journal of Applied Ecology, 23(2): 552–558. |
| Niu M X. 2012. Spatiotemporal dynamics of anchovy population and its response to environmental factors in the Yellow Sea based on ocean RS and GIS. Shandong Agricultural University of China, Tai'an. (in Chinese with English abstract) |
| Nye J A, Link J S, Hare J A, Overholtz W J, 2009. Changing spatial distribution of fish stocks in relation to climate and population size on the Northeast United States continental shelf. Marine Ecology Progress Series, 393: 111–129. Doi: 10.3354/meps08220 |
| Óskarsson G J, Gudmundsdottir A, Sigurdsson T, 2009. Variation in spatial distribution and migration of Icelandic summer-spawning herring. ICES Journal of Marine Science, 66(8): 1762–1767. Doi: 10.1093/icesjms/fsp116 |
| Overholtz W J, Hare J A, Keith C M, 2011. Impacts of interannual environmental forcing and climate change on the distribution of Atlantic Mackerel on the U. S. Northeast continental shelf. Marine and Coastal Fisheries:Dynamic, Management, and Ecosystem Science, 3(1): 219–232. |
| Park K A, Lee E Y, Chang E, Hong S, 2015. Spatial and temporal variability of sea surface temperature and warming trends in the Yellow Sea. Journal of Marine Systems, 143: 24–38. Doi: 10.1016/j.jmarsys.2014.10.013 |
| Perry A L, Low P J, Ellis J R, Reynolds J D, 2005. Climate change and distribution shifts in marine fishes. Science, 308(5730): 1912–1915. Doi: 10.1126/science.1111322 |
| Planque B, Fromentin J M, Cury P, Drinkwater K F, Jennings S, Perry R I, Kifani S, 2010. How does fishing alter marine populations and ecosystems sensitivity to climate?. Journal of Marine Systems, 79(3-4): 403–417. Doi: 10.1016/j.jmarsys.2008.12.018 |
| Planque B, Loots C, Petitgas P, Lindstrøm U, Vaz S, 2011. Understanding what controls the spatial distribution of fish populations using a multi-model approach. Fisheries Oceanography, 20(1): 1–17. Doi: 10.1111/j.1365-2419.2010.00546.x |
| Pörtner H O, Peck M A, 2010. Climate change effects on fishes and fisheries:towards a cause-and-effect understanding. Journal of Fish Biology, 77(8): 1745–1779. Doi: 10.1111/jfb.2010.77.issue-8 |
| Rose G A, 2005. On distributional responses of North Atlantic fish to climate change. ICES Journal of Marine Science, 62(7): 1360–1374. Doi: 10.1016/j.icesjms.2005.05.007 |
| Sacau M, Pierce G J, Wang J J, Arkhipkin A I, Portela J, Brickle P, Santos M B, Zuur A F, Cardoso X, 2005. The spatiotemporal pattern of Argentine shortfin squid Illex argentinus abundance in the southwest Atlantic. Aquatic Living Resources, 18(4): 361–372. Doi: 10.1051/alr:2005039 |
| Simpson S D, Jennings S, Johnson M P, Blanchard J L, Schön P J, Sims D W, Genner M J, 2011. Continental shelf-wide response of a fish assemblage to rapid warming of the sea. Current Biology, 21(18): 1565–1570. Doi: 10.1016/j.cub.2011.08.016 |
| Su J L, Yuan Y C, Jiang J Z, 1994. Advances in physical oceanography in China since the establishment of the PRC. Acta Geophysica Sinica, 37(S1): 85–95. |
| Su N J, Yeh S Z, Sun C L, Punt A E, Chen Y, Wang S P, 2008. Standardizing catch and effort data of the Taiwanese distant-water longline fishery in the western and central Pacific Ocean for bigeye tuna, Thunnus obesus. Fisheries Research, 90(1-3): 235–246. Doi: 10.1016/j.fishres.2007.10.024 |
| Tang Q S, 2000. The new age of China-GLOBEC study. Newsletter of the North Pacific Marine Science Organization, 8(1): 28–29. |
| Tian S Q, Chen X J, Chen Y, Xu L X, Dai X J, 2009. Standardizing CPUE of Ommastrephes bartramii for Chinese squid-jigging fishery in Northwest Pacific Ocean. Chinese Journal of Oceanology and Limnology, 27(4): 729–739. Doi: 10.1007/s00343-009-9199-7 |
| Tu C Y, Tian Y J, Hsieh C H, 2015. Effects of climate on temporal variation in the abundance and distribution of the demersal fish assemblage in the Tsushima Warm Current region of the Japan Sea. Fisheries Oceanography, 24(2): 177–189. Doi: 10.1111/fog.2015.24.issue-2 |
| Van Der Kooij J, Scott B E, Mackinson S, 2008. The effects of environmental factors on daytime sandeel distribution and abundance on the Dogger Bank. Journal of Sea Research, 60(3): 201–209. Doi: 10.1016/j.seares.2008.07.003 |
| Wang Y B, Zheng J, Wang Y, Zheng X Z, 2012. Spatiotemporal factors affecting fish harvest and their use in estimating the monthly yield of single otter trawls in Putuo district of Zhoushan, China. Chinese Journal of Oceanology and Limnology, 30(4): 580–586. Doi: 10.1007/s00343-012-1215-7 |
| Wei Q S, Yu Z G, Ran X B, Zang J Y, 2011. Characteristics of the Western Coastal Current of the Yellow Sea and its impacts on material transportation. Advances in Earth Science, 26(2): 145–156. |
| Wei S, Jiang W M, 1992. Study on food web of fishes in the Yellow Sea. Oceanologia et Limnologia Sinica, 23(2): 182–192. |
| Zhang J. 2011. Estimation of the anchovy resources in the Yellow Sea Based on acoustic data post-processing system. Shanghai Ocean University, Shanghai. (in Chinese with English abstract) |
| Zhao X Y, Hamre J, Li F G, Tang Q S, 2003. Recruitment, sustainable yield and possible ecological consequences of the sharp decline of the anchovy (Engraulis japonicus) stock in the Yellow Sea in the 1990s. Fisheries Oceanography, 12(4-5): 495–501. Doi: 10.1046/j.1365-2419.2003.00262.x |
| Zhao X Y. 2006. Population dynamic characteristics and sustainable utilization of the anchovy stock in the yellow sea. Ocean University of China, Qingdao. (in Chinese with English abstract) |
| Zheng X, Pierce G J, Reid D G, 2001. Spatial patterns of whiting abundance in Scottish waters and relationships with environmental variables. Fisheries Research, 50(3): 259–270. Doi: 10.1016/S0165-7836(00)00219-8 |
| Zhu J C, Zhao X Y, Li F G, 2007. Growth characters of the anchovy stock in the Yellow Sea with its annual and seasonal variations. Marine Fisheries Research, 28(3): 64–72. |