Institute of Oceanology, Chinese Academy of Sciences
Article Information
- SONG Lina(宋丽娜), LI Yuanlong(李元龙), LIU Chuanyu(刘传玉), WANG Fan(王凡)
- Subthermocline anticyclonic gyre east of Mindanao and its relationship with the Mindanao Undercurrent
- Chinese Journal of Oceanology and Limnology, 35(6): 1303-1318
- http://dx.doi.org/10.1007/s00343-017-6111-8
Article History
- Received Apr. 16, 2016
- accepted in principle Jun. 8, 2016
- accepted for publication Sep. 3, 2016
2 University of Chinese Academy of Sciences, Beijing 100049, China;
3 Department of Atmospheric and Oceanic Sciences, University of Colorado, Boulder, Colorado 80309, USA;
4 Function Laboratory for Ocean Dynamics and Climate, Qingdao National Laboratory for Marine Science and Technology, Qingdao 266000, China
The climatological structure of the upper-ocean circulation in the northwestern tropical Pacific Ocean is considered well established following the efforts of many oceanographers over the past several decades (e.g., Nitani, 1972; Toole et al., 1990; Lukas et al., 1996; Kashino et al., 1999; Qu et al., 1999; Qu and Lukas, 2003). Its primary features can be captured by the surface geostrophic current based on satellitederived sea surface height (SSH) data (Fig. 1). The westward-flowing North Equatorial Current (NEC) bifurcates off the Philippine coast into the northwardflowing Kuroshio Current and the southward-flowing Mindanao Current (MC) (Fig. 1; Toole et al., 1990; Lukas et al., 1996; Qu and Lukas, 2003). At the southern tip of Mindanao, the MC converges with the New Guinea Coastal Current (NGCC) and it turns eastward to form the North Equatorial Countercurrent (NECC). The retroflection of the MC and the NGCC gives rise to two quasi-permanent eddy structures: the Mindanao Eddy (ME) and the Halmahera Eddy (HE) (e.g., Lukas et al., 1991; Qu et al., 1999; Kashino et al., 2013; Zhao et al., 2013), which balance the nonlinear momentum fluxes of the MC and NGCC transported into this region (Arruda and Nof, 2003). The cyclonic ME, which has a diameter of 250 km, is centered at 7°N. Based on observations from various sources, the center of the anticyclonic HE is observed to be east of 130°E. The HE has a horizontal scale of 500 km, and it tilts northward/northwestward with increasing depth (Kashino et al., 1999, 2011, 2013; Qu et al., 1999). The variabilities of the ME and HE are closely linked with those of the surrounding important currents, i.e., the NEC, MC, NGCC, and NECC (e.g., Kashino et al., 1999, 2013; Zhao et al., 2013).

|
| Figure 1 Annual mean climatological sea surface height (SSH; color shading; cm) and surface geostrophic current (vectors; cm/s) based on AVISO sea level product from January 1993 to December 2012 |
While its upper-ocean currents and recirculation structures have been investigated extensively, knowledge of the deep-layer circulation of the Philippine Sea remains fragmented because of the lack of observational data (Qu et al., 1998; Hu et al., 2015a; Qiu et al., 2015; Wang et al., 2015). The subthermocline circulation in this region is rather complex and highly variable. Beneath the southwardflowing MC is a continuous northward flow along the Mindanao coast, which was named the Mindanao Undercurrent (MUC) by Hu et al. (1991). The MUC plays an important role in the water mass transport and heat budget of the Philippine Sea (Fine et al., 1994; Wang et al., 1998, 2015; Qu and Lindstrom, 2004). Geostrophic estimations based on historical hydrographic observations have shown that the MUC comprises a steady northward flow from 6°N to 10°N but with multiple velocity cores of 10 cm/s (Hu et al., 1991; Qu et al., 1998; Wang and Hu, 1998; Qiu et al., 2015; Wang et al., 2015). However, recent moored acoustic Doppler current profiler measurements east of Mindanao have revealed that the MUC exists as highly variable alternating jets with its maximum northward velocity as high as 52 cm/s (Kashino et al., 2005, 2015; Zhang et al., 2014; Hu et al., 2015a; Schönau et al., 2015; Wang et al., 2016).
Many researchers have reported a close relationship between the MUC and subthermocline recirculation gyres at intermediate depths (e.g., 400–1 000 m; Qu et al., 1999, 2012; Firing et al., 2005; Qiu et al., 2015; Wang et al., 2015, 2016). Firing et al. (2005) was the first to report the existence of a subthermocline recirculation east of Mindanao based on direct acoustic Doppler current profiler records. Both observational data and numerical model outputs have shown that a large-scale anticyclonic gyre (ACG) exists beneath the ME and HE, and is closely associated with the northward flow of the MUC (e.g., Qu et al., 1999, 2012; Kashino et al., 2015; Qiu et al., 2015; Schönau et al., 2015; Wang et al., 2015). Other research has suggested that this subthermocline ACG is related to the surface HE (Qu et al., 1999; Kashino et al., 2013; Wang et al., 2015), and that its formation is due to the northward shift of the HE with depth. Furthermore, Qu et al. (1999) proposed the idea that the so-called MUC is merely the northward/inshore component of this ACG.
The MUC and its relationship with the ACG are subjects that remain under debate (e.g., Zhang et al., 2014; Kashino et al., 2015; Wang et al., 2015). Nevertheless, as an important feature of the subthermocline circulation in the southern Philippine Sea, the ACG east of Mindanao is of great interest for oceanographers. Investigating the ACG's structure and variability is helpful both for understanding the ocean dynamics of this region and for extending our insight into the deep ocean. The objective of this study was to provide the first comprehensive descriptions of the spatial structure and temporal variability of the subthermocline ACG east of Mindanao, based on climatological observational data and the output of an eddy-resolving ocean model. Given that deep ocean observations with good spatial coverage remain unavailable, simulations based on a state-of-the-art ocean model are useful for complementing our knowledge of the deep-ocean circulation and its dynamics. Our results show that the subthermocline ACG should not be considered as simply the lower portion of the HE, and that its variability is closely associated with the northward transport of the MUC along the Mindanao coast.
The remainder of this paper is organized as follows. Section 2 outlines the data and model used in this study. Section 3 describes the structure of the ACG and its relation with the HE. Section 4 examines the seasonal and interannual variations of the ACG and its relationship with the MUC. Finally, Section 5 provides a summary of the findings of the research.
2 DATA AND METHODThe satellite-observed SSH and surface geostrophic current data used in this study were from the former version of the Ssalto/Duacs sea level product. This is based on multiple altimeter measurements by the TOPEX/POSEIDON, Jason-1, Envisat, and the ERS missions, and released via the Archiving, Validation, and Interpretation of Satellite Oceanographic data (AVISO) website (Ducet et al., 2000). It provides 1/3°×1/3° weekly satellite altimeter SSH data and surface geostrophic maps in delayed time from October 1992 through December 2012, with respect to a 7-year (1993-1999) reference period. In order to correct the aliasing of tides and barotropic variability, the altimeter data have been updated with the GOT2000 tidal model and MOG2D-G barotropic hydrodynamic model (Volkov et al., 2007). The SSH value of AVISO is the sum of the sea level anomaly (SLA) and mean dynamic topography, based on GRACE data, altimetry measurements, and in situ observations (Rio et al., 2011). The surface geostrophic velocities are estimated using the horizontal gradients of SSH. Both SSH and surface geostrophic current data are produced by Ssalto/Duacs and distributed by AVISO, with support from CNES. The data were downloaded from http://www.aviso.oceanobs.com/ (following the release of a new version of the AVISO product, this link no longer provides the formerversion data) with weekly resolution and averaged into monthly data for our analysis. This version of the AVISO product has been used widely within the oceanographic community and it has proven useful in understanding global and regional ocean dynamics (e.g., Qiu and Chen, 2010; Chelton et al., 2011; Hamlington et al., 2011; Zhao et al., 2013).
Subsurface dynamic height and geostrophic current were calculated using the annual mean temperature and salinity climatology of the World Ocean Atlas 2013 (WOA13) (Locarnini et al., 2013; Zweng et al., 2013) with 0.25°×0.25° resolution. Dynamic height D was computed by vertically integrating the specific volume anomaly from the 1 500 dbar reference level. Then, the geostrophic current was determined using the horizontal gradients of D:
 (1)
(1)where f is the Coriolis parameter. To examine the impact from the El Niño-Southern Oscillation (ENSO), the monthly Niño-3.4 index during 1950-2012 was taken from the Climate Prediction Center of NOAA (www.cpc.ncep.noaa.gov/data/indices/) as a proxy of ENSO variability.
The Oceanic General Circulation Model for the Earth Simulator (OFES) (Masumoto et al., 2004; Sasaki et al., 2004) is based on the third version of the Modular Ocean Model, developed by the Geophysical Fluid Dynamics Laboratory/National Oceanic and Atmospheric Administration. It covers a near-global region extending from 75°S to 75°N, excluding the Arctic Ocean, with horizontal resolution of 0.1°×0.1° and 54 levels. The layer thickness varies from 5 m near the surface to 330 m near the bottom. The model topography was constructed from a 1/30 degree bathymetry data set created by the Ocean Circulation and Climate Advanced Modeling Project. The OFES was first spun up from a state of rest for 50 years, adopting the annual mean climatology of the World Ocean Atlas 1998 as the initial conditions. Restarting from the already spun-up solution, the model was then integrated forward from 1950 using daily surface wind stress, heat flux, and salinity flux from the National Centers for Environmental Prediction/National Center for Atmospheric Research reanalysis product (Kalnay et al., 1996) as the surface forcing fields. For further details regarding the OFES configuration, readers are referred to Masumoto et al. (2004) and Sasaki et al. (2004). In this study, we analyzed the monthly outputs of temperature, salinity, and ocean currents for the period 1950–2012. The OFES product has been used widely to investigate ocean phenomena at various spatial and temporal scales (e.g., Kashino et al., 2011; Qu et al., 2012; Qiu et al., 2015). In particular, recent studies using OFES have investigated the subthermocline circulation of the northwest tropical Pacific Ocean and demonstrated its usefulness for understanding the ocean dynamics of this region (e.g., Qu et al., 2012; Chiang and Qu, 2013; Chiang et al., 2015; Qiu et al., 2015; Wang et al., 2016).
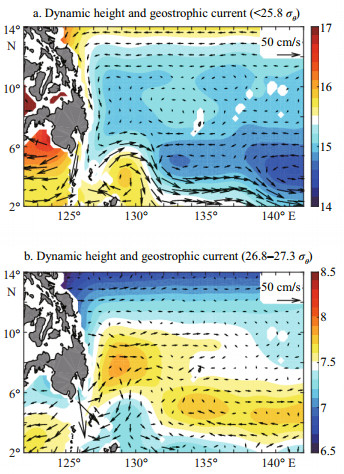
3 SUBTHERMOCLINE ANTICYCLONIC GYREHere, we examine the climatological structure of the intermediate circulation in the southern Philippine Sea using WOA13 data and OFES output. In this region, the water of 25.8 σθ corresponds roughly to the main thermocline, and the water above can be regarded as the upper ocean (Fig. 2a). The circulation pattern for water < 25.8 σθ roughly resembles the surface current structure based on satellite SSH data (Fig. 1). The westward NEC, southward MC, and eastward NECC are the major currents that dominate the circulation structure of the southern Philippine Sea. Further to the south, the HE manifests as the local maximum of dynamic height and the anticyclonic flow northeast of Halmahera Island. At the sea surface, the center of the HE, as indicated by the local SSH maximum, is located east of 130°E (Fig. 1). Its diameter is about 4°–5° (i.e., ~500 km) in the zonal direction. However, in the mean circulation of the upper ocean, the HE is greatly reduced in size and its center is shifted to around 4°N, 129°E. This northwestward shift of the HE has been reported in previous studies and it was believed linked to the ACG in the intermediate layer (e.g., Qu et al., 1999; Wang et al., 2015). The average geostrophic current for 26.8–27.3 σθ water represents the circulation pattern of the intermediate layer (Fig. 2b) because this layer includes the primary intermediate water masses in this region. The ACG is evident east of Mindanao, covering a large area from the Mindanao coast (~127°E) to 131°E and from 4°N to 10°N. It is accompanied by a northward flow along the Mindanao coast, characterizing the MUC. On the northern flank of the ACG, some of the MUC water turns eastward, giving rise to an eastward flow that extends into the basin interior. This eastward subthermocline flow beneath the westward-flowing NEC is the southern branch of the North Equatorial Undercurrent jet (Wang et al., 1998, 2015; Qiu et al., 2013, 2015). Both the location and the size of the ACG deviate greatly from the HE in the upper ocean.
|
| Figure 2 Dynamic height (color shading; m2/s2) and geostrophic current (vectors; cm/s) averaged over (a) the upperocean layer ( < 25.8 σθ) and (b) the intermediate layer (26.8–27.3 σθ) based on the WOA13 annual mean climatology Dynamic height and geostrophic current are relative to 1 500 dbar. |
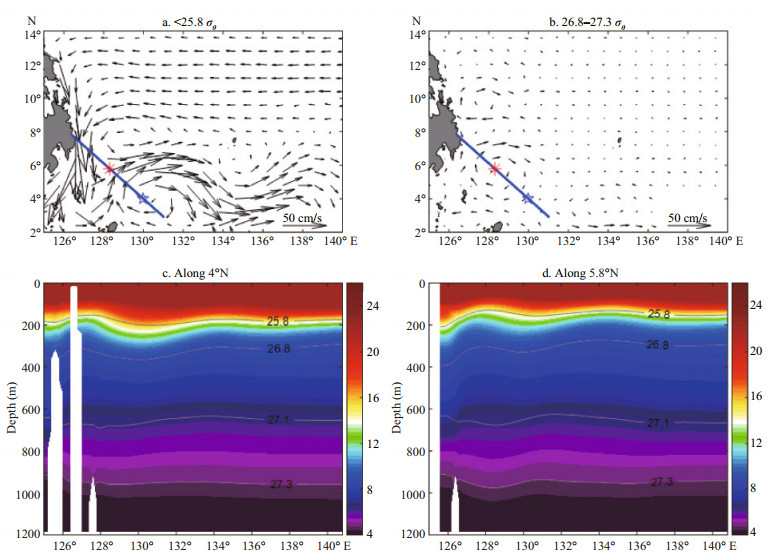
Revealing the detailed structures of the HE and ACG requires an analysis with a high-resolution dataset. The annual mean climatological circulation patterns in OFES (Fig. 3a, b) are roughly consistent with the WOA13 data in both the upper and intermediate layers. Importantly, the locations and structures of the surface HE and the subthermocline ACG are also in agreement with the observations. Figure 3c and d shows the temperature and potential density sections at 4°N and 5.8°N, approximately across the centers of the HE and the ACG, respectively. In this region, the density stratification is controlled primarily by temperature (Qu et al., 1999; Li and Wang, 2012). Consequently, the isotherms tend to coincide with the isopycnals in vertical displacement. At 4°N (Fig. 3c), the HE around 130°E (blue star in Fig. 3a) is characterized by a dramatic downwelling of surface warm water and a sinking of the 25.8 σθ isopycnal. Its impact on the temperature and density is primarily confined to within the upper 500 m of the ocean, and its influence in the intermediate layer (i.e., 26.8–27.3 σθ; 400–1 000 m) is much reduced. At 5.8°N (Fig. 3d), the ACG, centered at 128.5°N (red asterisk in Fig. 3b), is characterized by downwelling features of the isotherms and isopycnals in the intermediate layer. Overlying the ACG, there is strong upwelling associated with the ME in the upper 500 m. All these features are consistent with existing knowledge based on previous observational studies (e.g., Qu et al., 1999; Kashino et al., 2013; Wang et al., 2015). However, whether the subthermocline ACG is associated with the surface HE requires further examination.
|
| Figure 3 Ocean current (cm/s) averaged over (a) < 25.8 σθ and (b) 26.8–27.3 σθ based on OFES output of 1950–2012; the blue line denotes the HE–ACG section, passing through the center locations of the HE (blue star) and the ACG (red asterisk); (c) and (d) Vertical potential temperature sections (color shading; ℃) at (c) 4°N and (d) 5.8°N The contours denote the potential density (kg/m3). |
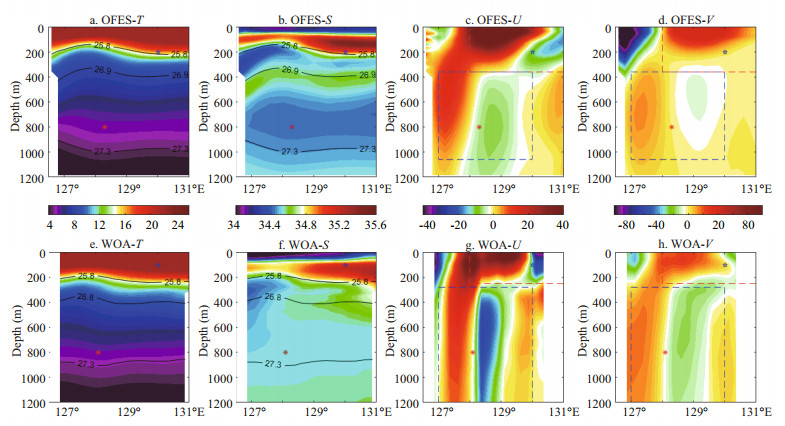
Figure 4 shows the temperature-salinity and current distributions along the HE-ACG section, which connects the centers of the HE (star) and the ACG (asterisk) in Fig. 3. The ME and HE are characterized by upwelling at 128°E and downwelling at 130°E in the potential temperature and salinity fields above 300 m (Fig. 4a, b, e, f). The intermediate ACG manifests as a sinking of the isotherms at 800 m, below the ME (Fig. 4a, e). The upwelling of the ME in the upper ocean and the ACG's downwelling together give rise to a thick layer of fresh water in the salinity field (Fig. 4b, f), which is occupied primarily by Antarctic Intermediate Water, as reported in previous studies (e.g., Qu et al., 1999; Qu and Lindstrom, 2004; Wang et al., 2015). All these thermohaline structures are realistically reproduced by the OFES. In the velocity fields, the upper-ocean circulation is featured by a southwest-northeast-southwest structure in the upper 300 m, reflecting the ME-HE eddy pair (Fig. 4c, d; the southwestward velocity is not drawn east of 131°E in the OFES, which is similar to the WOA east of 130°E in Fig. 4g, h). The signatures of the HE extend to ~380 m from the surface, becoming weaker in strength and smaller in scale with increasing depth. At 400 m, the HE signatures are no longer discernible. The velocity distribution is distinct from that in the upper ocean. The ACG (blue dashed box) involves northeastward flow and southwestward flow to the west and the east of 128°E, respectively. It is located beneath the cyclonic ME. The ACG exists at 400–1 100 m with a center at 5.8°N, 128.5°E. Its structure is rather stable over 500–1 100 m, showing little vertical change with depth. This is distinct from the surface HE, which is tilted and seen to weaken with depth. The anticyclonic flow of the ACG is much stronger than the lower portion of the HE at 200–300 m and it is disconnected from it. From this point of view, the ACG could not be descended from the surface HE and thus, it is reasonable to suggest that the subthermocline ACG is probably unrelated to the surface HE. Figure 4 also suggests that the OFES can realistically represent the thermohaline and current structures of the upper and intermediate ocean in this region.
|
| Figure 4 Vertical sections of (a) potential temperature T (℃), (b) salinity S, (c) zonal current U (cm/s), and (d) meridional current V (cm/s) along the HE-ACG section shown in Fig. 3 based on OFES output of 1950–2012 Black contours in (a) and (b) denote potential density (kg/m3); (e)–(h) are the same as (a)–(d) but based on WOA13 climatology. The blue star marks the location of the center of the HE, and the asterisk marks the center of the ACG. The dashed red frame denotes the approximate scope of the HE, while the blue frame outlines the ACG. The blank denotes areas where the geostrophic current could not be estimated. |
The eddy-resolving OFES product is able to represent the detailed features of the ACG. The anticyclonic flow of the ACG can be quantified by the relative vorticity ω of intermediate flow:
 (2)
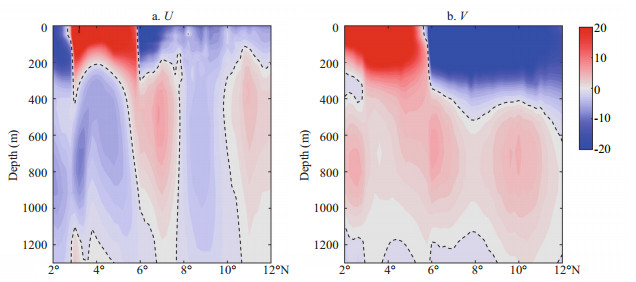
(2)The ACG is therefore represented by negative relative vorticity ("relative" omitted hereafter) values in the intermediate layer. Figure 5 shows the climatological vorticity averaged over 460–1 041 m. Negative vorticity values east of Mindanao are gathered in two patches. The southern patch is centered at 5.8°N, 128.5°E, extending over the area of 3°–8°N, 127°–131°E; hereafter, it is referred to as the southern ACG (SACG). The SACG incorporates the northward flow from the southern tip of Mindanao to ~7°N. Another patch of negative vorticity is centered at 10°N, 128.1°E, extending over the area of 8°–12°N, 126°–130°E, which is referred as the northern ACG (hereafter, NACG). The NACG incorporates the northward flow from 8°–12°N along the Mindanao coast. The latitude-depth distributions of U and V along the Philippine coast provide further insight (Fig. 6). Consistent with Fig. 5, the SACG is characterized by an onshore (westward) flow between 3°–6°N and an offshore (eastward) flow between 6°–8°N at 400–1 100 m, while the NACG is located between 8°–12°N and is smaller in size than the SACG (Fig. 6a). The SACG and NACG give rise to two maxima in the northward flow (~10 cm/s) along the Mindanao coast (Fig. 6b). The more southerly, at ~6°N, is related to the SACG, which can be regarded as the upstream part of the MUC, while the more northerly, located at 10°N, is related to the NACG, which can be regarded as the downstream part of the MUC. In Section 4, we show that the NACG and SACG exhibit distinctly different variations, leading to complex variability of MUC transport. The spatial distribution and typical magnitude of V in Fig. 6b are generally consistent with the observational data shown in Qiu et al. (2015).

|
| Figure 5 Annual mean climatology of relative vorticity (color shading; /s) and current (blue vectors; cm/s) averaged between 460–1 041 m in the southern Philippine Sea from the OFES output of 1950–2012 The solid rectangle denotes the SACG box (3°–8°N, 127°–131°E) and the dashed rectangle denotes the NACG box (8°–12°N, 126°–130°E). |
|
| Figure 6 Latitude-depth sections of the annual mean (a) zonal and (b) meridional current (cm/s) averaged within a 2° longitude band off the Philippine coast, based on OFES output of 1950–2012 The dashed curves denote the 0 contour. |
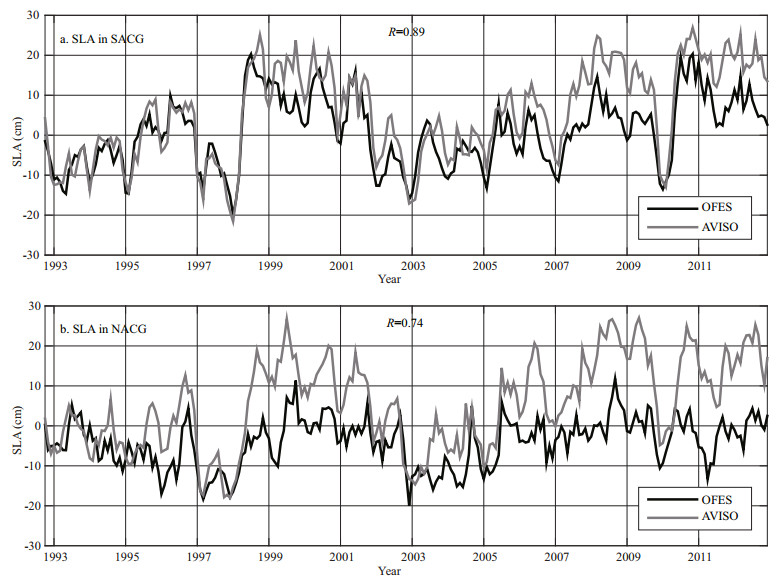
The above analysis describes the climatological characteristics of the subthermocline ACG. This section explores the seasonal and low-frequency variabilities of the ACG and their relationship with the MUC. As long-term subthermocline observations with good coverage are unavailable, we can only verify the OFES performance in simulating surface circulation variability. The monthly sea level anomaly (SLA) from the OFES is highly consistent with the AVISO SLA on seasonal and interannual timescales in the SACG and NACG, although the OFES-modeled SLA has smaller amplitude (Fig. 7). The correlation between the OFES and AVISO time series is 0.89 in the SACG and 0.74 in the NACG. The agreement of the OFES output with AVISO and WOA13 data indicates the fidelity of the OFES in representing the circulation structure and variability east of Mindanao. In addition, several recent studies have already provided some reasonable insights into the subthermocline circulation of this region based on OFES output (e.g., Qu et al., 2012; Chiang and Qu, 2013; Chiang et al., 2015; Qiu et al., 2015). This also gives us confidence to investigate the variability of the ACG and MUC with this state-of-the-art model.
|
| Figure 7 Monthly SLA (cm) time series during October 1992 to December 2012 from the OFES output (black line) and AVISO product (gray line) averaged over (a) the SACG and (b) the NACG |
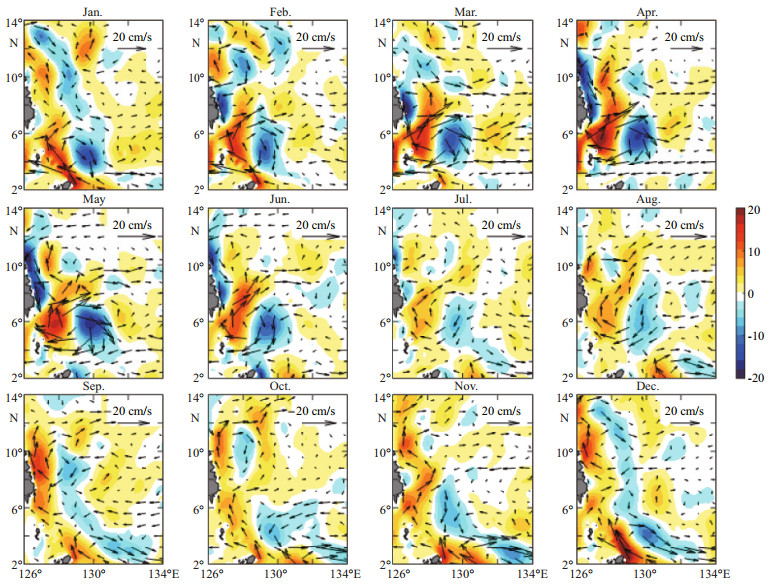
Figure 8 displays the monthly climatology of the intermediate circulation east of Mindanao from the OFES output of 1950–2012. An anticyclonic flow associated with the ACG, with northward flow along the Mindanao coast and southward flow east of 128°E, is discernible throughout a year. The strength of the ACG is evidently stronger during December–May than the rest of the year. During May–July, the ACG is greatly reduced in strength. Correspondingly, the MUC also exhibits a similar seasonality, with stronger northward flow near the Mindanao coast during December–May. Thus, a stronger (weaker) ACG leads to greater (smaller) MUC transport.
|
| Figure 8 Monthly climatological current (black arrows; cm/s) averaged between 460–1 041 m from the OFES The color shading denotes meridional velocity. |
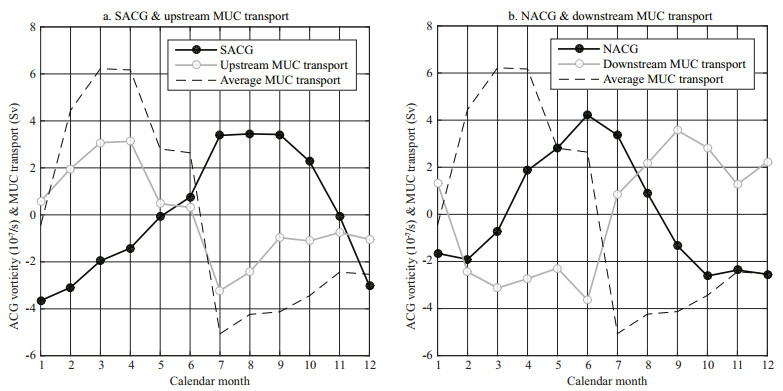
To quantify the seasonal variations better, in Fig. 9, we compared the monthly seasonal cycles of the SACG, NACG, and MUC transports. Here, the MUC transport was calculated by integrating V between 460–1 041 m and within 2° off the Mindanao coast. The SACG (black line; Fig. 9a) is strongest during December–January, as indicated by the negative vorticity peak, and it weakens rapidly during February–July. It has a large impact on the upstream MUC transport at 6°N (gray line; Fig. 9a), which has enhanced magnitude during March–April when the ACG is strong and minimum magnitude in July when the ACG is weakest. The northward transport averaged between 6°–10°N is a measure of the mean MUC transport along the Mindanao coast (black dashed line). Its seasonal cycle is strikingly similar to that of the upstream transport at 6°N, although its amplitude is larger. This result suggests the important role of the SACG in determining the seasonal variation of the MUC transport. The NACG shows a different seasonal cycle, which is stronger in boreal winter and weaker in May–July (Fig. 9b). Correspondingly, the downstream MUC transport at 10°N is also stronger in boreal winter and it shows a minimum in June. Interestingly, the average MUC transport is likely unrelated to the downstream MUC transport; their seasonal variations are nearly out of phase. In summary, Fig. 9 suggests that the seasonal variation of the SACG (NACG) is closely associated with the MUC transport in its upstream (downstream) area. Because the average MUC transport is dominated by its upstream part on the seasonal timescale, the role played by the SACG is much more important than the NACG.
|
| Figure 9 (a) Seasonal cycles of the SACG vorticity (black line; 10-7/s), upstream MUC transport at 6°N (gray line; Sv), and average MUC transport between 6°–10°N (black dashed line; Sv); (b) Similar to (a) but for the NACG vorticity, downstream MUC transport at 10°N, and average MUC transport All variables were computed for the depths of 460-1 041 m and plotted anomalies. |
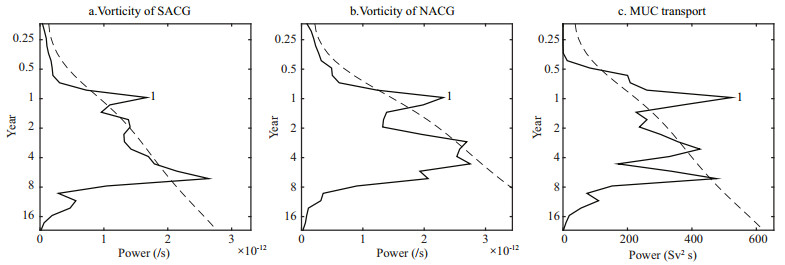
A power spectrum analysis was applied to obtain the dominant frequency over which the ACG and the MUC transport vary (Fig. 10). A seasonal cycle with a period of 1 year is remarkable in the SACG, NACG, and MUC transport (above the 95% significance level), indicating the robustness of the seasonality discussed above. However, high power values can be seen on the interannual timescale. The SACG shows a peak at 4–8 years (Fig. 10a), while the NACG has enhanced power at 3–5 years. The average MUC transport, on the other hand, exhibits two power peaks at 3–4 and 6–8 years, which might be associated with the higher-frequency variability in the NACG and lower-frequency variability in the SACG, respectively. On the decadal timescale ( > 8 years), their variations are much weaker. This feature highlights the difference between the subthermocline and the upper-ocean circulations. Strong decadal variations have been observed in the upper-ocean currents of this region, as indicated by sea level variations (Fig. 7) and previous studies (e.g., Chen and Wu, 2012; Qiu and Chen, 2012; Zhao et al. 2013). The prominent interannual variations and their possible causes are discussed in the following subsection.
|
| Figure 10 Power spectra of (a) the SACG vorticity, (b) NACG vorticity, and (c) average MUC transport Dashed curves denote the 95% significance level. |
We further investigate the interannual variations of the ACGs and their relationships with the MUC transport. Here, the interannual anomaly was obtained by applying a 13-month Lanczos low-pass filter (Duchon, 1979). The low-passed SACG vorticity is correlated significantly with upstream MUC transport with a correlation coefficient of r=-0.65 (Fig. 11a). The time series shows that most of the large positive (negative) MUC transport anomalies are induced by negative (positive) ACG vorticity anomalies. A similar relationship holds between the NACG vorticity and downstream MUC transport, which has a correlation coefficient of r=-0.64 (Fig. 11b). The interannual variations of the MUC transport are closely associated with the ACGs. Interestingly, no significant relationship is found between the upstream and downstream transports of the MUC or between the SACG and NACG. This indicates that the SACGupstream MUC system and the NACG-downstream MUC system are possibly controlled by different mechanisms. The average MUC transport (thin black line) is positively correlated with the upstream MUC transport (r=0.53) but negatively correlated with the downstream MUC transport (r=-0.70; Fig. 11); both exceed the 95% significance level. However, the negative correlation rules out the downstream transport as the dominated driver of MUC variability, albeit with a larger correlation magnitude. This means that the interannual variations of the average MUC transport are controlled primarily by its upstream component, and that the impact of the SACG is much larger than the NACG, which is similar to the case of the seasonal cycle.

|
| Figure 11 (a) The 13-month low-pass filtered SACG vorticity (thick gray line; 10-6/s) and upstream MUC transport (thick black line; Sv) at 6°N; (b) Same as (a) but for the NACG vorticity (thick gray line; 10-6/s) and downstream MUC transport (thick black line; Sv) at 10°N Thin black lines denote the average MUC transport (Sv) between 6°–10°N. |
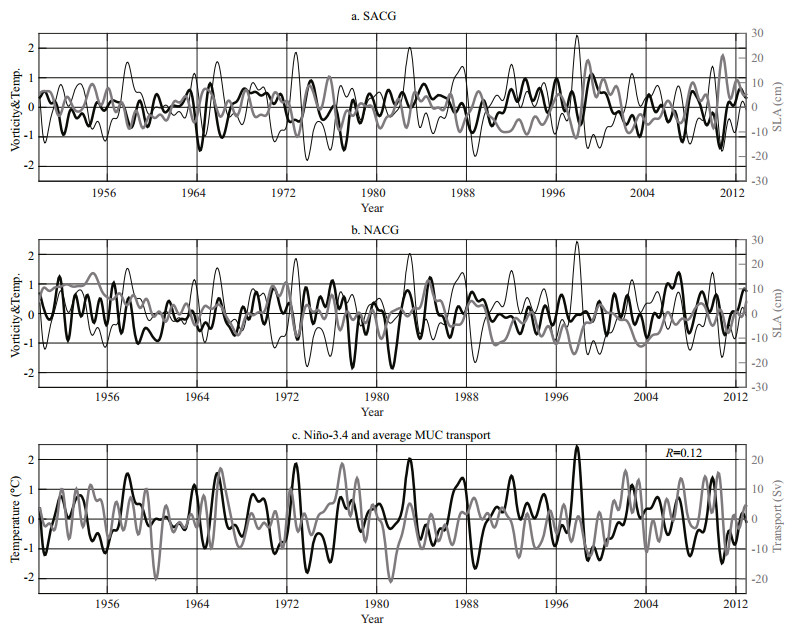
Given the importance of the ACG in determining MUC variability, it is of interest to consider the processes responsible for the pronounced interannual variations of the ACG. It is well known that the interannual variations of the upper-ocean circulation of this region, which can be represented by sea level variations, are predominantly determined by wind stress forcing via local Ekman pumping and by remotely forced westward-propagating Rossby waves (e.g., Qiu and Joyce, 1992; Qiu and Chen, 2010; Kashino et al., 2011; Li et al., 2012; Zhao et al., 2013). One salient feature of such a 1st baroclinic mode ocean response to wind forcing is the out-of-phase circulation anomalies above and below the main thermocline (e.g., Gill, 1982). If this mechanism dominates the subthermocline ACG on an interannual timescale, the ACG vorticity should show high positive correlation with the overlying sea level change, i.e., a positive vorticity anomaly (cyclonic) should corresponds to a positive SLA (anticyclonic). To examine this hypothesis, we compared the 13-month low-passed ACG vorticity (thick black line) and SLA (thick gray line) in Fig. 12a and b. The correlations are 0.16 and 0.25 in the SACG and NACG, respectively. These correlations do not change much if the lead-lag relationship is considered or if the cut-off length of the low-pass filter is changed (figures not shown). The correlations are not high, but over a 63-year record, the correlation coefficient of r=0.25 is significant at the 95% confidence level, assuming a freedom degree of 63 for interannual variability. Close inspection of the time series suggests that ACG vorticity and SLA do indeed show covariance in some periods, e.g., 1958–1966, 1972–1980, and 2006–2012 for the SACG region, and 1966–1979, 1983–1990, and 2006–2012 for the NACG. This relationship indicates that part of the ACG variation might derive from surface wind forcing of the upper-ocean circulation, at least in some of the interannual events.
|
| Figure 12 (a) The 13-month low-passed SACG vorticity (thick black line; 10-6/s) compared with the 13-month low-passed SLA (thick gray line; cm) averaged in the SACG box based on the OFES output. Thin black line denotes the 13-month low-passed Niño-3.4 index (℃); (b) Same as (a) but for the NACG box; (c) The 13-month low-passed Niño-3.4 index (black line; ℃) and average MUC transport between 6°–10°N (gray line; Sv) |
Another detectable feature of the wind-forced variations is their tendency of westward propagation (e.g., and Joyce, 1992; Qiu and Chen, 2010; Li et al., 2012). However, in the time-longitude plots of vorticity anomaly, such tendency is not seen for either SACG or NACG (Fig. 13). Instead, large vorticity variations are likely generated locally and confined to the western boundary. This pattern suggests the possibility that interannual variability of the ACG might arise partly from the oceanic internal instability of the strong western boundary currents, such as shear-induced dynamical instabilities. Further research is needed to investigate this possibility fully.

|
| Figure 13 Time-longitude plots of the 13-month low-pass filtered vorticity (/s) from 2000–2012 along (a) 5.8°N and (b) 10°N |
In addition, wind-driven oceanic interannual variations in this region are closely associated with ENSO (e.g., Kashino et al., 2009, 2011; Qiu and Chen, 2010; Li et al., 2012; Zhao et al., 2013), because tropical Pacific Ocean surface wind variations are dominated by ENSO on the interannual timescale. The correlation between SACG vorticity and the Niño-3.4 index reaches -0.41 when the SACG leads by 6 months, while the NACG also shows a negative correlation (-0.1 to -0.3) during the year prior to an El Niño event. It means that at the developing stage of an El Niño, the ACGs are enhanced (negative vorticity anomaly). This might be related with the enhanced East Asian summer monsoon in the developing year of an El Niño (e.g., Tomita and Yasunari, 1996; Wang et al., 2000), which gives rise to anomalous cyclonic wind stress curl over the Philippine Sea (e.g., Li et al., 2014). As the 1st baroclinic mode response to this surface cyclonic wind, an anomalous anticyclonic flow is produced below the thermocline. This relationship is also reflected in the MUC transport, which shows a correlation of r=0.36 (exceeding the 80% significance level) with the Niño-3.4 index at seven months' lead, although the correlation is only 0.12 for synchronous data (Fig. 12c). The monsoon wind anomalies induced by ENSO enhance the MUC transport through strengthening the subthermocline ACG (mainly the SACG). This mechanism is in agreement with the numerical model results of Hu et al. (2015b), which demonstrated that the wind stress forcing in the far western Pacific Ocean (120°–150°E) explained a large proportion of the interannual variability of the MUC. If this were the case, both the upper-ocean and intermediate-layer circulation variations would be attributable to ENSO to some extent. Then, one might consider the reason for the low correlation between the ACG and SLA. This might be related to the fact that the upper-ocean circulation variations (SLA) of the Philippine Sea are controlled primarily by remote wind forcing from the central to eastern Pacific through westwardpropagating Rossby waves (e.g., Qiu and Joyce, 1992; Qiu and Chen, 2010; Li et al., 2012), while the ACG variations are affected by the local wind forcing of the summer monsoon (Fig. 13). This difference could possibly lead to the low correlation between SLA and the ACG. However, we need to notice that the relationship between the ACG (or MUC) and ENSO is not close. Therefore, a large proportion of ACG variability cannot be explained in the present analysis. Further investigation is required to uncover the underlying mechanisms fully.
5 CONCLUSIONWhile the upper-ocean circulation of the Philippine Sea has been investigated extensively, knowledge of the subthermocline circulation of this region remains fragmented. One of the salient features of the subthermocline circulation is the quasi-permanent ACG that exists to the east of Mindanao. It involves a northward flow along the Mindanao coast and thus, it is associated closely with the MUC. In this study, we investigated the spatial structure and temporal variability of the subthermocline ACG, together with its relationship with the MUC transport. The objective was to provide further insight into the regional ocean dynamics by extending the knowledge of the upperocean circulation to the intermediate layer.
The anticyclonic structure of the HE is confined in the upper 400 m and to the east of 130°E. However, the ACG in the intermediate layer (26.8–27.3 σθ) exists below the cyclonic ME and it covers a large area of the region 3°–10°N, 127°–131°E, which deviates greatly from the HE. The anticyclonic flow of the ACG is disconnected from and much stronger than the lower portion of the HE at 200–400 m. Given this situation, it is unlikely that the subthermocline ACG is related to the surface HE. Comparisons between the OFES output with observational data of AVISO and WOA13 suggest the fidelity of the OFES in simulating the upper and intermediate circulation of this region. Analysis of the eddy-resolving OFES simulation revealed further detailed features of the ACG. The ACG in the OFES comprises two components. The first is the SACG, centered at 5.8°N, 128.5°E (covering an area of 3°–8°N, 127°–131°E), which incorporates the northward flow from the southern tip of Mindanao to ~7°N. The second is the NACG, centered at 10°N, 128.1°E (covering an area of 8°–12°N, 126°–131°E), which incorporates the northward flow from 8°–12°N along the Mindanao coast.
While the SACG is seen in the WOA13 climatology and some previous observational studies (e.g., Qu et al., 1999; Qiu et al., 2015; Wang et al., 2015), the structure of the NACG is not evident in the WOA13 climatology nor in the results of Qu et al. (1999) and Wang et al. (2015). In these datasets, heavy smoothing was employed and thus, they might not be able to resolve fully the complex circulation structure near the western boundary. In the new dataset of Qiu et al. (2015), which incorporates more data, especially the recently collected high-resolution (1/8 degree) Argo float data, an anticyclonic structure similar to the NACG is clearly evident to the northeast of Mindanao (their Fig. 4). Therefore, the NACG is likely not an artificial phenomenon and a high-resolution dataset will be required to resolve its structure accurately.
The seasonal and low-frequency variabilities of the ACG and their impact on the MUC were explored. The SACG is strongest during December–January and weakest in July. It has a large impact on the upstream MUC transport at 6°N, which shows a similar seasonal cycle. Interestingly, the average transport averaged between 6°–10°N, as a measure of the mean MUC transport along the Mindanao coast, also shows a seasonal cycle that has striking resemblance to that of the upstream MUC transport at 6°N. However, the NACG is stronger in boreal winter and weaker in May–July. Correspondingly, the downstream MUC transport at 10°N is also stronger in boreal winter and it shows a minimum in June. The average MUC transport is however unrelated to the downstream MUC transport. Therefore, on the seasonal timescale, the SACG has a larger impact on the average MUC transport than the NACG. A power spectrum analysis was performed to obtain the dominant frequencies at which the ACG and MUC vary. In addition to the seasonal cycle (1 year), the SACG (NACG) shows enhanced power over the period of 4–8 years (3–5 years), while the MUC transport exhibits two power peaks at 3–4 and 6–8 years. In comparison, variations on the decadal timescale ( > 8 years) are much weaker than the interannual variabilities.
On the interannual timescale, the ACG is closely related to the MUC transport. Variations of the average MUC transport are likely dominated by its upstream part and hence, the SACG plays the more important role. Possible causes for the ACG variability were discussed. Interannual variations of the ACG are not correlated significantly with the SLA, and the ACG anomalies do not show an evident tendency of westward propagation. These features are dramatically different from the upper-ocean circulation variability. The SACG vorticity shows a correlation of r=-0.41 with the index when it leads the Niño-3.4 index by 6 months, while the NACG also shows a negative correlation (-0.1 to -0.3) during the year before an El Niño event. Interestingly, the MUC transport also shows a correlation of r=0.36 with the Niño-3.4 index at a 7-months lead. It means that ENSO might affect the ACG and MUC variations through the local wind forcing of the East Asian monsoon. At the developing stage of an El Niño, the enhanced East Asian summer monsoon gives rise to anomalous cyclonic wind stress curl over the Philippine Sea, which leads to an anticyclonic anomalous flow below the thermocline as a 1st baroclinic mode ocean response and to the strengthening of the ACG and MUC. In addition to ENSO-related local wind forcing, some of the ACG and MUC variability might arise from oceanic internal instability of the western boundary currents.
This study described the seasonal/interannual variations of the ACG and its relationship with the MUC, but did not draw firm conclusions regarding the underlying mechanisms. In fact, it is difficult to address this subject with the present data and methods, because the ACG anomaly does not show a very strong relationship with the overlying sea level or surface winds. This mechanism is however very important and of considerable interest, because it provides indications regarding the generation of the ACG and MUC. To achieve an in-depth understanding of this issue, a process-oriented ocean modeling research project should be conducted in the future, with experiments to isolate the effects of different processes, such as local/remote wind forcing, oceanic internal instability, and heat and freshwater fluxes.
6 ACKNOWLEDGEMENTWe are very grateful for the insightful comments of the two anonymous reviewers that helped us improve the work.
| Arruda W Z, Nof D, 2003. The Mindanao and Halmahera Eddies-twin eddies induced by nonlinearities. J. Phys.Oceanogr., 33(12): 2815–2830. Doi: 10.1175/1520-0485(2003)033<2815:TMAHEE>2.0.CO;2 |
| Chelton D B, Schlax M, Samelson R M, 2011. Global observations of nonlinear mesoscale eddies. Prog.Oceanogr., 91(2): 167–216. Doi: 10.1016/j.pocean.2011.01.002 |
| Chen Z H, Wu L X, 2012. Long-term change of the Pacific North Equatorial Current bifurcation in SODA. J.Geophys. Res. Oceans, 117(C6): C06016. Doi: 10.1029/2011JC007814 |
| Chiang T L, Qu T D, 2013. Subthermocline eddies in the western equatorial Pacific as shown by an eddy-resolving OGCM. J. Phys. Oceanogr., 43(7): 1241–1253. Doi: 10.1175/JPO-D-12-0187.1 |
| Chiang T L, Wu C R, Qu T D, Hsin Y C, 2015. Activities of 50-80 day subthermocline eddies near the Philippine coast. J. Geophys. Res. Oceans, 120(5): 3606–3623. Doi: 10.1002/2013JC009626 |
| Ducet N, Le Traon P Y, Reverdin G, 2000. Global highresolution mapping of ocean circulation from TOPEX/Poseidon and ERS-1and -2. J. Geophys. Res. Oceans, 105(C8): 19477–19498. Doi: 10.1029/2000JC900063 |
| Duchon C E, 1979. Lanczos filtering in one and two dimensions. J. Appl. Meteor., 18(8): 1016–1022. Doi: 10.1175/1520-0450(1979)018<1016:LFIOAT>2.0.CO;2 |
| Fine R A, Lukas R, Bingham F M, Warner M J, Gammon R H, 1994. The western equatorial Pacific:a water mass crossroads. J. Geophys. Res. Oceans, 99(C12): 25063–25080. Doi: 10.1029/94JC02277 |
| Firing E, Kashino Y, Hacker P, 2005. Energetic subthermocline currents observed east of Mindanao. Deep Sea Res. Part Ⅱ Top. Stud. Oceanogr., 52(3-4): 605–613. Doi: 10.1016/j.dsr2.2004.12.007 |
| Gill A E. 1982. Atmosphere-Ocean Dynamics, Vol. 30. Academic Press, London. |
| Hamlington B D, Leben R R, Nerem R S, Han W, Kim K Y, 2011. Reconstructing sea level using cyclostationary empirical orthogonal functions. J. Geophys. Res. Oceans, 116(C12): C12015. Doi: 10.1029/2011jc007529 |
| Hu D X, Cui M C, Qu T D, Li Y X, 1991. A subsurface northward current off Mindanao identified by dynamic calculation. Elsevier Oceanogr. Ser., 54: 359–365. Doi: 10.1016/S0422-9894(08)70108-9 |
| Hu D X, Wu L X, Cai W J, Gupta A S, Ganachaud A, Qiu B, Gordon A L, Lin X P, Chen Z H, Hu S J, Wang G J, Wang Q Y, Sprintall J, Qu T D, Kashino Y J, Wang F, Kessler W S, 2015a. Pacific western boundary currents and their roles in climate. Nature, 522(7556): 299–308. Doi: 10.1038/nature14504 |
| Hu S J, Hu D X, Guan C, Wang F, Zhang L L, Wang F J, Wang Q Y, 2015b. Interannual variability of the mindanao current/undercurrent in direct observations and numerical simulations. J. Phys. Oceanogr., 46(2): 483–499. |
| Kalnay E, Kanamitsu M, Kistler R, Collins W, Deaven D, Gandin L, Iredell M, Saha S, White G, Woollen J, Zhu Y, Leetmaa A, Reynolds R, Chelliah M, Ebisuzaki W, Higgins W, Janowiak J, Mo K C, Ropelewski C, Wang J, Jenne R, Joseph D, 1996. The NCEP/NCAR 40-year reanalysis project. Bull. Amer. Meteor. Soc., 77(3): 437–472. Doi: 10.1175/1520-0477(1996)077<0437:TNYRP>2.0.CO;2 |
| Kashino Y, Atmadipoera A, Kuroda Y, Lukijanto, 2013. Observed features of the Halmahera and Mindanao Eddies. J. Geophys. Res. Oceans, 118(12): 6543–6560. Doi: 10.1002/2013JC009207 |
| Kashino Y, España N, Syamsudin F, Richards K J, Jensen T, Dutrieux P, Ishida A. 2009. Observations of the North Equatorial Current, Mindanao Current, and the Kuroshio Current system during the 2006/07El Niño and 2007/08 La Niña. J. Oceanogr., 65(3): 325-333, http://dx.doi.org/10.1007/s10872-009-0030-z. |
| Kashino Y, Ishida A, Hosoda S, 2011. Observed ocean variability in the mindanao dome region. J. Phys.Oceanogr., 41(2): 287–302. Doi: 10.1175/2010JPO4329.1 |
| Kashino Y, Ishida A, Kuroda Y, 2005. Variability of the Mindanao current:mooring observation results. Geophys.Res.Lett., 32(18). Doi: 10.1029/2005GL023880 |
| Kashino Y, Ueki I, Sasaki H, 2015. Ocean variability east of Mindanao:mooring observations at 7°N, revisited. J.Geophys. Res. Oceans, 120(4): 2540–2554. Doi: 10.1002/2015JC010703 |
| Kashino Y, Watanabe H, Herunadi B, Aoyama M, Hartoyo D, 1999. Current variability at the Pacific entrance of the Indonesian throughflow. J. Geophys. Res. Oceans, 104(C5): 11021–11035. Doi: 10.1029/1999JC900033 |
| Li Y L, Han W Q, Wilkin J L, Zhang W G, Arango H, ZavalaGaray J, Levin J, Castruccio F S, 2014. Interannual variability of the surface summertime eastward jet in the South China Sea. J. Geophys. Res. Oceans, 119(10): 7205–7228. Doi: 10.1002/2014JC010206 |
| Li Y L, Wang F, Zhai F G, 2012. Interannual variations of subsurface spiciness in the Philippine Sea:observations and mechanism. J. Phys. Oceanogr., 42(6): 1022–1038. Doi: 10.1175/JPO-D-12-06.1 |
| Li Y L, Wang F, 2012. Spreading and salinity change of North Pacific tropical water in the Philippine Sea. J. Oceanogr., 68(3): 439–452. Doi: 10.1007/s10872-012-0110-3 |
| Locarnini R A, Mishonov A V, Antonov J I, Boyer T P, Garcia H E, Baranova O K, Zweng M M, Paver C R, Reagan J R, Johnson D R, Hamilton M, Seidov D. 2013. World Ocean Atlas 2013, Volume 1: temperature. In: Levitus S ed. NOAA Atlas NESDIS 73. p. 40. |
| Lukas R, Firing E, Hacker P, Richardson P L, Collins C A, Fine R, Gammon R, 1991. Observations of the Mindanao Current during the western equatorial Pacific Ocean circulation study. J. Geophys. Res. Oceans, 96(C4): 7089–7104. Doi: 10.1029/91JC00062 |
| Lukas R, Yamagata T, McCreary J P, 1996. Pacific low-latitude western boundary currents and the Indonesian throughflow. J. Geophys. Res. Oceans, 101(C5): 12209–12216. Doi: 10.1029/96JC01204 |
| Masumoto Y, Sasaki H, Kagimoto T, Komori N, Ishida A, Sasai Y, Miyama T, Motoi T, Mitsudera H, Takahashi K, Sakuma H, Yamagata T, 2004. A fifty-year eddy-resolving simulation of the world ocean-Preliminary outcomes of OFES (OGCM for the Earth simulator). J. Earth Sim., 1: 35–56. |
| Nitani H. 1972. Beginning of the Kuroshio. In: Stommel H, Yoshida K eds. Kuroshio: Its Physical Aspects. University of Tokyo Press, Tokyo, Japan. p. 129-163. |
| Qiu B, Chen S M, Rudnick D L, Kashino Y, 2015. A new paradigm for the North Pacific Subthermocline lowlatitude western boundary current system. J. Phys.Oceanogr., 45(9): 2407–2423. Doi: 10.1175/JPO-D-15-0035.1 |
| Qiu B, Chen S M, 2010. Interannual-to-decadal variability in the bifurcation of the North Equatorial Current off the Philippines. J. Phys. Oceanogr., 40(11): 2525–2538. Doi: 10.1175/2010JPO4462.1 |
| Qiu B, Chen S M, 2012. Multidecadal sea level and gyre circulation variability in the northwestern tropical Pacific Ocean. J. Phys. Oceanogr., 42(1): 193–206. Doi: 10.1175/JPO-D-11-061.1 |
| Qiu B, Joyce T M, 1992. Interannual variability in the mid-and low-latitude Western North Pacific. J. Phys. Oceanogr., 22(9): 1062–1084. Doi: 10.1175/1520-0485(1992)022<1062:IVITMA>2.0.CO;2 |
| Qiu B, Rudnick D L, Chen S M, Kashino Y. 2013. Quasistationary North Equatorial Undercurrent jets across the tropical North Pacific Ocean. Geophys. Res. Lett., 40(10):2183-2187, http://dx.doi.org/2110.1002/grl.50394. |
| Qu T D, Chiang T L, Wu C R, Dutrieux P, Hu D X, 2012. Mindanao Current/Undercurrent in an eddy-resolving GCM. J. Geophys. Res. Oceans, 117(C6): C06026. Doi: 10.1029/2011JC007838 |
| Qu T D, Lindstrom E J, 2004. Northward intrusion of antarctic intermediate water in the western pacific. J. Phys.Oceanogr., 34(9): 2104–2118. Doi: 10.1175/1520-0485(2004)034<2104:NIOAIW>2.0.CO;2 |
| Qu T D, Lukas R, 2003. The bifurcation of the North Equatorial Current in the Pacific. J. Phys. Oceanogr., 33(1): 5–18. Doi: 10.1175/1520-0485(2003)033<0005:TBOTNE>2.0.CO;2 |
| Qu T D, Mitsudera H, Yamagata T, 1998. On the western boundary currents in the Philippine Sea. J. Geophys. Res.Oceans, 103(C4): 7537–7548. Doi: 10.1029/98JC00263 |
| Qu T D, Mitsudera H, Yamagata T, 1999. A climatology of the circulation and water mass distribution near the Philippine coast. J. Phys. Oceanogr., 29(7): 1488–1505. Doi: 10.1175/1520-0485(1999)029<1488:ACOTCA>2.0.CO;2 |
| Rio M H, Guinehut S, Larnicol G, 2011. New CNES-CLS09global mean dynamic topography computed from the combination of GRACE data, altimetry, and in situ measurements. J. Geophys. Res. Oceans, 116(C7): C07018. Doi: 10.1029/2010jc006505 |
| Sasaki H, Sasai Y, Kawahara S, Furuichi M, Araki F, Ishida A, Yamanaka Y, Masumoto Y, Sakuma H. 2004. A series of eddy-resolving ocean simulations in the world oceanOFES (OGCM for the Earth Simulator) project. In: OCEANS'04. MTTS/IEEE TECHNO-OCEAN'04. IEEE, 3: 1535-1541. |
| Schönau M C, Rudnick D L, Cerovecki I, Gopalakrishnan G, Cornuelle B D, McClean J L, Qiu B, 2015. The Mindanao Current:mean structure and connectivity. Oceanography, 28(4): 34–45. Doi: 10.5670/oceanog |
| Tomita T, Yasunari T, 1996. Role of the northeast winter monsoon on the biennial oscillation of the ENSO/monsoon system. J. Meteor. Soc. Jpn., 74(4): 399–413. Doi: 10.2151/jmsj1965.74.4_399 |
| Toole J M, Millard R C, Wang Z, Pu S, 1990. Observations of the Pacific North Equatorial Current bifurcation at the Philippine coast. J. Phys. Oceanogr., 20(2): 307–320. Doi: 10.1175/1520-0485(1990)020<0307:OOTPNE>2.0.CO;2 |
| Volkov D L, Larnicol G, Dorandeu J, 2007. Improving the quality of satellite altimetry data over continental shelves. J. Geophys. Res. Oceans, 112(C6): C06020. Doi: 10.1029/2006JC003765 |
| Wang B, Wu R G, Fu X H, 2000. Pacific-East Asian teleconnection:how does ENSO affect East Asian climate?. J. Climate, 13(9): 1517–1536. Doi: 10.1175/1520-0442(2000)013<1517:PEATHD>2.0.CO;2 |
| Wang F, Hu D X, 1998. Dynamic and thermohaline properties of the Mindanao undercurrent, part Ⅰ. Dynamic structure. Chin. J. Oceanol. Limnol., 16(2): 122–127. Doi: 10.1007/BF02845177 |
| Wang F, Hu D, Bai H. 1998. Western boundary undercurrents east of the Philippines. In: He M X, Chen G eds. Proceedings of PORSEC'98-Qingdao, 28-31July. Ocean Remote Sens. Inst., Ocean Univ. of Qingdao, Qingdao, China. p. 551-556. |
| Wang F, Song L N, Li Y L, Liu C Y, Wang J N, Lin P F, Yang G, Zhao J, Diao X Y, Zhang D X, Hu D X, 2016. Semiannually alternating exchange of intermediate waters east of the Philippines. Geophys. Res. Lett., 43(13): 7059–7065. Doi: 10.1002/2016GL069323 |
| Wang F, Zang N, Li Y L, Hu D X, 2015. On the subsurface countercurrents in the Philippine Sea. J. Geophys. Res.Oceans, 120(1): 131–144. Doi: 10.1002/2013JC009690 |
| Zhang L L, Hu D X, Hu S J, Wang F, Wang F J, Yuan D L, 2014. Mindanao Current/Undercurrent measured by a subsurface mooring. J. Geophys. Res. Oceans, 119(6): 3617–3628. Doi: 10.1002/2013JC009693 |
| Zhao J, Li Y L, Wang F, 2013. Dynamical responses of the west Pacific North equatorial countercurrent (NECC) system to El Niño Events. J. Geophys. Res. Oceans, 118(6): 2828–2844. Doi: 10.1002/jgrc.20196 |
| Zweng M M, Reagan J R, Antonov J I, Locarnini R A, Mishonov A V, Boyer T P, Garcia H E, Baranova O K, Johnson D R, Seidov D, Biddle M M. 2013. World Ocean Atlas 2013, Vol. 2: salinity. In: Levitus S ed. NOAA Atlas NESDIS 74. p. 39. |
 2017, Vol. 35


