 2017, Vol. 35
Institute of Oceanology, Chinese Academy of Sciences
Article Information
- WANG Xia(王霞), FENG Jianhua(冯建华), HUANG Aiyou(黄爱优), HE Linwen(何林文), NIU Jianfeng(牛建峰), WANG Guangce(王广策)
- Identification of potential internal control genes for real-time PCR analysis during stress response in Pyropia haitanensis
- Chinese Journal of Oceanology and Limnology, 35(6): 1432-1441
- http://dx.doi.org/10.1007/s00343-017-6005-9
Article History
- Received Mar. 28, 2016
- accepted in principle Jun. 22, 2016
- accepted for publication Aug. 12, 2016


2 Laboratory for Marine Biology and Biotechnology, Qingdao National Laboratory for Marine Science and Technology, Qingdao 266071, China;
3 Nantong Branch, Institute of Oceanology, Chinese Academy of Sciences, Nantong 226006, China;
4 University of Chinese Academy of Sciences, Beijing 100049, China
Pyropia haitanensis, an endemic species of China, belongs to the order Bangiales, the most genetically diverse order of red algae (Ragan et al., 1994). Blades of Py. haitanensis are found in the upper intertidal zones of rocky shores, enduring cycles of desiccation and immergence. Thus, certain stress response mechanisms must have evolved in this seaweed. Pyropia is probably of an ancient origin with a long evolutionary history (Blouin et al., 2011). Thus, the stress response mechanisms in these algae might be different from those in higher plants and even in some freshwater algae.
Pyropia haitanensis was first cultivated in Pingtan, Fujian Province, China 1 000 years ago (Zhang et al., 2004). Nowadays, with the establishment and development of modern aquaculture technology, it is an extensively cultivated species in the south of China. The output of Py. haitanensis accounts for 85%–90% of the gross production of cultivated Porphyra in China (Yan et al., 2005). However, many problems still exist in cultivating Py. haitanensis, such as the degeneration of germ quality and a deficiency of high-yield, stress-resistant breeds. Several projects dedicated to seedling cultivation using various methods have been initiated in China. During these projects, real-time quantitative PCR (qRT-PCR) analysis is a technique widely used since gene expression profiles offer information on the regulation of various biological processes (Wise et al., 2007).
An analysis of target gene expression levels can contribute significantly to understanding physiological processes, such as stress responses (Reymond et al., 2000; Setter and Flannigan, 2001). Four commonly used methods for the quantification of transcription are northern blotting, in situ hybridization (Parker and Barnes, 1999), RNase protection assays (Hod, 1992; Saccomanno et al., 1992), and qRT-PCR. The qRT-PCR is a sensitive and flexible method (Giulietti et al., 2001) that can be used to compare mRNA levels in different samples and to characterize mRNA expression patterns (Bustin, 2000; Giulietti et al., 2001; Ginzinger, 2002). A reliable quantification method required eliminating errors derived from the efficiencies of reverse transcription and PCR efficiencies. Indeed, the normalization to an internal control gene would remove the difference in input cDNA amounts derived from the difference of reverse transcription efficiencies among samples (Giulietti et al., 2001). Thus, the 2-ΔΔCt method based on the applying of the internal control gene was the most commonly used quantification method at present. The internal control genes or housekeeping genes which are expressed in a universal and invariant level can serve as the control to correct variations, such as different reverse transcription efficiency, and help to obtain the accurate data. However, the expression levels of these internal control genes usually vary greatly under different experimental conditions (Thellin et al., 1999; Bustin, 2000; Suzuki et al., 2000; Figueroa et al., 2003). More importantly, the peculiar evolutionary status and geographic distribution of Py. haitanensis meant that we could not use the internal control genes that are frequently used in higher plants or other algae. To date, there have been no reports, except that of Wu et al. (2012), who focused on the selection of potential internal control genes at different life-history stages in Py. haitanensis, concerning the identification of internal control genes for thalli subjected to changing environmental conditions.
In this study, we investigated the effects of high salinity and strong light on the photosynthetic parameters of Py. haitanensis. Then, based on the results of pulse-amplitude-modulation fluorometry (PAM), some of the algae samples treated with the different stresses were used for a transcription analysis. The expression level of seven potential reference genes, which were commonly used as internal controls, was assessed by qRT-PCR to determine potential reference gene. A common statistical algorithm, geNorm, was used to identify expression stability. And, the absolute quantification method was applied to further identify the constantly expressed genes. The results will provide useful guidelines for future studies on suitable internal control gene's selection in stress-response research in Py. haitanensis.
2 MATERIAL AND METHOD 2.1 Py. haitanensis cultureFresh Py. haitanensis leafy gametophytes were collected from Haihu Seaweed Farming Company, Zhejiang Province. Before the stress treatment experiments, the blades were resuscitated at 16℃ for 1 day in tanks with a cycle of 50 μmol photons/(m2·s) cool-white fluorescent irradiance for 10 h and darkness for 14 h. Then, the sea water was replaced with Provasoli's enriched seawater (PES) medium and bubbled continuously with filter-sterilized air through an air inlet at the bottom of the flask. During the experiments, the PES medium was renewed every day.
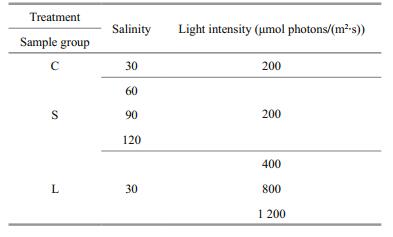
2.2 Treatment of Py. haitanensis blades with various stressesThree groups of healthy Py. haitanensis blades were treated separately. For the salinity stress group, the samples were kept in sea water at 16℃ with irradiation of 200 μmol photons/(m2·s), and crude salt was added to obtain salinity levels of 30, 60, 90 and 120. For the light-stress group, the samples were maintained in sea water at 16℃ with 30 salinity and exposed to 200 (control), 400, 800, and 1 200 μmol photons/(m2·s) illumination. The samples were treated for 4 h and then immediately transferred to the dark. A PAM (Heinz Walz, Effeltrich, Germany) was applied to determine the photosynthetic parameters. For all of the groups, the control sample was Py. haitanensis cultured in normal sea water at 16℃ with 30 salinity and irradiation of 200 μmol photons/(m2·s) (sample group C in Table 1).
The chlorophyll fluorescence levels of photosystem II (PSII) in vivo in the stress-treated samples were determined using a Dual-PAM fluorometer (Heinz Walz). Three replicates were set for every sample in per groups and each of the sample groups was acclimated to the dark for 10 min before the fluorescence was measured. The intrinsic fluorescence (F0) of the antennal system of fully oxidized PSII was detected first under a weak measuring light (7 μmol photons/(m2·s)). Then, a 0.8-s high intensity (6 000 μmol photons/(m2·s)) saturating actinic light pulse was applied to obtain the maximal fluorescence (Fm) from the fully reduced PSII reaction centers in the dark-adapted samples (Figueroa et al., 2003). The difference between Fm and F0 is a measure of the variable fluorescence (Fv), and the maximal quantum yield was obtained as Fv/Fm (Schreiber et al., 1986), which was used to evaluate the potential ability of the algae to transfer light-energy into chemical energy. The effective quantum yield, Y(II), was calculated as described previously (Genty et al., 1989) as:
Y(II)=(Fm'–F)/Fm',
where Fm' is the maximum fluorescence yield in an illuminated sample. Non-photochemical quenching (NPQ), which denotes the regulated dissipation of photosynthetic energy conversion in PSII (Schreiber et al., 1986).
Experiments were carried out using the automated procedures provided by the Dual-PAM software at room temperature, and the above mentioned parameters can be read directly in the report window on computer. Values of the measurements were expressed as means±standard deviations.
2.4 RNA isolation and reverse transcriptionSamples under different stress treatment were collected to extract RNA. Based on the manufacturer's protocols, we used an RNAprep Pure plant kit (Tiangen Biotech Co., Beijing, China) to extract the total RNA. The concentration was quantified with a Qubit fluorometer (Invitrogen Corp., Carlsbad, CA, USA) using the corresponding RNA Assay Kit (Invitrogen Corp.). The RNA yield was calculated as RNA quantity/sample weight. A statistical analysis was performed using a one way ANOVA and the values were deemed to be significantly different when P < 0.05.
RNase-free DNase I (Promega Biotech Co., Madison, WI, USA) was added to the isolated RNA solution to eliminate genomic DNA contamination and then the effect of digestion was checked with glyceraldehyde-3-phosphate dehydrogenase (GAPDH) primers using the total RNA as the template prior to qRT-PCR. Reverse transcription was carried out in a PCR apparatus (Eppendorf, Hamburg, Germany) according to the manufacturer's instructions using M-MLV reverse transcriptase (Promega Biotech Co.) and random primers. The amplified cDNA was stored at -80℃ for later use.
2.5 Genomic DNA extractionTo eliminate possible errors caused by different degree of fragmentation in different samples during RNA isolation, we also set aside part of the sample powder for genomic DNA extraction using a Universal Genomic DNA Extraction Kit (TaKaRa, Dalian, China) following the manufacturer's instructions. Then, the genomic DNA concentration was quantified using a Qubit fluorometer with the corresponding DNA Assay Kit (Invitrogen Corp.). Finally, we used the DNA quantity/sample weight to calculate the DNA yield.
2.6 Normalization of RNA yield by DNATo minimize the inaccuracies in RNA yields among individual extractions, the quantity of RNA was normalized using the genomic-DNA yield derived from the same batch of ground algae. The relative RNA yield was expressed as RNA quantity/DNA quantity.
2.7 Primer designThe genes that we selected as potential internal control genes were 18S ribosomal RNA (18S), GAPDH, elongation factor 3 (EF3), 30S ribosomal protein (RPS), α-tubulin (TubA), actin (ACT) and β-tubulin (TubB). The gene sequences were obtained from our in-house EST database. Primers were designed using Primer Premier 5.0 (Premier Biosoft International, Palo Alto, CA, USA) and evaluated with Oligo Primer Analysis software (Wojciech and Piotr Rychlik Copyright, version 6.31). The primer sequences and other details are shown in Table 2.
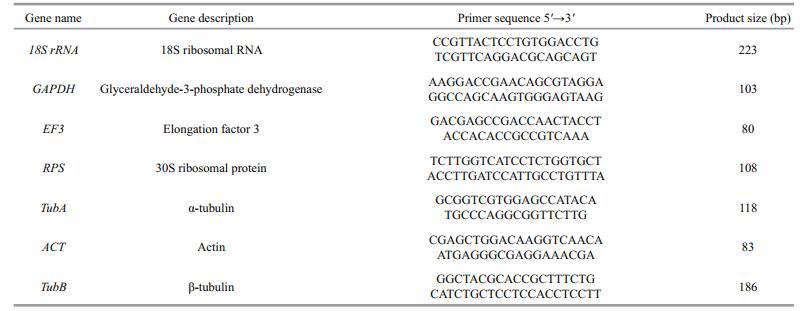
All of the fragments of the seven selected genes were amplified by conventional PCR and purified using an EZNA TM Gel Extraction kit (OMEGA BioTech, Doraville, GA, USA). The purified fragments were then cloned into the PMD19-T vector (Tiangen Biotech Co.) and transformed into Escherichia coli competent cells. Subsequently, the cloned plasmids were purified using the EZNA TM plasmid mini kit (OMEGA Bio-Tek) and quantified using a Qubit fluorometer with the corresponding dsDNA Assay Kit (Invitrogen Corp.). Based on the concentration (g/mL) and length of the vector, the copy number was calculated as described previously (Whelan et al., 2003):
Copy number=[6.02×10²³ (copies/mol)×DNA amount (g)]/[DNA length (bp)×660 (g/(mol·bp))].
We run the qRT-PCR in triplicate on a BIO-RAD IQ5 RT-PCR detection system (Bio-Rad, Hercules, California, USA) using SYBR Green Master Mix (Tiangen, Beijing, China). The PCR reaction mixture was prepared in a total volume of 20 μL containing 9 μL SYBR Green Master Mix, 2 μL 1:10 diluted template (plasmid or cDNA), 5 μL of sense and antisense primers (2 μmol/L) and 4 μL RNase-free water. The reaction conditions were: 3 min at 94℃, followed by 40 cycles of 15 s at 94℃, 40 s at 60– 64℃ and 30 s at 72℃.
To validate the specificity of the amplification, the melting curve was generated by heating for 30 s from 55 to 95℃. A 10-fold serial dilution of each plasmid was prepared and a standard curve was constructed (Whelan et al., 2003). The amplification efficiency (E) was calculated as follows:
Efficiency= [10(-1/slope)–1]×100%.
Considering that different stresses would lead to different effects on gene expression levels, the samples were divided into two groups, salinity and strong light treatments. Based on the photosynthetic parameters, the samples whose Fv/Fm was significantly decreased but Y(II) showed relatively stable were selected for absolute quantification analyses. The mRNA abundance levels of the seven candidate reference genes in all of the samples were determined by the Ct values obtained. Then, the stability parameters of these genes in each group were analyzed using geNorm software following the manual. By calculating gene expression stability (M), this software created a stability ranking. The gene with the lowest M value was the most stable (Vandesompele et al., 2002). Usually, if the M value < 1.5, then the gene could be regarded as a potential reference gene.
2.9 Absolute quantificationThe copy numbers of the internal control genes in different samples were calculated by relating threshold cycle (Ct) values to the standard curves (Yu et al., 2005; Lee et al., 2006). After normalization against the genomic-DNA yield in each group, the expression levels of the tested genes in the different samples were compared. We selected the copy number of the genes in sample C (leafy gametophyte cultured in 30 salinity at 16℃ with 200 μmol photons/(m2·s) light-intensity) as the control, against which the behavior of each of the tested genes under the various experimental stress treatments was evaluated. The expression stability of the tested genes in response to experimental stress treatments was evaluated by comparing the observed copy numbers among the different samples. The relative transcriptional level was deemed to be stably expressed when the ratio was between 0.5 and 2.
3 RESULT 3.1 Effects of stress conditions on the photosynthetic parametersThe variations in Py. haitanensis treated with the different stresses are summarized in Fig. 1. For the salt-stress group, the values of Fv/Fm and the effective PSII quantum yield [Y(II)] declined as the salinity increased. When the salinity reached 120, both the potential and the effective quantum yield of PSII declined sharply (Fig. 1a). However, the lowest Y(NPQ) was recorded at 90 salinity in the salinity stressed samples (Fig. 1b). This might contribute to the operation of stress response mechanisms rather than thermal dissipation. The increase of Y(NPQ) as the quantum yield at 120 salinity decreased, indicated that the photosynthetic physiology of PSII was affected and that the extra energy absorbed by the algae would be dissipated through heat. Thus, the sample treated with 90 salinity was selected for an absolute quantification analysis.

|
| Figure 1 Variation of the optimum quantum yield, Fv/Fm, effective PSII quantum yield, Y(II), and non photochemical quantum yield of PSII, Y(NPQ) in Py. haitanensis The algae were treated with high salinity, strong light. The control sample was Py. haitanensis cultured with 30 salinity and irradiation of 200 μmol photons/(m2∙s) (sample 30 salinity in Fig. 1). The data were the mean of three independent determinations (±SD). |
Similar to the results of the salinity stressed samples, the values of Fv/Fm and Y(II) decreased with increasing irradiance (Fig. 1a), especially in the algae treated with 1 200 μmol photons/(m2·s). The value of Y(NPQ) reached a maximum in the 800 μmol photons/(m2·s) treated sample. The decrease of Y(NPQ) meant a change in the regulated thermal dissipation to non-regulated energy dissipation, which denoted a loss of photoprotection to PSII. Thus, the sample under 800 μmol photons/(m2·s) was selected for an absolute quantification analysis.
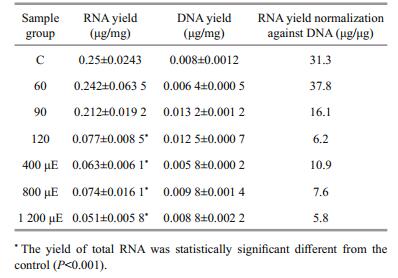
3.2 Yields of total RNA and genomic DNAGene transcript number is ideally normalized to cell number, but this approach cannot be applied to the tissues composed of multicellular mass (Bustin, 2000), therefore, it could not be used for Py. haitanensis. Normalization to the total RNA concentration has been proposed as an acceptable alternative method. Here, using a Qubit fluorometer and the corresponding RNA Assay Kit (Invitrogen Corp.), we obtained an accurate measurement of total RNA based on sample weight (Table 3). Total RNA and genomic DNA of the different stressed samples were quantified by Qubit fluorometer, and the yields were calculated based on sample weight (Table 3). For different treatment of samples, three replicates were included for the calculation of the parameter below. However, we found that the RNA yield varied among the different samples. Except for the samples treated with 60 and 90 salinity, the stress treatments usually led to the significant down-regulation of RNA transcription. In addition, the relative RNA yields were also affected more dramatically under strong light than under salinity treatments (Table 3). Thus, to find a more reliable way of normalizing the transcript numbers of the tested genes, we extracted genomic DNA using the same batch grinding algae as used in the RNA isolation and then determined the quantity. We assumed that the amount of DNA in the different tissues of a species is constant. Moreover, the samples used for DNA and mRNA extractions were ground to similar levels. To confirm the accuracy of the expression levels of the seven tested genes, their copy numbers should be normalized against the genomic DNA quantity.
The amplification specificity for the seven tested genes was determined by analyzing the dissociation curves of the PCR products. Only when a single peak was found in the dissociation curve for a gene, was the amplification of that gene deemed to be specific. At the end of every reaction cycle, the copy numbers of all the unknown samples were calculated automatically by the Bio-Rad optical system software. The E values of the seven candidate genes ranged from 0.962 for β-TUB to 1.03 for α-TUB and the correlation coefficients (R2) were from 0.992 for β-TUB to 0.998 for α-TUB and 18S rRNA.
Here, the stress treatments were divided into two sample pools and the potential internal control genes were analyzed separately. In each group, all of the candidate genes were ranked based on the M values calculated from geNorm (Fig. 2). Under salinity stress conditions, the seven tested genes presented high expression stabilities with M values of less than 1.5 (Vandesompele et al., 2002). The statistical algorithms used in the geNorm software showed that the degree of sample variation when treated with salinity was less than what treated with strong light. Under the strong light conditions, only α-TUB, β-TUB, GAPDH, and ACT belonged to the stably expressed genes.

|
| Figure 2 Expression stability of the candidate reference genes analyzed by geNorm Expression stability values (M) of the seven candidate reference genes are shown for different salinity samples and different light intensity treatment respectively. |
Based on standard curves derived from plasmids containing the test genes, the copy numbers of the candidate genes in different samples were calculated by relating threshold cycle (Ct) values to the standard curves. After normalization against the genomicDNA yield in each group, the expression levels of the tested genes in the different samples were compared (Fig. 3).

|
| Figure 3 Transcript level of tested genes under different stresses treatment in Py. haitanensis All the genes whose relative transcript level observed was between 0.5 and 2 were designated as the potential internal control genes. |
The expression levels of all of the tested genes were down-regulated in samples under salinity stress (90 salinity). The mean expression level of 18S was the highest among all of the genes, and it was stably expressed in all the samples tested here. The expression levels of RPS, EF3 and ACT under the different stresses varied greatly. GAPDH showed considerable down-regulation across all stressed samples. The expression levels of TubA and TubB had low abundance but were more stable than RPS, EF3 and ACT in the tested samples. Our results suggest that EF3 and 18S could be used as internal control genes when Py. haitanensis blades were salt-stressed and TubA, ACT and 18S were stable when Py. haitanensis blades were stressed by strong light.
3.5 Screening of potential internal control genesWhile evaluating the results from the absolute quantification and the geNorm software analysis, we found that there were some differences between these two methods. The geNorm analysis proposed all the seven tested genes can be selected as the potential internal control genes under salinity stress but only 18S and EF3 were identified with the absolute quantification. Under the strong light conditions, α-TUB, β-TUB, GAPDH, and ACT belonged to the stably expressed genes determined by the geNorm analysis and 18S, α-TUB and ACT were recommended as the internal control genes according to the absolute quantification. Considering together with the results from two methods, α-TUB and β-TUB were the best candidate reference genes under strong light stress while 18S and EF3 could be selected as the internal control genes under salinity stress in Py. haitanensis.
4 DISCUSSION 4.1 Determination of conditions for stress responses in Py. haitanensisPAM chlorophyll fluorescence is a powerful tool used to assess the macro-algal physiological state under environmental stresses (Franklin and Badger, 2001; Figueroa et al., 2003; Prasil et al., 2007). In this study, we used PAM fluorometry to evaluate the effects of stresses on Py. haitanensis. Each measurement could be completed quickly in situ (Beer and Björk, 2000), which is extremely convenient. The value of Y(II) was regarded as an indicator of the photo-inhibition levels and the value of Y(NPQ) indicated the regulated dissipation of photosynthetic energy. The closing of PSII reaction centers usually caused a decrease in Y(NPQ) (Gao and Wang, 2012). Based on PAM, the physiological status of the sample was easily and accurately identified. Some stress-response-related protective mechanisms were activated and other metabolic pathways were reduced. The expression levels of genes involved in those pathways was changed greatly through certain regulatory mechanisms. Thus, based on the results of PAM, the samples (treated with 90 salinity and 800 μmol photons/(m2·s) light intensity) with obvious stress responses were collected to perform the absolute quantification analysis.
4.2 Screening of potential internal control genes using different methodsThe method of qRT-PCR is increasingly used for the high-throughput evaluation of gene expression levels where relative quantification is estimated by normalizing target gene expression against the expression of one or two stable internal control genes. A comprehensive analysis of expression studies in the literature indicated that, in more than 90% of cases, 18S, 28S or GAPDH have been used as the single internal control gene for normalization (Suzuki et al., 2000). Ideally, the internal control gene for quantitative studies should not be influenced greatly by the conditions of the experiment. However, no single gene is stably expressed under every experimental condition and numerous studies have reported that the expression of constitutive genes can vary considerably (Schena et al., 1995; Parker and Barnes, 1999; Vaidyanathan et al., 1999; Vandesompele et al., 2002; Schmid et al., 2005). Therefore, it is crucial to verify the expression stability of a control gene under the specific experimental conditions prior to its use for normalization.
With the development of statistical analysis assisted with computer, several softwares were programmed to detect the stably expressed genes. One of them is the geNorm, which ranks the expression stability by stepwise exclusion of the gene with the highest expression stability measure—M (Vandesompele et al., 2002). Only the stability value of the tested gene is lower than 1.5 can be recommended as a potential reference gene (Vandesompele et al., 2002). GeNorm caculates the stability value through relative quantities transformed from Ct values, while the absolute quantification requires standardization.
The relative RNA yield index showed a close relationship to the photosynthetic activity in each treatment group. This meant that the responding mechanisms between different stress treatments were different and that the gene expression level under certain stresses would decrease with an increase in the degree of stress. However, the consistency between the relative RNA yield index and the photosynthetic activity indicated the validity of our results. This was very important to accurately evaluate the expression levels of the seven designated genes.
During the calculation of the stability value M of different tested genes, it was ideally to assume that the amplification efficiency is 100%. However, not all the primers and the templates quality satisfy the criteria of PCR amplification of 100%. On the other hand, the minor differences in input of mRNA will result in unacuracy of PCR product (Freeman et al., 1999). So, the different results obtained from the geNorm analysis and the absolute quantification seemed understandable. Thus, to avoid the systematical error caused by the method applied here, we took into consideration of the results from both methods and proposed that EF3 and 18S could be used as internal control genes when the Py. haitanensis blades were subjected to salinity stress, and that TubA and 18S could be used as the internal control genes when the stress was from strong light.
4.3 Determination of constitutively expressed genes under light and salt stress conditionsWe have demonstrated that the expression levels of the seven commonly used internal control genes were influenced differently by stress treatments. GAPDH, which is involved in the glycolysis pathway, is commonly used as an internal control gene. Iskandar et al. (2004) used GAPDH as a suitable control to measure gene expression in different tissues/organs of sugarcane. During the salinity-induced transition from C3 photosynthesis to CAM photosynthesis in Mesembryanthemum crystallinum, GAPDH expression was found to increase rapidly in leaf tissue (Ostrem et al., 1990). We found that, in Py. haitanensis, GAPDH expression was down-regulated to half that of the control in the stressed samples. We deduced, therefore, that GAPDH should not be used as an internal control in quantitative gene expression studies in Py. haitanensis under stress treatments.
The 18S gene was the most stable one of the seven tested genes in the absolute quantification. Recently, 18S has been proposed as the calibration gene and the present study confirms its applicability in some cases. However, the expression level of 18S was usually high due to the abundance of rRNA.
The other candidate genes which we tested in this study displayed high expression variability in different stress treatments, limiting their universal use as internal control genes in Py. haitanensis. Elongation factor was reported to be conserved in growing cells (Axelos et al., 1989), and it was related to growth, translation regulating and stress responding reaction (Dharmawardhane et al., 1991). In our determination, it showed little relative variation during the salinity treatment. Thus, it belonged to another potential internal control in future salinity stressed experiments besides 18S. In the high light stressed samples, both actin and tubulin played an essential role in cellular structure and kinetics of the cytoskeleton. Tubulin not only took part in the formation of spindle fibres and phragmoplasts, but also functioned in cellulose deposition in dividing cells (Setter and Flannigan, 2001). The variation ranges of actin and tubulin mRNA level were quite stable and could be selected as the internal control genes when the samples were subjected to high light stress.
Proper selection of the internal control gene was prerequisite for accurate transcript quantification. To investigate the subtle expression variability, Vandesompele et al. (2002) recommended the use of three control genes at least to calculate the normalization factor to decide how many control genes required. Tricarico et al. (2002) advocated measurements of the internal control gene simultaneously during qRT-PCR experiments. We had screened the stably expressed genes through the absolute quantification and the geNorm analysis. The recommended internal control genes expressed stably in both determinations. Moreover, considering the possibility of co-regulation of the genes, we suggested the use of two genes belonged to different function classes as the internal controls in qRT-PCR analysis.
5 CONCLUSIONThe relative quantification of target gene using 2-ΔΔCt method has become the most common way to characterize mRNA expression pattern, which contribute significantly to understanding physiological processes. However, none of the genes showed stable expression levels under all of the experimental conditions tested. We suggested that the most reliable internal control genes were EF3 and 18S in salinitytreated samples, and 18S and TubA under strong light conditions. The results provide a first report of reference genes selection for qRT-PCR experiments related to the stresses responses in Py. haitanensis.
6 ACKNOWLEDGMENTWe would like to thank SUN Qinghai of Haihu Seaweed Farming Company for kindly provision of experiment material.
| Axelos M, Bardet C, Liboz T, Le van Thai A, Curie C, Lescure B, 1989. The gene family encoding the Arabidopsis thaliana translation elongation factor EF-1α:molecular cloning, characterization and expression. Molecular and General Genetics MGG, 219(1-2): 106–112. Doi: 10.1007/BF00261164 |
| Beer S, Björk M, 2000. Measuring rates of photosynthesis of two tropical seagrasses by pulse amplitude modulated(PAM) fluorometry. Aquatic Botany, 66(1): 69–76. Doi: 10.1016/S0304-3770(99)00020-0 |
| Blouin N A, Brodie J A, Grossman A C, Xu P, Brawley S H, 2011. Porphyra:a marine crop shaped by stress. Trends in Plant Science, 16(1): 29–37. Doi: 10.1016/j.tplants.2010.10.004 |
| Bustin S A, 2000. Absolute quantification of mRNA using realtime reverse transcription polymerase chain reaction assays. Journal of Molecular Endocrinology, 25(2): 169–193. Doi: 10.1677/jme.0.0250169 |
| Dharmawardhane S, Demma M, Yang F, Condeelis J, 1991. Compartmentalization and actin binding properties of ABP-50:the elongation factor-1 alpha of Dictyostelium. Cell Motility and the Cytoskeleton, 20(4): 279–288. Doi: 10.1002/(ISSN)1097-0169 |
| Figueroa F L, Conde-Álvarez R, Gómez I, 2003. Relations between electron transport rates determined by pulse amplitude modulated chlorophyll fluorescence and oxygen evolution in macroalgae under different light conditions. Photosynthesis Research, 75(3): 259–275. Doi: 10.1023/A:1023936313544 |
| Franklin L A, Badger M R, 2001. A comparison of photosynthetic electron transport rates in macroalgae measured by pulse amplitude modulated chlorophyll fluorometry and mass spectrometry. Journal of Phycology, 37(5): 756–767. Doi: 10.1046/j.1529-8817.2001.00156.x |
| Freeman W M, Walker S J, Vrana K E, 1999. Quantitative RTPCR:pitfalls and potential. Biotechniques, 26(1): 112–125. |
| Gao S, Wang G, 2012. The enhancement of cyclic electron flow around photosystem I improves the recovery of severely desiccated Porphyra yezoensis (Bangiales, Rhodophyta). Oxford University Press, 63(12): 4349–4358. |
| Genty B, Briantais J M, Baker N R, 1989. The relationship between the quantum yield of photosynthetic electron transport and quenching of chlorophyll fluorescence. Biochimica et Biophysica Acta (BBA)-General Subjects, 990(1): 87–92. Doi: 10.1016/S0304-4165(89)80016-9 |
| Ginzinger D G, 2002. Gene quantification using real-time quantitative PCR:an emerging technology hits the mainstream. Experimental Hematology, 30(6): 503–512. Doi: 10.1016/S0301-472X(02)00806-8 |
| Giulietti A, Overbergh L, Valckx D, Decallonne B, Bouillon R, Mathieu C, 2001. An overview of real-time quantitative PCR:applications to quantify cytokine gene expression. Methods, 25(4): 386–401. Doi: 10.1006/meth.2001.1261 |
| Hod Y, 1992. A simplified ribonuclease protection assay. Biotechniques, 13(6): 852–854. |
| Iskandar H M, Simpson R S, Casu R E, Bonnett G D, Maclean D J, Manners J M, 2004. Comparison of reference genes for quantitative real-time polymerase chain reaction analysis of gene expression in sugarcane. Plant Molecular Biology Reporter, 22(4): 325–337. Doi: 10.1007/BF02772676 |
| Lee C, Kim J, Shin S G, Hwang S, 2006. Absolute and relative QPCR quantification of plasmid copy number in Escherichia coli. Journal of Biotechnology, 123(3): 273–280. Doi: 10.1016/j.jbiotec.2005.11.014 |
| Ostrem J A, Vernon D M, Bohnert H J, 1990. Increased expression of a gene coding for NAD:glyceraldehyde-3-phosphate dehydrogenase during the transition from C3 photosynthesis to crassulacean acid metabolism in Mesembryanthemum crystallinum. Journal of Biological Chemistry, 265(6): 3497–3502. |
| Parker R M C, Barnes N M, 1999. mRNA:detection by in situ and northern hybridization. Springer, New Yorkp.247-283. |
| Prasil O, Suggett D J, Cullen J J, Babin M, Govindjee, 2008. Aquafluo 2007:chlorophyll fluorescence in aquatic sciences, an international conference held in Nové Hrady. Photosynthesis Research, 95(1): 111–115. |
| Ragan M A, Bird C J, Rice E L, Gutell R R, Murphy C A, Singh R K, 1994. A molecular phylogeny of the marine red algae (Rhodophyta) based on the nuclear smallsubunit rRNA gene. Proceedings of the National Academy of Sciences of the United States of America, 91(15): 7276–7280. Doi: 10.1073/pnas.91.15.7276 |
| Reymond P, Weber H, Damond M, Farmer E E, 2000. Differential gene expression in response to mechanical wounding and insect feeding in Arabidopsis. The Plant Cell, 12(5): 707–719. Doi: 10.1105/tpc.12.5.707 |
| Saccomanno C F, Bordonaro M, Chen J S, Nordstrom J L, 1992. A faster ribonuclease protection assay. Biotechniques, 13(6): 846–850. |
| Schena M, Shalon D, Davis R W, Brown P O, 1995. Quantitative monitoring of gene expression patterns with a complementary DNA microarray. Science, 270(5235): 467–470. Doi: 10.1126/science.270.5235.467 |
| Schmid M, Davison T S, Henz S R, Pape U J, Demar M, Vingron M, Schölkopf B, Weigel D, Lohmann J U, 2005. A gene expression map of Arabidopsis thaliana development. Nature Genetics, 37(5): 501–506. Doi: 10.1038/ng1543 |
| Schreiber U, Schliwa U, Bilger W, 1986. Continuous recording of photochemical and non-photochemical chlorophyll fluorescence quenching with a new type of modulationfl uorometer. Photosynthesis Research, 10(1-2): 51–62. Doi: 10.1007/BF00024185 |
| Setter T L, Flannigan B A, 2001. Water deficit inhibits cell division and expression of transcripts involved in cell proliferation and endoreduplication in maize endosperm. Journal of Experimental Botany, 52(360): 1401–1408. Doi: 10.1093/jexbot/52.360.1401 |
| Suzuki T, Higgins P J, Crawford D R, 2000. Control selection for RNA quantitation. Biotechniques, 29(2): 332–337. |
| Thellin O, Zorzi W, Lakaye B, De Borman B, Coumans B, Hennen G, Grisar T, Igout A, Heinen E, 1999. Housekeeping genes as internal standards:use and limits. Journal of Biotechnology, 75(2-3): 291–295. Doi: 10.1016/S0168-1656(99)00163-7 |
| Tricarico C, Pinzani P, Bianchi S, Paglierani M, Distante V, Pazzagli M, Bustin S A, Orlando C, 2002. Quantitative real-time reverse transcription polymerase chain reaction:normalization to rRNA or single housekeeping genes is inappropriate for human tissue biopsies. Analytical Biochemistry, 309(2): 293–300. Doi: 10.1016/S0003-2697(02)00311-1 |
| Vaidyanathan R, Kuruvilla S, Thomas G, 1999. Characterization and expression pattern of an abscisic acid and osmotic stress responsive gene from rice. Plant Science, 140(1): 21–30. Doi: 10.1016/S0168-9452(98)00194-0 |
| Vandesompele J, de Preter K, Pattyn F, Poppe B, van Roy N, de Paepe A, Speleman F, 2002. Accurate normalization of real-time quantitative RT-PCR data by geometric averaging of multiple internal control genes. Genome Biology, 3(7): research0034. |
| Whelan J A, Russell N B, Whelan M A, 2003. A method for the absolute quantification of cDNA using real-time PCR. Journal of Immunological Methods, 278(1-2): 261–269. Doi: 10.1016/S0022-1759(03)00223-0 |
| Wise R P, Moscou M J, Bogdanove A J, Whitham S A, 2007. Transcript profiling in host-pathogen interactions. Annual Review of Phytopathology, 45: 329–369. Doi: 10.1146/annurev.phyto.45.011107.143944 |
| Wu X J, Niu J F, Huang A Y, Xu M L, Wang G C, 2012. Selection of internal control gene for expression studies in porphyra haitanensis (rhodophyta) at different life-history stages. Journal of Phycology, 48(4): 1040–1044. Doi: 10.1111/jpy.2012.48.issue-4 |
| Yan X H, Li L, Aruga Y, 2005. Genetic analysis of the position of meiosis in Porphyra haitanensis Chang et Zheng(Bangiales, Rhodophyta). Journal of Applied Phycology, 17(6): 467–473. Doi: 10.1007/s10811-005-2752-7 |
| Yu Y, Lee C, Kim J, Hwang S, 2005. Group-specific primer and probe sets to detect methanogenic communities using quantitative real-time polymerase chain reaction. Biotechnology and Bioengineering, 89(6): 670–679. Doi: 10.1002/(ISSN)1097-0290 |
| Zhang Q B, Li N, Liu X G, Zhao Z Q, Li Z E, Xu Z H, 2004. The structure of a sulfated galactan from Porphyra haitanensis and its in vivo antioxidant activity. Carbohydrate Research, 339(1): 105–111. Doi: 10.1016/j.carres.2003.09.015 |