 2018, Vol. 36
Institute of Oceanology, Chinese Academy of Sciences
Article Information
- ZHU Qing(祝青), LIN Jia(林佳), HONG Yuehui(洪跃辉), YUAN Lirong(袁丽蓉), LIU Jinzhong(刘金钟), XU Xiaoming(徐小明), WANG Jianghai(王江海)
- Centennial-scale records of total organic carbon in sediment cores from the South Yellow Sea, China
- Chinese Journal of Oceanology and Limnology, 36(1): 128-138
- http://dx.doi.org/10.1007/s00343-017-6215-1
Article History
- Received Aug. 11, 2016
- accepted in principle Sep. 22, 2016
- accepted for publication Nov. 10, 2016


2 Guangzhou Institute of Geochemistry, Chinese Academy of Sciences, Guangzhou 510640, China
Global carbon cycling is one of the key issues for climate change. It refers to the circulation of carbon, organic and inorganic, within and between the atmosphere, hydrosphere, biosphere, and lithosphere. Since the Industrial Revolution, anthropogenic activities have significantly altered global carbon cycling. Since the 1750s, approximately one-third of CO2 emitted by human activities may have been absorbed and fixed by the oceans (Caldeira and Duffy, 2000). The ocean is a huge carbon pool and its sediments, especially those in marginal basins, are important domains in the biogeochemical cycling of carbon (Mantoura et al., 1991). More than 80% of global organic carbon burial occurs in coastal sediment zones (Hedges and Keil, 1995). The main source of total organic carbon (TOC) in coastal seas is complicated, with a mixture of terrestrial and marine autochthonous organic matters (Gao et al., 2012). The overwhelming majority of terrestrial TOC is delivered to the coastal seas via runoff. The TOC in recent coastal sediments is a significant parameter to understand for carbon biogeochemical cycling and the influence of anthropogenic activities on the carbon cycle. Thus, to better understand the controlling mechanisms of the carbon cycle and land-sea interactions in these transitional areas, it is of great significance to further explore sedimentary TOC in marginal seas.
The Yellow Sea (YS) is a semi-enclosed marginal sea located off shore northern China, and covers an area of 3.80×10⁵ km2 with a shallow water central basin < 80 m deep. The YS is contiguous to the northern part of mainland China, which has had a large population and used to be one of the most important industrial centers in China. Over the past 100 years or more, northern China underwent various important natural and anthropogenic events, particularly the shifting of the Huanghe (Yellow) River estuary after 1855 AD and the rapid economic development since the 1970s, which aff ected TOC variations in YS sediments (Gao et al., 2012; Li et al., 2013; Wang et al., 2013).
In the last two decades, sedimentary TOC in the YS and its response to anthropogenic activities have been widely studied. Gao and Tao (2003) revealed that the properties and quantities of sedimentary TOC in the estuaries of large rivers had been considerably changed by human activities. Liu et al. (2013) reported that increasing TOC inputs in Chinese marginal seas, especially the YS, was partially caused by urbanization and dramatic energy consumption. Cai et al. (2014) reconstructed marine primary productivity, which was mainly controlled by terrestrial nutrients, based on TOC contents in sediment cores. Yang et al. (2015) suggested that the TOC contents in the central YS significantly increased after the 1950s, which could have been the result of rapid industrial and agricultural development. Liu et al. (2015a) discovered that large scale aquaculture production also increased the amount of sedimentary TOC in marine sediments.
Recently, the YS shelf areas that contain finegrained sediments, such as the Central Yellow Sea Mud (CYSM), have attracted the most attention from oceanographers due to its particular sediment sources and depositional processes (Wang et al., 2014). Previous studies have suggested that these finegrained sediment districts are important sinks for organic carbon and play a significant role in the transport and burial of TOC (Wang et al., 2007). Many studies on TOC in marine sediments have been carried out (Park and Khim, 1992; Xu, 2005); however, to date, this information is not available on a centennial resolution in the fine-grained sediments from the South Yellow Sea (SYS). In addition, the existing TOC sequences from the YS were established only on the basis of uncorrected TOC values that did not remove early diagenetic influences. Moreover, previous studies never distinguished between inert (i.e., black carbon (BC)) and labile carbon components in sedimentary TOC. In this study, the TOC contents of two sediment cores from the SYS were systematically analyzed to obtain their TOC sequences. Combined with the previous results of BC contents (Xu et al., 2018a) and a suitable model for correcting the TOC, we reconstructed centennial-scale TOC sequences in the Yellow Sea Cold Water Mass (YSCWM), which reveals the interaction between anthropogenic activities, particularly the rapid economic development since the 1960s, and natural processes.
2 MATERIAL AND METHOD 2.1 BackgroundThe SYS, separated by the Shangdong Peninsula from the YS, is a shallow shelf sea bordered by the eastern coast of China and the Korean peninsula and has a mean water depth of 44 m (Xing et al., 2011). The study area in the SYS is characterized by complex hydrodynamic conditions. Apart from the tidal eff ects, the general SYS circulation pattern is characterized by the northwestward Yellow Sea Warm Current (YSWC) that flows along the Yellow Sea Trough, and the southward flowing Yellow Sea Coastal Current (YSCC) and Korean Coastal Current (KCC) in winter (Fig. 1). A counterclockwise eddy is formed by the northward flow of the YSWC and southward flow of the YSCC. The YSWC, a branch of the Kuroshio Current (KC), is the only current carrying anomalously warm and salty water into the YS in winter, and is often identified by double warm tongues penetrating the central basin (Wang and Liu, 2009; Wang et al., 2012). In summer, the occurrence of the Yellow Sea Cold Water Mass (YSCWM) is one prominent physical phenomenon (Zhang et al., 2008), and as a result of its presence, the YSWC almost disappears. The YSCWM occurs in the central SYS at depths > 50 m, under the thermocline, and contains low dissolved oxygen and high nutrient concentration in summer (Zhang et al., 2008; Xin et al., 2015) that subsequently decays in autumn.

|
| Figure 1 Schematic map showing the location and topography of cores H43 and H44 in the South Yellow Sea The shaded areas show the distribution of mud patches at the ocean bottom with darker colors indicating finer-grained sediments in the East China Sea Shelf (Yuan et al., 2008). Yellow Sea Coastal Current=YSCC, Yellow Sea Warm Current=YSWC, Korea Coastal Current=KCC, Kuroshio Current=KC. |
The eddy generated by the YSWC and the YSCC formed oval fine-grained sediment areas in the central YS, which have attracted considerable attention regarding sediment provenance and depositional processes (Zhao et al., 1990; Park and Khim, 1992). The fine-grained sediments are mainly derived from marine autogenesis, riverine input and coastal erosion, which were determined by clay mineral assemblage analysis and geochemical data, including elemental composition, grain size, and stable carbon and nitrogen isotopes (Zhao et al., 1990; Hu et al., 2012). Among several fine-grained sediment regions in the SYS, the sediment source of our study area has been suggested to come mostly from the Huanghe River (HR) (Park and Khim, 1992; Yang and Liu, 2007). Yang and Liu (2007) reported that the fluvial input could diff use ~700 km away from the mouth of the modern HR and reach 80 m water depth. Since the channel diversion in 1855 AD, the HR estuary has shifted from the YS to the Bohai Sea. Even after the migration of the HR estuary to the Bohai Sea, it still has a significant impact on the sedimentation of the YS because of its enormous sediment discharge. Previous studies suggested that the annual sediment discharge of the HR is ~8.8×10⁸ tons and 4.5×10⁶ tons of particulate organic carbon (POC) into its estuary, where a fraction of the POC is further transported by southward flowing coastal currents and deposited in the YS (Cauwet and Mackenzie, 1993; Yang et al., 2003).
According to historical documents, the HR discharge and sediment load greatly varied over the past 100 years. The observed discharge exhibited a slightly increasing trend from 1919-1950 (Sun, 2001), a stepwise decrease during 1950-2000 (Wang et al., 2007; Cui et al., 2014; Wang et al., 2014), and a dramatic fluctuation due to a water-sediment regulation since 2002.
The location of sediment cores H43 (35°29′N, 122°58′E) and H44 (35°30′N, 122°39′E) are shown in Fig. 1; both are on a very gentle slope inclining NNE. The distance between them is about 36 km and the water depths are 68.0 m (H43) and 68.6 m (H44). The two cores were collected with a box corer on May 8, 2012 and are 50 cm long with a 10-cm internal diameter. After recovery, they were immediately sealed in clean PVC pipes and frozen onboard. Until analysis, they were kept at -20℃.
Previous grain size analysis of both sediment cores was performed on a Mastersizer 2000 laser particle analyzer (Malvern, Worcestershire, UK), and the data show that their compositions are dominated by silt (51.54%–85.04%) and mud (8.42%–44.79%), and exhibit nearly continuous sedimentation (Xu et al., 2018a). Sediment core H44 was dated by 210Pb analysis, and the results indicate an average sedimentation rate of approximately (3.1+0.2) mm/a over a period of 120 years (Xu et al., 2018a).
2.2 Analysis of total organic carbonBased on the calculated average sedimentation rate of (3.1+0.2) mm/a, subsamples were sectioned from cores H43 and H44 at an interval of 3 mm. The subsamples were freeze dried, homogenized and pulverized. Approximately 100 mg of the subsamples were weighed and put into a disposable semipermeable ceramic crucible, and were then successively treated with 3 N HCl overnight and deionized water. This process was repeated six times to remove carbonates, remaining inorganic carbon and residual HCl. After that, the crucibles were freeze dried. The TOC of carbonate-free subsamples were measured using a CS230 C/S analyzer (LECO, Michigan, USA) at the Guangzhou Institute of Geochemistry, Chinese Academy of Sciences. The detection limit in the study was (2.3+0.3) μg TOC per 100 mg sample (Xu et al., 2018b).
2.3 Correction of TOC in sediment coresThe early diagenesis of TOC occurs as a result of decomposition and microbial oxidation (including biochemical, geochemical and microbial processes) of the organic matters (Lehmann et al., 2002; Alongi et al., 2012). It is especially evident in subsurface sediments and gradually weakens with depth and time (Turnewitsch et al., 2007). When TOC is used as an organic geochemical proxy to reconstruct a centennialscale sequence, it is particularly important to consider the role of diagenesis in altering the geochemical record of environmental change because of its greater degradation rates over this period. Thus, a modified Middelburg's time-dependent model, integrating the 2G and power models (Middelburg, 1989), was applied to correct the TOC in our study.
In the modified Middelburg's time-dependent model, TOC was divided into labile organic carbon (OC) and inert BC (2G model), and only the labile OC was put into the power model. In the power model, the first-order kinetic equation for the decomposition of labile OC and its rate parameter are expressed:
 (1)
(1) (2)
(2)where Ct is the concentration of labile OC at time t; k is a rate parameter and represents the reactivity of labile OC, which gradually decreases with time t; a represents the apparent initial age and is introduced to distinguish the reactivity of labile OC at the sediment surface under diff erent circumstances (Middelburg, 1989; Boudreau and Ruddick, 1991).
After integration and simplification, the first-order kinetic equation for the decomposition of labile OC is:
 (3)
(3)where C0 is the initial concentration of labile OC at the sediment-water interface. The parameter a represents the reactivity of labile OC at the sediment surface and the extent of labile OC alteration during transportation from the overlying water column to sediment. Thus, with higher a values, larger proportions of labile OC would have been decomposed during sedimentation (Middelburg, 1989; Boudreau and Ruddick, 1991; Arndt et al., 2013).
The initial labile OC content (sediment surface) and the average labile OC content of the upper sediments in the TOC sequences were used to obtain the average a value for each sediment core. Assuming steady organic carbon export from the water column to sediments, a can be determined by substituting these two labile OC values and their corresponding t into Eq.3. Finally, the C0 value of each subsample was obtained after substituting the known a value of each core into Eq.3.
2.4 Measurement of stable carbon isotope ratiosThe carbonate-free subsamples were also used to analyze TOC stable carbon isotope ratios (δ13C) by using an elemental analyzer coupled to an isotope ratio mass spectrometer (EA-IRMS) at the Laboratory of Bioorganic Geochemistry, School of Marine Sciences, Sun Yat-Sen University using the method described in Xu et al. (2018a). The standard deviation of the analysis and the deviation between the measured data and predetermined data were +0.2‰. The δ13C values were expressed as:
 (4)
(4)where Rsam and Rsta are the 13C/12C ratios of the sample and Vienna PeeDee Belemnite (V-PDB) standard (Coplen et al., 2006), respectively.
2.5 Correction of stable carbon isotope ratiosThere has been a historic depletion of the heavy carbon isotope in the atmosphere due to the mixture of CO2 derived by fossil fuel consumption that contains a low level of 13C and no 14C; this is called the Suess eff ect (Keeling, 1979). It is necessary to correct for the Suess eff ect in the application of δ13C values as a geochemical proxy (Verburg, 2007). We used Schelske and Hodell's polynomial equation (Schelske and Hodell, 1995) to correct the δ13C data:
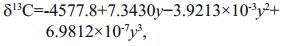 (5)
(5)where y is time in chronological years. The calculated depletion in the δ13C value since 1840 AD was subtracted from the measured δ13C value for each sample.
2.6 River discharge dataThe annual runoff discharge data of the HR were acquired from 'Hydrological Data of the Yellow River Basin' and 'Yellow River Water Resources Bulletin', compiled by the Yellow River Conservancy Commission (http://www.yellowriver.gov.cn/other/hhgb/). The HR annual runoff was measured at the Lijin hydrometric station, the nearest station to its estuary.
3 RESULT 3.1 TOC variationsThe measured TOC (TOCmea) ranges from 0.77% to 1.18% with a mean of 0.88%+0.09% in core H43, while in core H44 it ranges from 0.77% to 1.41% with mean of 0.92%+0.08% (Tables S1, S2; Fig. 2a, c). The corrected TOC (TOCcor), containing inert BC (Xu et al., 2018a) and the corrected labile OC, are presented in Tables S1 and S2 as well as Fig. 2b and d. In the TOCcorrection, the modified, age-dependent Middelburg model yields a values of 31.06 yrs and 31.47 yrs for cores H43 and H44, respectively. The TOCcor fluctuates between 0.90% and 1.21% (mean=1.05%+0.07%) in core H43 and from 0.85% to 1.41% (mean=1.11%±0.13%) in core H44 (Tables S1, S2). As shown in Fig. 2, there is a gradually decreasing trend in the TOCcor of H43 from 1891 to 1966 and a slightly increasing trend from 1966 to 2010, whereas in H44 the TOCcor exhibits an overall decreasing trend. Moreover, a minima in core H44 occurs from 1960 to 1971, which is nearly coeval with that of a trough for core H43 (1955-1970).

|
| Figure 2 Sequences of TOCmea and TOCcor in sediment cores H43 and H44 |
The δ13C values of TOC in H43 range from -23.82‰ to -22.41‰ (Table S3) with a mean of -22.95‰+0.22‰ (Fig. 3a), while the δ13C values for H44 vary from -24.35‰ to -21.99‰ with a mean of -22.75‰+0.35‰ (Fig. 3b). The vertical distribution of the corrected δ13C (δ13Ccor) values in H43 and H44 take into account the Suess eff ect (Fig. 3). The δ13Ccor values of H43 and H44 vary from -21.24‰ to -23.24‰ (mean=-22.29‰) and -20.47‰ to -23.28‰ (mean=-22.08‰), respectively. Cores H43 and H44 possess similar δ13Ccor sequences with an overall increasing trend from the bottom to the top (Fig. 3), but the δ13Ccor values in H43 are lower than H44.

|
| Figure 3 δ13Ccor sequences of sedimentary TOC in (a) H43 and (b) H44 |
The TOC contents of sediments are usually measured by a conventional method, such as acidifying samples to remove carbonate and then determining their TOC (Hu et al., 2013). Thus, the TOC data are generally not high quality because of the relatively low and fluctuating TOC recovery during the acidification procedure. In this study, the TOC contents of H43 and H44 were determined with an improved method (Xu et al., 2018b) in which the TOC loss was fully eliminated because no recovery process was involved. Therefore, our TOC data (Table S1) are high quality.
To establish the initial TOC sequences, the TOCmea data needs to be corrected, so the assessment of correction models is a key step. Recently, correction models are either discrete models (further subdivided into 1G-, 2G-, and multi-G models) (Hammond et al., 1996; Meysman et al., 2005; Holstein and Wirtz, 2009) or continuum models (power and reactive continuum models) (Middelburg, 1989; Wehrmann et al., 2013). G-type models are widely used to investigate shallow subsurface processes with constant apparent organic matter degradability at depth, but are unable to reproduce the widely observed continuous decrease in the TOC degradability with sediment depth (Middelburg and Meysman, 2007). As the continuum models are not directly accessible by observations only, they are better suited to study TOC diagenetic dynamics at tempo-spatial scales (Arndt et al., 2013). To date, more than 250 studies have suggested that the power and 2G models are suitable to correct TOC for early diagenesis in the SYS (Arndt et al., 2013). In this study, we regarded the labile TOC as a whole (in fact, it can be further subdivided), which was then used in a power model.
It should be noted that the correction of BC is negligible on centennial scales because the BC produced by the incomplete combustion of various fuels is biologically unavailable and inert (Masiello and Druff el, 1998; Schmidt and Noack, 2000). Thus, we only corrected the labile TOC (Baldock and Smernik, 2002; Cheng et al., 2006). Our newly obtained TOCcor data (Tables S1, S2) are consistent with previously reported TOCmea values in surface sediments of the SYS (Table 1).
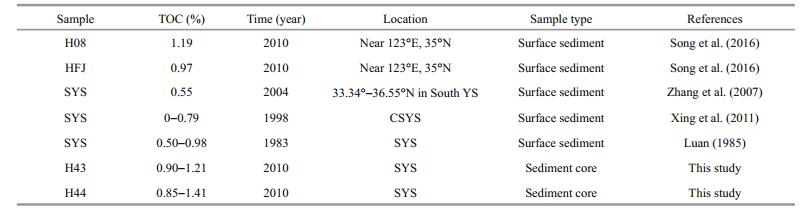
The systematic TOC measurements for H43 and H44 indicate that the TOCmea fluctuate between 0.77% and 1.41%. This range is similar to published data from the central SYS, but is higher than in the coastal regions (Xing et al., 2011; Mei et al., 2016).
It has been reported that a spring bloom of phytoplankton occurs in the central SYS near the 35°N transect (Liu et al., 2015). For the SYS, where sedimentary dynamics cause most of the terrestrial coarse-grained particles to deposit in coastal areas, only fine-grained particles are transported to the central part. The fine-grained particles that can adsorb more TOC to accumulate in the vortex center and deposit in the central SYS due to the movement of the vortex (Hu et al., 2011).
The YSWC is a dramatic phenomenon of the YS circulation in winter/early spring and the YSCWM is unique to summer. Thus, the nutrient concentrations increase in winter and are then either followed by increases in salinity/temperature from intrusion of the YSWC, or originated from mixing of nutrientenriched bottom water from the YSCWM during the previous summer and fall (Jin et al., 2013; Liu et al., 2015). In addition, weak stratification combined with rising irradiance and temperature increases the residence time and growth rate of phytoplankton within the upper layer, which enhances the spring phytoplankton productivity in the central SYS (Xuan et al., 2011; Tang et al., 2013). Depletion of limited nutrients, such as nitrogen and phosphorus, in the euphotic zone terminates the spring bloom in the central SYS in early summer (Jin et al., 2013). Moreover, the fine-grained sediments contribute to anaerobic or hypoxic conditions with a low redox potential (Eh) (He et al., 2009). Therefore, in the lowoxygen central SYS, the abundant POC generated by spring blooms in the SYCWM, and trapped by finegrained particles from the HR, are deposited. This is the reason why sedimentary TOC in our study area is higher than those in the coastal districts.
4.3 Calculation of terrigenous and marine autogenous TOCSediments in marginal seas receive TOC from both terrestrial and marine sources. Previous studies utilized the C/N ratio and their stable carbon isotopic composition as indicators for distinguishing marine and terrestrial TOC sources. However, C/N ratios are easily altered by selective degradation of organic matters, particularly compounds rich in N, during diagenesis, but the stable carbon isotopic composition of TOC remains relatively stable (Nijenhuis and de Lange, 2000; Gao et al., 2012). Thus, we preferred to use the δ13C values to determine TOC sources.
Before estimating the contents of terrigenous and marine autogenous TOC in H43 and H44, we needed to determine the end-member δ13C values and suitable models. There is a consensus thatδ13C values typically range from -22‰ to -18‰ for marine phytoplankton (Ramaswamy et al., 2008), -22‰ to -33‰ for C3 land plants, and about -13‰ for C4 land plants (Pancost and Boot, 2004). Therefore, we adopted -19‰ and -26.5‰ as the end-member δ13C values for marine and terrigenous TOC, respectively (Cai et al., 2003). A two end-member model (Calder and Parker, 1968) was employed to calculate the percentages of marine and terrigenous TOC in this study. The proportion of the terrestrial TOC (fter) was estimated by:
 (6)
(6)TOCter in the cores is expressed as:
 (7)
(7)Thus, fmar and TOCmar are obtained by:
 (8)
(8) (9)
(9)Based on the equations, TOCter and TOCmar were obtained (Fig. 4). The TOCter in H43 and H44 range from 0.31% to 0.66% and 0.17% to 0.79%, respectively, and display a decreasing trend with time. In contrast, the TOCmar in H43 and H44 are 0.45%-0.81% and 0.56%-0.79%, respectively, and exhibit a slowly increasing trend from the bottom to the top. Several studies found that the TOCter in the YS decrease with distance from the HR estuary (e.g., Yang et al., 2015), but no TOCter or TOCmar data were shown. Our newly obtained data support this finding. The TOCmar slowly increased in both H43 and H44, which may be attributed to the input of terrestrial nutrients and the maintenance of a stable YSCWM. In addition, the TOCter dramatically fluctuated since 2002, which might have resulted from the annual water-sediment regulation (Bi et al., 2014). Moreover, the TOCmar in H43 and H44 have evidently increased since the late 1960s (Fig. 4), reflecting an enhancement of human activities, such as fertilizer use and sewage discharge (Cai et al., 2014; Yang et al., 2015), and/or global warming.

|
| Figure 4 Variations in TOCter and TOCmar in (a and b) H43 and (c and d) H44 |
Linear correlation analysis was used to describe the correlation between the TOC in H43 and H44 and the annual discharge/sediment load of the HR. The results demonstrate that there is a negative correlation between annual discharge and the TOCcor in core H43 (R2=0.450 1; Fig. 5a) and no correlation in H44 (R2=0.044 1; Fig. 5d). However, moderately positive correlations between annual discharge and the TOCter in H43 (R2=0.168 9; Fig. 5b) and H44 (R2=0.228 0; Fig. 5e) were found. Yet, a strongly negative correlation is apparent between annual discharge and the TOCmar in H43 (R2=0.575 1; Fig. 5c), while only a moderately negative correlation (R2=0.326 6; Fig. 5f) is observed in H44. There is no correlation between the TOC in the two cores and sediment load of the HR (figures not shown), or between TOCter and sediment load. However, there is a positive relationship between the TOCter and the discharge. These correlations indicate that the terrestrial TOC in the cores was mainly derived from the HR and transported as suspended load by coastal currents rather than coarse particles. In addition, the negative correlation between TOCmar and discharge suggests that greater amounts of discharge may deliver more dissolved oxygen that enhance TOCmar decomposition.

|
| Figure 5 Correlation between the annual discharges of the HR (×1010 m3) and various TOC values (%) |
The centennial-scale sequences of TOCcor, TOCter and TOCmar were determined from two sediment cores from the YSCWM area in the SYS. The stepwise decrease of discharge with time in the HR can strongly influence TOCter contents, and the input of terrestrial nutrients can enhance TOCmar in a stable YSCWM environment. The positive correlation between TOCter and annual discharge indicates that the terrestrial TOC in the cores is mainly derived from the HR and transported as suspended load by coastal currents rather than coarse particles. The negative correlation between TOCmar and discharge suggests that higher discharge strengthens TOCmar decomposition because of increased dissolved oxygen contents.
6 ACKNOWLEDGEMENTWe would like to thank the National Meteorological Information Center of the People's Republic of China for providing the precipitation data in the reaches of the Huanghe River.
Electronic supplementary materialSupplementary material (Supplementary Tables S1–S3) is available in the online version of this article athttps://doi.org/10.1007/s00343-017-6215-1.
| Alongi D M, Wirasantosa S, Wagey T, Trott L A, 2012. Early diagenetic processes in relation to river discharge and coastal upwelling in the Aru Sea, Indonesia. Marine Chemistry, 140-141: 10–23. Doi: 10.1016/j.marchem.2012.06.002 |
| Arndt S, Jørgensen B B, LaRowe D E, Middelburg J J, Pancost R D, Regnier P, 2013. Quantifying the degradation of organic matter in marine sediments:a review and synthesis. Earth-Science Reviews, 123: 53–86. Doi: 10.1016/j.earscirev.2013.02.008 |
| Bi N S, Yang Z S, Wang H J, Xu C J, Guo Z G, 2014. Impact of artificial water and sediment discharge regulation in the Huanghe (Yellow River) on the transport of particulate heavy metals to the sea. CATENA, 121: 232–240. Doi: 10.1016/j.catena.2014.05.006 |
| Boudreau B P, Ruddick B R, 1991. On a reactive continuum representation of organic matter diagenesis. American Journal of Science, 291(5): 507–538. Doi: 10.2475/ajs.291.5.507 |
| Cai D L, Shi X F, Zhou W J, Liu W G, Zhang S F, Cao Y N, Han Y B, 2003. Sources and transportation of suspended matter and sediment in the southern Yellow Sea:evidence from stable carbon isotopes. Chinese Science Bulletin, 48(S1): 21–29. Doi: 10.1007/BF02900936 |
| Cai D L, Sun Y, Zhang X Y, Su Y F, Wu Y H, Chen Z H, Yang Q, 2014. Reconstructing a primary productivity history over the past 200 a using the sediment organic carbon content and the stable isotope composition from the East China Sea and the Yellow Sea. Acta Oceanologica Sinica, 36(2): 40–50. |
| Caldeira K, Duffy P B, 2000. The role of the Southern Ocean in uptake and storage of anthropogenic carbon dioxide. Science, 287(5453): 620–622. Doi: 10.1126/science.287.5453.620 |
| Calder J A, Parker P L, 1968. Stable carbon isotope ratios as indexes of petrochemical pollution of aquatic systems. Environmental Science & Technology, 2(7): 535–539. |
| Cauwet G, Mackenzie F T, 1993. Carbon inputs and distribution in estuaries of turbid rivers:the Yang Tze and Yellow rivers (China). Marine Chemistry, 43(1-4): 235–246. Doi: 10.1016/0304-4203(93)90229-H |
| Coplen T B, Brand W A, Gehre M, Gröning M, Meijer H A J, Toman B, Verkouteren R M, 2006. New guidelines for δ13C measurements. Analytical Chemistry, 78(7): 2 439–2 441. Doi: 10.1021/ac052027c |
| Cui B L, Chang X L, Shi W Y, 2014. Abrupt changes of runoff and sediment load in the lower reaches of the Yellow River, China. Water Resources, 41(3): 252–260. Doi: 10.1134/S009780781403004X |
| Gao Q Z, Tao Z, 2003. Advances in studies on transported flux and properties of riverine organic carbon. Chinese Journal of Applied Ecology, 14(6): 1 000–1 002. |
| Gao X L, Yang Y W, Wang C Y, 2012. Geochemistry of organic carbon and nitrogen in surface sediments of coastal Bohai Bay inferred from their ratios and stable isotopic signatures. Marine Pollution Bulletin, 64(6): 1 148–1 155. Doi: 10.1016/j.marpolbul.2012.03.028 |
| Hammond D E, McManus J, Berelson W M, Kilgore T E, Pope R H, 1996. Early diagenesis of organic material in equatorial Pacific sediments:stpichiometry and kinetics. Deep Sea Research Part Ⅱ:Topical Studies in Oceanography, 43(4-6): 1 365–1 412. Doi: 10.1016/0967-0645(96)00027-6 |
| He Z P, Song J M, Zhang N X, Zhang P, Xu Y Y, 2009. Variation characteristics and ecological risk of heavy metals in the south Yellow Sea surface sediments. Environmental Monitoring and Assessment, 157(1-4): 515–528. Doi: 10.1007/s10661-008-0552-7 |
| Hedges J I, Keil R G, 1995. Sedimentary organic matter preservation:an assessment and speculative synthesis. Marine Chemistry, 49(2-3): 81–115. Doi: 10.1016/0304-4203(95)00008-F |
| Holstein J M, Wirtz K W, 2009. Sensitivity analysis of nitrogen and carbon cycling in marine sediments. Estuarine, Coastal and Shelf Science, 82(4): 632–644. Doi: 10.1016/j.ecss.2009.02.008 |
| Hu B Q, Yang Z S, Zhao M X, Saito Y, Fan D J, Wang L B, 2012. Grain size records reveal variability of the East Asian Winter Monsoon since the Middle Holocene in the Central Yellow Sea mud area, China. Science China Earth Sciences, 55(10): 1 656–1 668. Doi: 10.1007/s11430-012-4447-7 |
| Hu L M, Lin T, Shi X F, Yang Z S, Wang H J, Zhang G, Guo Z G, 2011. The role of shelf mud depositional process and large river inputs on the fate of organochlorine pesticides in sediments of the Yellow and East China seas. Geophysical Research Letters, 38(3): L03602. |
| Hu L M, Shi X F, Guo Z G, Wang H J, Yang Z S, 2013. Sources, dispersal and preservation of sedimentary organic matter in the Yellow Sea:the importance of depositional hydrodynamic forcing. Marine Geology, 335: 52–63. Doi: 10.1016/j.margeo.2012.10.008 |
| Jin J, Liu S M, Ren J L, Liu C G, Zhang J, Zhang G L, Huang D J, 2013. Nutrient dynamics and coupling with phytoplankton species composition during the spring blooms in the Yellow Sea. Deep Sea Research Part Ⅱ:Topical Studies in Oceanography, 97: 16–32. Doi: 10.1016/j.dsr2.2013.05.002 |
| Keeling C D, 1979. The Suess effect:13carbon-14carbon interrelations. Environment International, 2(4-6): 229–300. Doi: 10.1016/0160-4120(79)90005-9 |
| Lehmann M F, Bernasconi S M, Barbieri A, McKenzie J A, 2002. Preservation of organic matter and alteration of its carbon and nitrogen isotope composition during simulated and in situ early sedimentary diagenesis. Geochimica et Cosmochimica Acta, 66(20): 3 573–3 584. Doi: 10.1016/S0016-7037(02)00968-7 |
| Li G G, Hu B Q, Bi J Q, Leng Q N, Xiao C Q, Yang Z C, 2013. Heavy metals distribution and contamination in surface sediments of the coastal Shandong Peninsula (Yellow Sea). Marine Pollution Bulletin, 76(1-2): 420–426. Doi: 10.1016/j.marpolbul.2013.08.032 |
| Liu L Y, Wei G L, Wang J Z, Guan Y F, Wong C S, Wu F C, Zeng E Y, 2013. Anthropogenic activities have contributed moderately to increased inputs of organic materials in marginal seas off China. Environmental Science & Technology, 47(20): 11 414–11 422. |
| Liu S, Huang J S, Yang Q, Yang S, Yang G P, Sun Y, 2015a. Burial fluxes and source apportionment of carbon in culture areas of Sanggou Bay over the past 200 years. Acta Oceanologica Sinica, 34(10): 23–30. Doi: 10.1007/s13131-015-0724-6 |
| Liu X, Huang B Q, Huang Q, Wang L, Ni X B, Tang Q S, Sun S, Wei H, Liu S M, Li C L, Sun J, 2015b. Seasonal phytoplankton response to physical processes in the southern Yellow Sea. Journal of Sea Research, 95: 45–55. Doi: 10.1016/j.seares.2014.10.017 |
| Luan Z F, 1985. Characteristics of organic geochemistry of sediments in northern part of the south huanghai sea. Oceanologia et Limnologia Sinica, 16(1): 93–100. |
| Mantoura R F C, Martin J M, Wollast R, 1991. Ocean Margin Processes in Global Change. John Wiley and Sons Ltd, Chichester. |
| Masiello C A, Druffel E R M, 1998. Black carbon in deep-Sea sediments. Science, 280(5371): 1 911–1 913. Doi: 10.1126/science.280.5371.1911 |
| Mei X, Li R H, Zhang X H, Liu Q S, Liu J X, Wang Z B, Lan X H, Liu J, Sun R T, 2016. Evolution of the Yellow sea warm current and the Yellow Sea cold water mass since the middle Pleistocene. Palaeogeography, Palaeoclimatology, Palaeoecology, 442: 48–60. Doi: 10.1016/j.palaeo.2015.11.018 |
| Meysman F J R, Boudreau B P, Middelburg J J, 2005. Modeling reactive transport in sediments subject to bioturbation and compaction. Geochimica et Cosmochimica Acta, 69(14): 3 601–3 617. Doi: 10.1016/j.gca.2005.01.004 |
| Middelburg J J, 1989. A simple rate model for organic matter decomposition in marine sediments. Geochimica et Cosmochimica Acta, 53(7): 1 577–1 581. Doi: 10.1016/0016-7037(89)90239-1 |
| Middelburg J J, Meysman F J, 2007. Ocean science. Burial at sea. Science, 316(5829): 1 294–1 295. Doi: 10.1126/science.1144001 |
| Nijenhuis I A, de Lange G J, 2000. Geochemical constraints on Pliocene sapropel formation in the eastern Mediterranean. Marine Geology, 163(1-4): 41–63. Doi: 10.1016/S0025-3227(99)00093-6 |
| Pancost R D, Boot C S, 2004. The palaeoclimatic utility of terrestrial biomarkers in marine sediments. Marine Chemistry, 92(1-4): 239–261. Doi: 10.1016/j.marchem.2004.06.029 |
| Park Y A, Khim B K, 1992. Origin and dispersal of recent clay minerals in the Yellow Sea. Marine Geology, 104(1-4): 205–213. Doi: 10.1016/0025-3227(92)90095-Y |
| Ramaswamy V, Gaye B, Shirodkar P V, Rao P S, Chivas A R, Wheeler D, Thwin S, 2008. Distribution and sources of organic carbon, nitrogen and their isotopic signatures in sediments from the Ayeyarwady (Irrawaddy) continental shelf, northern Andaman Sea. Marine Chemistry, 111(3-4): 137–150. Doi: 10.1016/j.marchem.2008.04.006 |
| Schelske C L, Hodell D A, 1995. Using carbon isotopes of bulk sedimentary organic matter to reconstruct the history of nutrient loading and eutrophication in Lake Erie. Limnology and Oceanography, 40(5): 918–929. Doi: 10.4319/lo.1995.40.5.0918 |
| Schmidt M W I, Noack A G, 2000. Black carbon in soils and sediments:analysis, distribution, implications, and current challenges. Global Biogeochemical Cycles, 14(3): 777–793. Doi: 10.1029/1999GB001208 |
| Song G D, Liu S M, Zhu Z Y, Zhai W D, Zhu C J, Zhang J, 2016. Sediment oxygen consumption and benthic organic carbon mineralization on the continental shelves of the East China Sea and the Yellow Sea. Deep Sea Research Part Ⅱ:Topical Studies in Oceanography, 124: 53–63. Doi: 10.1016/j.dsr2.2015.04.012 |
| Sun G S, 2001. The Yellow River Water Resources Management. The Yellow River Conservancy Press, Zhengzhou, China. |
| Tang Q S, Su J L, Zhang J, Tong L, 2013. Spring blooms and the ecosystem processes:the case study of the Yellow Sea. Deep Sea Research Part Ⅱ:Topical Studies in Oceanography, 97: 1–3. Doi: 10.1016/j.dsr2.2013.05.007 |
| Turnewitsch R, Domeyer B, Graf G, 2007. Experimental evidence for an effect of early-diagenetic interaction between labile and refractory marine sedimentary organic matter on nitrogen dynamics. Journal of Sea Research, 57(4): 270–280. Doi: 10.1016/j.seares.2006.08.001 |
| Verburg P, 2007. The need to correct for the Suess effect in the application of δ13C in sediment of autotrophic Lake Tanganyika, as a productivity proxy in the Anthropocene. Journal of Paleolimnology, 37(4): 591–602. Doi: 10.1007/s10933-006-9056-z |
| Wang F, Liu C Y, 2009. An N-shape thermal front in the western South Yellow Sea in winter. Chinese Journal of Oceanology and Limnology, 27(4): 898–906. Doi: 10.1007/s00343-009-9045-y |
| Wang F, Liu C Y, Meng Q J, 2012. Effect of the Yellow Sea warm current fronts on the westward shift of the Yellow Sea warm tongue in winter. Continental Shelf Research, 45: 98–107. Doi: 10.1016/j.csr.2012.06.005 |
| Wang F, Zhao G J, Mu X M, Gao P, Sun W Y, 2014. Regime shift identification of runoff and sediment loads in the yellow river basin, China. Water, 6(10): 3 012–3 032. |
| Wang H J, Yang Z S, Saito Y, Liu J P, Sun X X, Wang Y, 2007. Stepwise decreases of the Huanghe (Yellow River) sediment load (1950-2005):impacts of climate change and human activities. Global and Planetary Change, 57(3-4): 331–354. Doi: 10.1016/j.gloplacha.2007.01.003 |
| Wang Y J, Liu D Y, Richard P, Li X, 2013. A geochemical record of environmental changes in sediments from Sishili Bay, northern Yellow Sea, China:anthropogenic influence on organic matter sources and composition over the last 100 years. Marine Pollution Bulletin, 77(1-2): 227–236. Doi: 10.1016/j.marpolbul.2013.10.001 |
| Wehrmann L M, Arndt S, März C, Ferdelman T G, Brunner B, 2013. The evolution of early diagenetic signals in Bering Sea subseafloor sediments in response to varying organic carbon deposition over the last 4. 3 Ma. Geochimica et Cosmochimica Acta, 109: 175–196. Doi: 10.1016/j.gca.2013.01.025 |
| Xin M, Ma D Y, Wang B D, 2015. Chemicohydrographic characteristics of the Yellow Sea Cold Water Mass. Acta Oceanologica Sinica, 34(6): 5–11. Doi: 10.1007/s13131-015-0681-0 |
| Xing L, Tao S Q, Zhang H L, Liu Y G, Yu Z G, Zhao M X, 2011. Distributions and origins of lipid biomarkers in surface sediments from the southern Yellow Sea. Applied Geochemistry, 26(8): 1 584–1 593. Doi: 10.1016/j.apgeochem.2011.06.024 |
| Xu J X, 2005. The water fluxes of the Yellow River to the sea in the past 50 years, in response to climate change and human activities. Environmental Management, 35(5): 620–631. Doi: 10.1007/s00267-004-3094-y |
| Xu X M, Hong Y H, Zhou Q Z, Liu J Z, Yuan L R, Wang J H, 2018a. Century-scale high-resolution black carbon records in the sediment cores from the South Yellow Sea, China. Journal of Oceanology and Limnology, 36(1): 115–127. Doi: 10.1007/s00343-017-6214-2 |
| Xu X M, Zhu Q, Zhou Q Z, Liu J Z, Yuan J P, Wang J H, 2018b. An improved method for quantitatively measuring the sequences of total organic carbon and black carbon in marine sediment cores. Journal of Oceanology and Limnology, 36(1): 105–114. Doi: 10.1007/s00343-017-6229-8 |
| Xuan J L, Zhou F, Huang D J, Wei H, Liu C G, Xing C X, 2011. Physical processes and their role on the spatial and temporal variability of the spring phytoplankton bloom in the central Yellow Sea. Acta Ecologica Sinica, 31(1): 61–70. Doi: 10.1016/j.chnaes.2010.11.011 |
| Yang S, Yang Q, Liu S, Cai D L, Qu K M, Sun Y, 2015. Burial fluxes and sources of organic carbon in sediments of the central Yellow Sea mud area over the past 200 years. Acta Oceanologica Sinica, 34(10): 13–22. Doi: 10.1007/s13131-015-0723-7 |
| Yang S Y, Jung H S, Lim D I, Li C X, 2003. A review on the provenance discrimination of sediments in the Yellow Sea. Earth-Science Reviews, 63(1-2): 93–120. Doi: 10.1016/S0012-8252(03)00033-3 |
| Yang Z S, Liu J P, 2007. A unique Yellow River-derived distal subaqueous delta in the Yellow Sea. Marine Geology, 240(1-4): 169–176. Doi: 10.1016/j.margeo.2007.02.008 |
| Yuan D L, Zhu J R, Li C Y, Hu D X, 2008. Cross-shelf circulation in the Yellow and East China Seas indicated by MODIS satellite observations. Journal of Marine Systems, 70(1-2): 134–149. Doi: 10.1016/j.jmarsys.2007.04.002 |
| Zhang P, Song J M, Liu Z G, Zheng G X, Zhang N X, He Z P, 2007. PCBs and its coupling with eco-environments in Southern Yellow Sea surface sediments. Marine Pollution Bulletin, 54(8): 1 105–1 115. Doi: 10.1016/j.marpolbul.2007.05.005 |
| Zhang S W, Wang Q Y, Lü Y, Cui H, Yuan Y L, 2008. Observation of the seasonal evolution of the Yellow Sea Cold Water Mass in 1996-1998. Continental Shelf Research, 28(3): 442–457. Doi: 10.1016/j.csr.2007.10.002 |
| Zhao Y Y, Qin Z Y, Li F Y, Chen Y W, 1990. On the source and genesis of the mud in the central area of the south Yellow Sea. Chinese Journal of Oceanology and Limnology, 8(1): 66–73. Doi: 10.1007/BF02846453 |