 2018, Vol. 36
Institute of Oceanology, Chinese Academy of Sciences
Article Information
- GUO Jie(过杰), JI Diansheng(纪殿胜), HOU Chawei(侯查伟), GUO Kai(郭凯), JI Ling(纪灵)
- Impact of tropical cyclone Matmo on mixed zone of the Yellow and Bohai Seas
- Chinese Journal of Oceanology and Limnology, 36(5): 1484-1493
- http://dx.doi.org/10.1007/s00343-018-7085-x
Article History
- Received Mar. 17, 2017
- accepted in principle Jun. 7, 2017
- accepted for publication Sep. 11, 2017


2 Yantai Marine Environmental Monitoring Central Station, State Oceanic Administration(SOA), Yantai 264006, China
The mixed zone of the Yellow Sea and Bohai Sea (Y-B) is the gateway to the Bohai Sea and the Yellow Sea in the area of 120°–124°E in longitude, which is an ideal breeding ground for wildlife, containing more than 210 types of abundant seafood, and over 1.2 million individuals of 320 species of migratory bird visit the area annually. Furthermore, each year, this habitat supports nearly 400 Pacific leopard seals. Consequently, China has designated the Y-B a national nature reserve and a provincial seal reserve. Therefore, any significant change in regional marine physical parameters could have considerable influence on this important regional ecological environment. The two principal marine hydrological features of the Yellow Sea are the Yellow Sea warm current (YSWC) and the northern Yellow Sea cold water mass (NYSCWM). Their impact on the ecological environment of the Y-B can be significant under certain conditions.
The YSWC (Fig. 1a) and Yellow Sea (western) flow constitute a cyclonic circulation. To some extent, the YSWC exhibits the characteristics of a compensation flow. The northwesterly wind field of the winter monsoon causes the coastal current to increase, resulting in strengthening of the YSWC. In summer, the coastal flow is weak because of the effect of the summer (SE) monsoon, which results in a weaker YSWC. The YSWC is restricted mainly to the upper mixed layer and the lower layer is limited by the NYSCWM (low temperature and high salinity). The stronger the YSWC is in winter, the stronger the NYSCWM is during the following summer (Bao et al., 2001).

|
| Figure 1 Path of the YSWC (Guo et al., 2016) (a) and planar distributions of temperature (℃) (left) and salinity (right) at the bottom in summer (Bao et al., 2009) (b) |
The spatial extent of the NYSCWM in summer 2006 and 2007 is clearly visible if the 8℃ temperature contour is considered its boundary (Fig. 1b_left). It has a cold center in the middle of the basin, and its average salinity is 32.2 (Fig. 1b_right). It can be seen that the trough of the NYSCWM has NW–SE alignment within the area 37.0°–38.9°N, 121.3°– 124.0°E (Bao et al., 2009; Li et al., 2013a) and that it covers more than half the entire study area (Fig. 2a).

|
| Figure 2 The study area (ABCD) and the TC path (red arrow line), SAR cover area (EFGH), and the observation points (blue dots) (a); and the wind field retrieved by RADARSAT-2 at 18:18.64 LT on July 25, 2014; the color bar shows wind speed scale and direction (arrows) (b) |
The Bohai Sea and adjacent northern Yellow Sea area are at latitudes sufficiently far north that they are infrequently affected by tropical cyclones (TCs). Only 88 TCs have approached this area during 1960– 2013. Fifteen TC centers crossed into the Bohai Sea, representing 17.0% of the total with average frequency of one TC every 3.6 years. The paths of 19 TCs have traversed the northern Yellow Sea, representing 21.6% of the total with average frequency of one every 2.8 years (Wen et al., 2016). Because the Bohai Sea is a low-lying semi-enclosed sea area with a shallow offshore seabed, TCs that track north toward the region can cause serious marine-meteorological disasters. Typhoon Matmo made landfall on the coast of Taiwan Island on July 23, 2014 at 00:15 local time (LT), with maximum wind speeds of 42 m/s near its center. The typhoon was downgraded to a TC when it made landfall at Rongcheng in Shandong Province (China) at 17:10 LT on July 25, 2014 and the lowest pressure in the center is 993 hPa. At that time, the maximum wind speeds near its center were 20 m/s (Fig. 2b). Studies of the distributions and evolutions of the physical parameters of TCs are important for understanding the hydrodynamic environment of the Y-B, air-sea interactions, ecological element distribution, and water exchange between the Bohai Sea and the open sea.
The remainder of this article is organized as follows. In Section 2, an overview of the methods used to retrieve sea state and wind parameters from remote sensing, buoys, and other measured data is provided, and the method for the retrieval of wind speeds from the RADARSAT-2 scene is introduced. Section 3 presents the results and discussion on the wind field forms based on the subsequent analysis by comparing RADARSAT-2, HY2-2A, ASCAT with Buoy 1 data. The retrieval of remote sensing data is described and the buoy data are analyzed. Section 4 shows the conclusions.
2 DATA AND METHOD 2.1 DataRemote sensing observations have been used widely in studies of typhoons (Friedman and Li, 2000; Li et al., 2002, 2013b; Li, 2015). This study used sea surface temperature (SST), salinity (SAL), and chlorophyll concentration (CHL) derived from MODIS data; however, to reduce the effects of cloud, monthly averaged SST and CHL data from MODISL3/ Terra in 9-km resolution were used (http://oceancolor.gsfc.nasa.gov/cgi/l3). For the wind field retrieval, HY2-2A, Ascat_L2 data and C-band CrossPolarization data collected by Canada's RADARSAT-2, were used. The wind energy density was obtained from HY2-2A data. The Chinese HY-2 satellite was designed for the measurement of dynamic ocean environment parameters using a microwave scatterometer, altimeter and radiometer. It was launched on 16 August 2011 and the frequency of the scatterometer was 13.256 GHz.
The ASCAT is one of the instruments that carried on-board Meteorological Operational (MetOp) polar satellites launched by the European Space Agency (ESR) and operated by the European organization for the exploitation of Meteorological Satellites (EUMETSAT). ASCAT was launched on 19 October 2006 in C band in frequency at 5.255 GHz. The wind products of ASCAT are distributed in two resolutions at 50 km in 25-km grid (Guo et al., 2015).
In this study, a part of the wind field, wind energy density (P=0.5ρV3), significant wave height (H1/3), SST, SAL, and CHL of the Y-B were analyzed using Buoy 1 (37.54°N, 122.01°E) to the left of TC track and Buoy 2 (38°N, 123.50°E) on the TC track data (Fig. 2a). Other data used in this study comprised seasonal observations of the Bohai Sea and the Y-B obtained during the cruises of the R/V Xiang Yang Hong 8, which were supported by the Strategic Priority Research Program of Chinese Academy of Sciences. Data were collected at 120 observation stations and at specific locations in the Bohai Sea and the Y-B during August 11 to September 6, 2014, at depths of 0–50 m (Fig. 2a, blue dots).
The area of interest in this study constituted a rectangular region of orange line in Fig. 2a (Guo et al., 2016) located near the Y-B, defined by the following coordinates: A (37.5°N, 120.0°E), B (37.5°N, 124.0°E), C (39.0°N, 124.0°E), and D (39.0°N, 120.0°E). The red line in Fig. 2a indicates the typhoon track and the black rectangle denotes the area of RADARSAT-2 coverage.
2.2 MethodThe real-time wind field was retrieved from the RADARSAT-2, HY2_2A and ASCAT_L2 data. The C-band Cross-Polarization Ocean Backscatter (C-2PO) model (Zhang and Perrie, 2012, 2014; Zhang et al., 2014a; Mai et al., 2016) relates the normalized radar cross section in cross polarization (VH) to wind speed at 10-m height. The wind direction was retrieved by CMOD5.N, and the initial direction of the wind was obtained from the Buoy1 data. The time hourly average and daily average data from the buoys and some daily average wind speed data from HY2- 2A were compared. The average monthly SST and SAL from the MODIS data from 2004 to 2013, and the real-time position measurement data were analyzed statistically using grid interpolation to determine the extent of the effect of TCs on the Y-B.
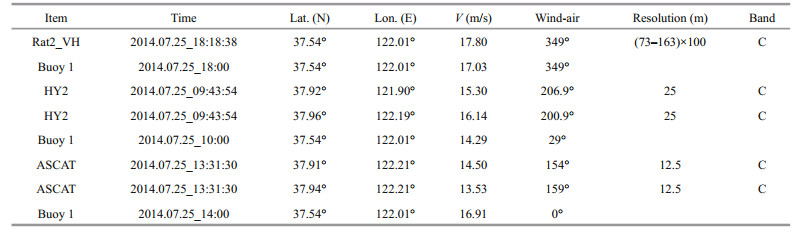
3 RESULT AND DISCUSSION 3.1 Influence of T-Cs on the Y-BThe wind velocity retrieved by RADARSAT-2 (2014.07.25 18:18:38), HY2-2A (2014.07.25 09:43:54) and ASCAT_L2 (2014.07.25 13:31:30) were compared with Buoy 1 data for the same time (Table 1). The maximum spatial and temporal differences between RARDARSAT-2 (Rat2), HY2-2A and ASCAT observation data and buoy data measurement are 0.25° and 0.5 h, respectively. We found that the wind speed (V) derived from the RADARSAT-2 (VV/VH) real-time data using the C-2PO model (Zhang and Perrie, 2012) was in a good agreement (RMS=1.96 m/s) with the real-time Buoy 1 data (Table 1). This shows that the C-2PO model inversion was effective under conditions of high wind speeds. The wind direction retrieval by CMOD5.N and the initial direction of the wind from Buoy1 data are shown in Fig. 2b. The wind speed retrieved by HY2-2A and ASCAT were 15.3 and 16.1 m/s (Buoy 1_V: 14.29 m/s), and 14.5 and 13.53 m/s (Buoy 1_V: 16.91 m/s), respectively (Table 1). We found that the wind velocity retrieved by RADARSAT-2 was the closest to the wind speed measured by Buoy 1 and the wind velocity retrieved by HY2-2A was greater than the wind speed measured by Buoy 1. The ASCAT's was smaller than the wind speed measured by Buoy 1. Because of the proximity to the shore, the direction of the wind retrieved by HY2-2A and ASCAT are different from that of the Buoy 1.
|
Figure 3a shows that the highest average value of V recorded was 17.3 m/s at 17:00 LT at Buoy 1 on July 25, 2014 (there were no data recorded by Buoy 2 during 17:00–23:00 LT, and at 10:00 and 12:00 LT on July 25, 2014. Because the Buoy 2 on the path of the TC, the strong wind and waves caused automatically to stop working for 9 h). At Buoy 1, H1/3 increased gradually to 2.3 m from 00:00 to 19:00 LT and decreased slowly from 20:00 to 23:00 LT and the maximum H1/3 is up to 2 h behind the maximum wind speed. It is different from the conclusion of Zhuang et al. (2013) that the maximum H1/3 is up to 3–4 h behind the maximum wind speed during the typhoon. The H1/3 data of Buoy 2 were greater than Buoy 1 during 00:00–16:00 LT (Fig. 3b) and H1/3 varied with wind speed of Buoy 2 faster than Buoy 1. The SST at Buoy 1 decreased rapidly to 17.82℃ from 00:00 to 10:00 LT, and it then maintained with a relatively stable value from 11:00 to 23:00 LT. The SST at Buoy 2 showed a gradual decline from 00:00 to 16:00 LT, but it was consistently greater than at Buoy 1 at similar times (Fig. 3c). We found that the SST measured by Buoy 1 dropped about 4℃ and Buoy 2 dropped for only less than 1℃ from 00:00 to 9:00 LT. This is because the carrying volume effect of TC and water depth location of the Buoy 1 is less than the Buoy 2. This finding is consistent with Xu and Su (2007): when pressure is higher than 980 hPa, the depth of the sea water is between 0 and 100 m and SST maximum change is 3.9℃. The SAL maintained a relatively stable value of 30.00 from 00:00 to 07:00 LT. It then increased rapidly to 30.45 from 08:00 to 10:00 LT before decreasing sharply to 29.95 from 10:00 to 12:00 LT because of rain (Fig. 3e, f). It then increased abruptly to 30.52 from 12:00 to 16:00 LT, and it remained relatively stable to 23:00 LT. Overall, Buoy 1 SAL exhibited an increasing trend, whereas Buoy 2 showed a declining trend from 00:00 to 16:00 LT, but it remained consistently higher than Buoy 1 at similar times (Fig. 3d). The middle North Yellow Sea can be divided into two parts demarcated by 123°E line. The western part features low temperature (< 22℃) and low salinity (< 30.8), while in the eastern part, high temperature (24–25℃) and high salinity (31.2–31.8) (Bao et al., 2009). We found that the temperature and salinity measured by Buoys 1 and 2 accords with the features, while the salinity measurement by the buoys was lower than that of Bao et al. (2009). The rain rate data in Fig. 4a is taken from Windsat data. We found that there was a 5–10-mm/h rainfall at 17:07 LT nearby Buoy 1 and Buoy 2. The humidity measured by Buoy 1 kept rising from 8:00 to 11:00 then stayed at 99% from 11:00 to 17:00 (Fig. 4b), and then followed by an overall downward trend from 17:00 to 23:00. We found that the humidity stayed above 90% exclusive of 23:00. In general, the salinity increased with depth in the study area. The above-mentioned analysis can determine that the salinity decrease at Buoy 1 from 10:00 to 12:00 was caused by precipitation on July 25, 2014.

|
| Figure 3 Buoy 1 and Buoy 2 data on July 25, 2014 a. V; b. H1/3; c. SST; d. SAL. |

|
| Figure 4 Rain rate retrieved by Windsat data at 17:07 LT 2014-Jul-25 (a) and the humidity measured by Buoy 1 (b) |
From July 17 to August 2, 2014 (Fig. 5a, b, d), the values of V, SAL, and H1/3 reached their maxima; however, the minimum SST occurred on July 25, 2014 (Fig. 5c), and SAL also reached the minimum with a 3-day lag because of raining (Fig. 5d). As wind suction and carrying volume effect caused by upwelling of deep cold water decreased the SST and SAL had a small increase on July 25, 2014 (Liu et al., 2011). There was a 1-4-mm/h rainfall in average between July 26 to 28 (data from http://www.remss.com/measurements/rain-rate). We found that H1/3, SST, and SAL of Buoy 2 were higher than data of Buoy 1. The SST and SAL change accords with the basic law of Bao et al. (2009) as shown in Fig. 5c and d.

|
| Figure 5 Buoy 1 and Buoy 2 data from July 17 to August 2, 2014 a. V; b. H1/3; c. SST; d. SAL. |
Figure 6 shows that the average SST (CHL) retrieved by MODIS data in the study area in July 2014 was less (more) than at the same time of year during 2004–2013. This was because the air-sea interaction and winds caused mixing of the NYSCWM, which led to both a rapid fall in SST and an increase in nutrient supply. The flow of the YSWC into the Bohai Sea during winter of this year was enhanced (Li, 2015), which meant that the presence of the NYSCWM in the northern Yellow Sea was strengthened in the following summer (Jiang et al., 2007). Based on the analysis of many years' remote sensing data and validation by measured data. Guo et al. (2016) determined that the YSWC into the Bohai Sea was strong in the winter of 2013; therefore, the NYSCWM in the summer of 2014 should be also wider and stronger.

|
| Figure 6 Average SST (CHL) in June, July, and August 2014 compared with the average SST (CHL) in July 2004– 2013 |
We found that the average values of V measured by Buoy 1, Buoy 2, and HY2 (average V of HY2 within the study area) on July 25, 2014 were more than twice of that measured on July 24, 2014 (Fig. 7a). However, the resultant wind energy densities of Buoys 1 & 2, and HY2 data on July 25, 2014 were 7–8 times greater than that of July 24, 2014 (Fig. 7b). Based on the comparison of Buoy 1 and remote sensing data, it was apparent that the area had been affected significantly by the TC.

|
| Figure 7 Average V (m/s) on July 24–26, 2014 derived from Buoys 1 & 2, and HY2 data (a), and the mean wind energy density on July 24–26, 2014 derived from Buoys 1 & 2, and HY2 data (b) |
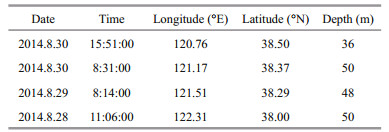
To understand the impact of TCs on the Y-B, profile data from four sites (Table 2) along the red line shown in Fig. 8a were obtained at six layers from 0 to 50 m. The SAL and SST of the profiles are shown in Fig. 8b and 8c, respectively. A SAL inversion layer was found at 38.37°N, 121.51°E, at the depth of nearly 20 m. At this point, the SST changed from 8.8℃ to 10.0℃ and the SAL changed from 31.35 to 31.45. We found that the highest surface SAL from July 17 to August 2, 2014, was 31.00 at Buoy 2. Figure 9a shows that the dissolved oxygen of the study area was >5 mg/L and the CHL of the surface and subsurface waters was ≥2 μg/L (Fig. 9b). The average value of V at Buoy 2 was no more than 8 m/s from August 3–31, 2014 (Fig. 10). Therefore, it is suggested that the SAL inversion layer was caused by the NYSCWM.

|
| Figure 8 Observation sites, red line is analyze data (a), and SAL (b) and SST (c) profiles based on measured data in the Y-B from August 12 to September 6, 2014 |

|
| Figure 9 Observation sites, red line is analyze data (a), and oxygen (b) and CHL (c) profiles based on measured data in the Y-B from August 12 to September 6, 2014 |

|
| Figure 10 V measured by Buoy 2 from August 3–31, 2014 |
Buoy 2 was located in the northern Yellow Sea and Buoy 1 was near the Bohai Sea strait. The SST and SAL of Buoy 2 were greater than at Buoy 1, but the SST decreased rapidly and SAL declined gradually with a three-day lag when the TC passed though the study area (Fig. 5c, d). It was established that the main reason for this was raining, which agrees with Sheng et al. (2016). Another reason was air-sea interaction and mixing. Figure 8 reveals a SAL inversion near 38.29°N, 121.17°E (Fig. 8a), where SAL was between 31.35 and 31.45 (Fig. 8b) and SST was between 8.6℃ and 10℃ (Fig. 8c). On the right side of the SAL inversion layer at the bottom, the lowest SST was only about 8° (Fig. 8c) and SAL was only 31.5 (Fig. 8b).
Stratification in the central Bohai Sea in August hinders vertical convection and thus, the temperature of the surface water is high and that of bottom water is low. We found that the dissolved oxygen content (5.04 mL/L) at the surface was higher than at the bottom (4.75 mL/L) (Cui et al., 1993). As shown in Fig. 9b, the values of dissolved oxygen content at the surface (6 mL/L) and bottom (5 ml/L) in August 2014 were higher than corresponding values reported by Cui et al. (1993).
The values of CHL of the surface, middle, and bottom waters of the Bohai Sea in the summer of 2000 were 2.10±1.4, 1.65±1.48, and 1.57±1.28 μg/L, respectively, with an average of 1.82±1.39 μg/L and a range of 0.44–7.11 μg/L (Guo, 2005). The surface CHL of the Bohai strait in the summer of 2001 was measured at 0.643 μg/L (Zhao et al., 2004). From Fig. 9c, we determined that the CHL was >6 μg/L at depths of 5–25 m and that the surface CHL was higher than 0.643 μg/L (Zhao et al., 2004). The CHL was between 0 and 1 μg/L at depths below 25 m, and the values of CHL were lowest at the bottom on the east and west sides of the area.
4 CONCLUSIONThe maximum V near the center of the TC was about 20 m/s, which increased the wind energy density within the study area of the Y-B by up to 7 or 8 times, and transported NYSCWM at the depth of 50 m into the Y-B and caused vertical mixing of the seawater. Shallow water SST changes faster than deep water during TC, and the SST change in the TC path does not vary from the left side of TC on the sea. The site profile data show that the TC caused a rise in SST, and it lowered SAL and dissolved oxygen at the NYSCWM position. This was one of the most important factors behind the observed SST cooling on July 25, 2014 and the higher than the average value (2004-2013) of CHL in July derived from the remote sensing data. It also caused an increase in SAL on July 25, 2014, which then quickly decreased to the minimum over the following three days by rainfall. The high V of the TC brought a heavy rainfall. The SAL inversion layer in the Y-B during August 28-30, 2014, as shown in the SST, SAL, CHL, and dissolved oxygen profiles, was considered indicative of the transport of the NYSCWM into the Y-B by the TC. There was about average 5 m/s wind speed and less than 0.1 mm/h rainfall during July 29 to August 30 (data from http://www.remss.com). Because of the regional rapid changes in SST and SAL, losses of 800 million Yuan were incurred by the Zhangzi Island mariculture (http://finance.ifeng.com/a/20141031/13237407_0.shtml). The strong NYSCWM and TC caused dramatic changes in the Y-B ecological environment and affected the regional aquaculture. Our contention is that should the number of TCs affecting the study area increase because of global climate warming, then resultant changes in the NYSCWM could have serious impact on the regional Y-B ecological environment. Further research is needed to establish the mechanism behind the formation of the SAL inversion layer, and to determine comprehensively the influence of TCs on the NYSCWM.
5 ACKNOWLEDGMENTWe acknowledge the Rain Rate from Remote Sensing Systems, www.remss.com/storm-watch. Data production is sponsored by NASA Earth Science. The SOAR-EI Project RADARSAT-2 Data and Products of MacDonald, Dettwiler, and Associates Ltd. (Year of acquisition from June 2014 to June 2016)—all rights reserved. RADARSAT is the official trademark of the Canadian Space Agency.
Bao X W, Li N, Yao Z G, Wu D X. 2009. Seasonal variation characteristics of temperature and salinity of the North Yellow Sea. Periodical of Ocean University of China, 39(4): 553-562.
(in Chinese with English abstract) |
Bao X W, Wang C Z, Gao G P, Hung L. 2001. Thermal structural analysis and simulation of the Bohai Sea and the Huanghai Seas. Acta Oceanologica Sinica, 23(6): 24-31.
(in Chinese with English abstract) |
Cui Y, Song Y L, Yang Q F, Yu H. 1993. The temporal and spatial variation of dissolved oxygen and the relationship between phytoplankton and environmental factors in Bohai Sea. Marine Fisheries Research, (14): 113-118.
(in Chinese with English abstract) |
Friedman K S, Li X F. 2000. Monitoring hurricanes over the ocean with wide swath SAR. Johns Hopkins University APL Technical Digest, 21(1): 80-85.
|
Guo J, He Y J, Long X, Hou C W, Liu X, Meng J M. 2015. Repair wind field in oil contaminated areas with SAR images. Chinese Journal of Oceanology and Limnology, 33(2): 525-533.
DOI:10.1007/s00343-015-3242-7 |
Guo J, Zhang H, Cui T W, He Y J, Zhang J, Guo K, Hou C W, Liu R J. 2016. Remote sensing observations of the winter Yellow Sea Warm Current invasion into the Bohai Sea, China. Advances in Meteorology, 2016: Article ID 8170296.
|
Guo Q. 2005. Features in Distributions of Nutrients and Chlorophyll and Eutrophication Assessment in the Bohai Sea in Summer. Master Thesis, China Ocean University, Qingdao. p.67. (in Chinese with English abstract)
|
Jiang B J, Bao X W, Wu D X, Xu J P. 2007. Interannual variation of temperature and salinity of northern Huanghai Sea Cold Water Mass and its probable cause. Acta Oceanologica Sinica, 29(4): 1-10.
(in Chinese with English abstract) |
Li X B, Sun X Y, Zhang Q F, Niu F X, Yao Z G. 2013a. Seasonal evolution of the Northern Yellow Sea cold water mass. Marine Science Bulletin, 15(2): 15-24.
|
Li X F, Pichel W G, He M X, Wu S Y, Friedman K S, ClementeColon P, Zhao C F. 2002. Observation of hurricanegenerated ocean swell refraction at the Gulf Stream north wall with the RADARSAT-1 synthetic aperture radar. IEEE Transactions on Geoscience and Remote Sensing, 40(10): 2131-2142.
DOI:10.1109/TGRS.2002.802474 |
Li X F, Zhang J A, Yang X F, Pichel W G, DeMaria M, Long D, Li Z W. 2013b. Tropical cyclone morphology from spaceborne synthetic aperture radar. Bulletin of the American Meteorological Society, 94(2): 215-230.
DOI:10.1175/BAMS-D-11-00211.1 |
Li X F. 2015. The first Sentinel-1 SAR image of a typhoon. Acta Oceanologica Sinica, 34(1): 1-2.
DOI:10.1007/s13131-015-0589-8 |
Liu L, Fei J F, Lin X P, Zhang L B, Ling C Q, Huang X G, Cheng X P. 2011. Effect of air-sea interaction on Typhoon Kaemi. Chinese Journal of Atmospheric Sciences, 35(3): 444-456.
(in Chinese with English abstract) |
Mai M R, Zhang B, Li X F, Hwang P A, Zhang J A. 2016. Application of AMSR-E and AMSR2low-frequency channel brightness temperature data for hurricane wind retrievals. IEEE Transactions on Geoscience and Remote Sensing, 54(8): 4501-4512.
DOI:10.1109/TGRS.2016.2543502 |
Sheng C Y, Fan S D, Liu S J, Xia F, Rong Y M. 2016. The Matmo typhoon forecast test by Shandong WRF ensemble forecast system. Shandong Weather, 36(1): 1-7.
(in Chinese with English abstract) |
Su J, Li L, Bao X W, Gao G P. 2001. Numerical experiment of SST response to typhoon process in Yellow Sea and Bohai Sea. Journal of Ocean University of Qingdao, 31(2): 165-172.
(in Chinese with English abstract) |
Wen L J, Liu G Y, Liu Q R, Ruan C Q, Wang B. 2016. Statistical analysis of tropical cyclones which affected the Bohai Sea during 1960-2013. Ocean Development and Management, 33(8): 84-89.
(in Chinese with English abstract) |
Xu W L, Su J. 2007. The impact of typhoons on sea surface temperature in the western North Pacific Ocean. Periodical of Ocean University of China, 37(Sup. Ⅱ): 17-22.
(in Chinese with English abstract) |
Zhang B, Perrie W, Zhang J A, Uhlhorn E W, He Y J. 2014a. High resolution hurricane vector winds from C-band dual-polarization SAR observations. Journal of Atmospheric and Oceanic Technology, 31(2): 272-286.
DOI:10.1175/JTECH-D-13-00006.1 |
Zhang B, Perrie W. 2012. Cross-polarized synthetic aperture radar:a new potential measurement technique for hurricanes. Bulletin of the American Meteorological Society, 93(4): 531-541.
DOI:10.1175/BAMS-D-11-00001.1 |
Zhang B, Perrie W. 2014. Recent progress on high wind-speed retrieval from multi-polarization SAR imagery:a review. International Journal of Remote Sensing, 35(11-12): 4031-4045.
DOI:10.1080/01431161.2014.916451 |
Zhang G S, Zhang B, Perrie W, Xu Q, He Y J. 2014b. A hurricane tangential wind profile estimation method for C-band cross-polarization SAR. IEEE Transactions on Geoscience and Remote Sensing, 52(11): 7186-7194.
DOI:10.1109/TGRS.2014.2308839 |
Zhao Q, Tian J W, Zhao S L, Wu Z K. 2004. Winter and summer chlorophyll a and nutrient distribution and characteristics in the Bohai Sea. Marine Science, 28(4): 34-39.
(in Chinese with English abstract) |
Zhuang H B, Gao R Q, Fan W L. 2013. Characteristics of the waves in the effect of tropical cyclone. Meteorological Hydrological and Marine Instrument, 30(2): 30-34.
|