 2018, Vol. 36
Institute of Oceanology, Chinese Academy of Sciences
Article Information
- Omondi DONDE Oscar, TIAN Cuicui(田翠翠), XIAO Bangding(肖邦定)
- Integrated site-specific quantification of faecal bacteria and detection of DNA markers in faecal contamination source tracking as a microbial risk tracking tool in urban Lake ecosystems
- Chinese Journal of Oceanology and Limnology, 36(5): 1629-1642
- http://dx.doi.org/10.1007/s00343-018-7107-8
Article History
- Received Apr. 7, 2017
- accepted in principle Jun. 14, 2017
- accepted for publication Aug. 10, 2017


2 International College, University of Chinese Academy of Sciences, Beijing 100049, China;
3 Egerton University, Department of Environmental Science, P. O. Box 536-20115, Egerton-Kenya
Freshwater ecosystems are some of the readily available sources of drinking water (United Nation Environmental Management Program [UNEP], 2001). Freshwater lakes are the most predominant forms of surface freshwater systems, they are essential drinking water sources and support many domestic and agricultural activities (Pimentel et al., 2004; Kaoga et al., 2013; Donde et al., 2015). Donghu Lake located at 30°33'N, 114°23'E within Wuhan City in China is a shallow freshwater lake of about 33 km2 in surface area. Being the largest urban lake in China, Donghu Lake is extremely and increasingly being exposed to pollution by numerous urban related human activities, such as the discharge of semi-treated industrial and domestic wastes and wastewaters (Liu et al., 2006; Tian et al., 2015). Every Public and environmental health protection agency has a responsibility of ensuring the safety of water sources by making sure that they are free of pathogenic bacteria (United State Environmental Protection Agency (U.S.E.P.A.), 2000; Public Health England (PHE), 2014; Donde, 2017). Drinking water sources have continued to diminish due to climate change (U.S. Global Change Research Program (USGCRP), 2016). Additionally, the quality of this valuable resource is under a huge threat due continuous rise in contamination by human and/or animal faeces (Donde et al., 2015). The presence of faecal-derived pathogenic microorganisms (bacteria, virus, protozoa) in water and other aquatic organisms is responsible for several infectious diseases and numerous deaths worldwide (WHO, 2005, 2003; Donde et al., 2014). Among the pathogens disseminated in water sources, enteric pathogens are the ones most frequently encountered (Jahne et al., 2016). As a consequence, sources of fecal pollution in waters devoted to human activity must be strictly controlled. However, this exercise has remained challenging due to the existing overlapping characteristics by different members of faecal coliform bacteria (Yamazaki and Fukasawa, 2011). For example, few E. coli strains possess biochemical characteristics very similar to those of Shigella, this makes it difficult to accurately determine pollution levels and track the source of faecal contamination based on chemical characteristics of a specific faecal bacterial indicator group (Quirós et al., 2015).
Techniques such as Polymerase Chain Reaction (PCR) have become important tools for rapid detection of faecal bacteria. Indeed, E. coli and other faecal pathogens can now be detected by targeting genes such as: lacZ, uidA and cyd. (Quirós et al., 2015). The introduction of real-time Quantitative PCR (Q-PCR) has facilitated more rapid, specific and quantitative enumeration of gene targets as they are amplified in real-time (Jenkins et al., 2012). The major challenge at the present is difficulty in incorporating these techniques into faecal contamination source tracking across different aquatic ecosystems due to possible insufficient E. coli specificity or insufficient universality across E. coli strains. Therefore, studies have focused on improving the faecal contamination source tracking techniques such as Microbial Source Tracking (MST) (Reischer et al., 2013). Main aim of MST technique has been to attribute water contamination to fecal source hosts in a defined geographic region in which key water locations are periodically tested. Molecular targets of fecal bacteria dominate the current MST mode and are often tested using different approaches (Ohad et al., 2015). However, seasonality and weather variability has been proven to pose greater influence on the accuracy and detection limit of MSTs (Chase et al., 2012). This study aims to contribute to further understanding and modification of faecal contamination source tracking by evaluating the efficacy of combining site specific quantification of indicator bacteria and detection of DNA markers in tracking the major origin and source of faecal contamination in a freshwater system (Donghu Lake, in Wuhan, China) while considering the weather and seasonality variations. It also looks into the contributions by different kinds of media (selective and non-selective) as well as Bovine Serum Albumin (BSA) in giving more accurate and reliable results. The study forms part of an effort to ensure 100% detection efficiencies of faecal pollution sources for quicker, timely and efficient faecal pollution control measures.
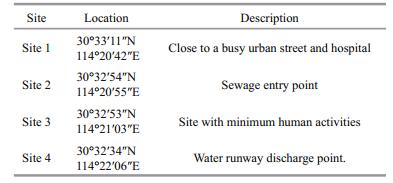
2 MATERIAL AND METHOD 2.1 SamplingWater samples were aseptically obtained in triplicate at 15 cm depth below the water surface from four selected sites with varying anthropogenic influences within Donghu Lake; Site 1 (30°33'11″N and 114°20'42″E), Site 2 (30°32'54″N and 114°20'55″E), Site 3 (30°32'53″N and 114°21'03″E) and Site 4 (30°32'34″N and 114°22'06″E) (Table 1 and Fig. 1) from May 2016 to February 2017. In situ measurements of temperature, pH and dissolved oxygen (DO) were conducted using a YSI ProODOTM handheld dissolved oxygen meter (USA). Data on weather condition were accessed from the weather station nearest to the Lake (Wuhan weather station). Sampling and sample storage followed the regulations by APHA (2005). The sterilized bottles were aseptically filled up with the samples and stored in a cool box with ice and transported to the Key Laboratory of Algal Biology at the Institute of Hydrobiology of the Chinese Academy of Science in Wuhan for appropriate analyses.

|
| Figure 1 Map of China showing position of Donghu Lake and sampling sites |
Water samples were subjected to Membrane Filtration Technique (MFT), Polymerase Chain Reaction (PCR), real time Quantitative-PCR (qPCR) and DNA sequencing to determine the quantities and dominant members of faecal bacteria contamination indicators at different sites and times within the lake and to track possible sources of contamination.
2.2.1 Membrane Filtration Technique (MFT)MFT for total coliforms and E. coli abundances followed guidelines outlined in American Public Health Association (APHA) (2005) and Public Health England (PHE), (2014). This was done within 6-24 h after sampling to avoid changes in bacteria count due to growth or die off. Aseptic techniques were observed in all the analyses. The selective Chromocult Coliform Agar (Merck) was used to prepare the media following the manufacturers instruction. About 26 grams of the agar was dissolved in 1 L and heated until all the agar dissolved (Clear solution). The medium was cooled to around 50℃ and poured into plates. Aseptic filtration was done separately for each water sample dilutions by passing the sample through a membrane filter (47 mm diameter, 0.45 μm pore size) on a filtration unit. The filter was then lifted off using a pair of forceps and placed onto the surface of the culture media (in the plate) and incubated at 37℃ for 24 h. Counting of coliform bacteria was based on its ability to produce β-D- galactosidase, an enzyme which is characteristic of coliform bacteria, to cleave the substrate Salmon-GAL. With the reaction results being salmon red colored coliform bacteria colonies. Counting of E. coli was based on the cleavage of both the substrates X-glucuronide by s-D-glucoronidase and Salmon-GAL by β-D-galactosidase, an enzyme combination, which is characteristic of E. coli. In the presence of E. coli both substrates are cleaved, resulting in colonies that take on a dark blue to violet color as opposed to the salmon red of other coliform bacteria colonies (PHE, 2014).
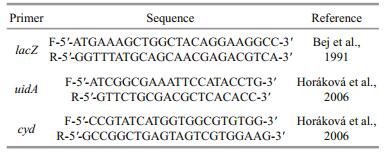
2.2.2 PCR and real-time qPCRBacterial DNA was extracted from the water samples using EZNA water DNA kits (Omega, America). For each water samples, DNA was extracted and analyzed separately. Primers targeting the functional genes; LacZ specific for total coliforms, uidA specific for E. coli + other faecal coliforms and cyd specific for E. coli were used to quantify the total coliforms, faecal coliforms and E. coli. Primers of qPCR was designed based on the known specific primers from literature (Table 2). The amplification of qPCR products was carried out using a real time PCR detector (Bio-Rad, America) with SYBR Green I as a signal dye. Conditions of PCR amplification were as follows: initial denaturation at 94℃ for 3 min, and 34 cycles with denaturation at 94℃ for 30 s, annealing at 58℃ for 30 s s and extension at 72℃ for 30 s. PCR amplification was performed in a 20-μL reaction volumes containing 10 μL iTaq universal SYBR Green Supermix (Bio-Rad, America), 7 μL of double distilled water, 1 μL of both forwards and reverse primers and 1 μL template (sample). All samples were analysed in triplicate. A final melting curve analysis was performed to check the specificity of the amplification reaction.
Standards of qPCR were generated by PCR using the appropriate primers. PCR amplification products were analysed by electrophoresis in an agarose gel in 0.5×Tris-borate-EDTA (TBE) buffer to check for the specificity of the amplification. After confirmation by agarose gel electrophoresis, the PCR products were cloned into pMD18-T vector (TaKaRa, Japan). BLAST analysis was then used to check primer specificity to the target sequences. Positive clones were separated and subjected to plasmid DNA extraction using AxyPrep plasmid mini pre-kits (Axygen, China). Circular plasmids were then digested with Barma HI (TaKaRa, Japan). 10 folds' dilution series of plasmid DNA of concentration ranging from 109 to 103 copies/μL were used to generate the standard curve of qPCR. Standards were measured in triplicate and each standard curve was checked for validity by R2 value and amplification efficiency (E). The number of target total coliforms population/concentration was then normalized by the DNA concentration quantified gene copies/1 000 mL water, as outlined in Lee et al. (2006).
2.2.3 Phylogenetic identification of dominant faecal coliform members based on selective and nonselective mediaPour plate technique was used to grow colonies for taxonomic identification of faecal coliforms. The samples were stored under 4℃ prior to analyses. Aseptic technique was observed at all stages. Chromocul Coliform Agar (Merk) was used as selective media to isolate colonies of faecal coliforms while Lysogeny Broth (LB) media was used as nonselective media for general bacterial colony growth. The plates were stored at 37℃ for 24 h. Representative colonies from each plate (10 colonies/plate) were randomly chosen and subjected to PCR using Primers (27F: 5'-GAGTTTGATCCTGGCTCAG-3' and 1492R: 5'-GGTTACCTTACGACTT-3') to amplify 16S rRNA gene. PCR amplification was performed in a 20-μL reaction volumes containing 9 μL iTaq universal SYBR Green Supermix (Bio-Rad, America), 9 μL double distilled water, 1 μL of both forwards and reverse primers and template (sample) inoculated using sterilized toothpick tip. The PCR was done under the following conditions: 34 cycles at 94℃ for 5 min, 94℃ for 60 s, 55℃ for 60 s and 72℃ for 2 min (Wang et al., 2009; Li et al., 2014). 1% Agarose gel electrophoresis was run to test the specificity of the amplification. The positive PCR products were then sent for sequencing at Wuhan ICONGENE biotechnology company at the Institute of hydrobiology, Chinese Academy of Science, Wuhan, China. The 16S rRNA gene sequences from selected colonies were analyzed using Basic Local Alignment Tool (BLAST) at the National Centre for Biotechnology Information (NCBI) website. Isolates were presumptively identified according to the identity of the closest cultured relative in the top BLAST hits. The 16S rRNA gene sequences of all the selected colonies and their closest reference sequences were applied for phylogenetic analysis using Mega 5 software package (Li et al., 2014). The sequences were then aligned using the positional tree server with a data set containing the nearest relative matches. Trees were constructed using the neighbor joining algorithm.
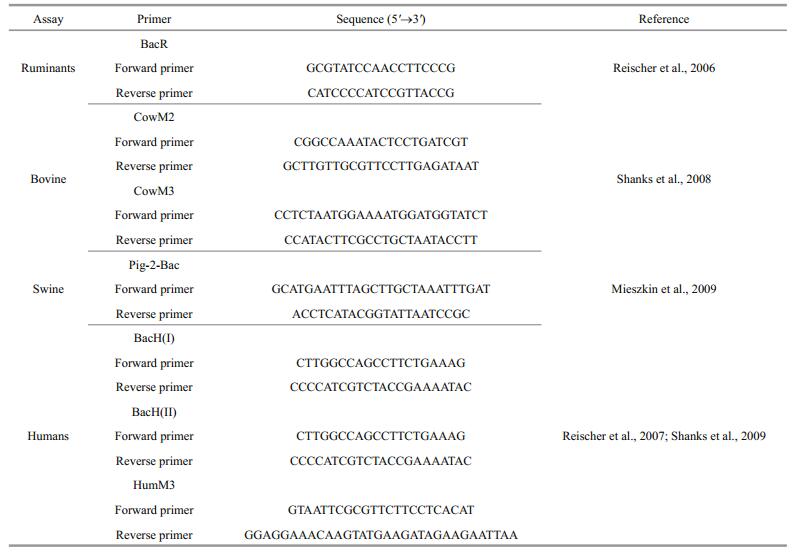
2.2.4 Tracking of faecal contamination sourcesBacterial source tracking was used to identify possible sources of fecal contamination to the lake within different sites and at different times. DNA isolates from water samples were subjected to PCR procedure as described previously to detect the presence of genes associated with different animals (ruminants, bovines, swine and humans) using different primers (Table 3). This was accomplished by subjecting DNA isolates to PCR procedure. One microgram of BSA that has the potential to stabilize component in DNA blunt end and replacement assays was added whenever necessary during the PCR procedure. Quantification followed guideline in Reischer et al. (2013), plasmid DNA was prepared using the respective PCR product amplified out of faecal DNA with the respective primers. Fragments were cloned into pMD18-T followed by BLAST analysis as described previously. The plasmid extraction, plasmid DNA concentration measurement, generation of qPCR standards and determination of Marker DNA copies concentration from various samples were done as previously described in this study. Conditions of qPCR amplification were as follows: initial denaturation at 95℃ for 2 min, and 34 cycles with denaturation at 94℃ for 30 s, annealing at 58℃ for 30 s s and extension at 72℃ for 30 s.
Data were analyzed using Statistical Package for the Social Sciences (SPSS) and subjected to Normality test prior to further analysis. Since most of it were not normally distributed, Kruskal Wallis H test (Analysis of Variance (ANOVA) on ranks) was used to compare the median values. Tukey tests was used as post-hock test. Confidence level was kept at 95% (P=0.05).
3 RESULT 3.1 Physico-chemical parametersThe values for pH, Temperature and Dissolved Oxygen (DO) indicated spatial-temporal variation (Fig. 2). There were higher median values for pH, temperature and DO values during summer seasons than winter seasons. All the values were statistically difference between the sites, P=0.001, 0.001 and 0.011 respectively for pH, temperature and DO.

|
| Figure 2 Box and whisker plots of median (25%, 75% interval) water quality parameters (Ⅰ) pH, (Ⅱ) temperature and (Ⅲ) DO within sites at different seasons [Site 1 Summer (S1S), Site 1 Winter (S1W), Site 2 Summer (S2S), Site 2 Winter (S2W), Site 3 Summer (S3S), Site 3 Winter (S3W), Site 4 Summer (S4S) and Site 4 Winter (S4W)]. Box range is the 25th–75th percentile. Whisker range is the maximum and minimum values. The median is represented by solid horizontal lines in each box. Where analysis of variance (ANOVA) on ranks was significant (P < 0.05, n=15), Tukey tests was performed to determine sites that were significantly different for each parameter (indicated with different letters). |
The values for total coliforms and E. coli through MFT are provided in (Fig. 3). On a general note, sites 2 and 4 gave higher values than sites 1 and 3. The values for total coliforms and E. coli were higher in summer season than winter season. There was clear significant difference in the values for total coliforms between sites, irrespective of the seasonality (sampling time). For E. coli, all the sites were significantly similar except to sites 2 summer and site 4 summer.

|
| Figure 3 Box and whisker plots of median (25%, 75% interval) microbiological water quality parameters [(Ⅰ) total coliforms and (Ⅱ) E. coli] within sites at different seasons [Site 1 Summer (S1S), Site 1 Winter (S1W), Site 2 Summer (S2S), Site 2 Winter (S2W), Site 3 Summer (S3S), Site 3 Winter (S3W), Site 4 Summer (S4S) and Site 4 Winter (S4W)] through bacterial plating. Box range is the 25th–75th percentile. Whisker range is the maximum and minimum values. The median is represented by solid horizontal lines in each box. Where analysis of variance (ANOVA) on ranks was significant (P < 0.05, n=15), Tukey test was performed to determine sites that were significantly different (indicated with different letters). |
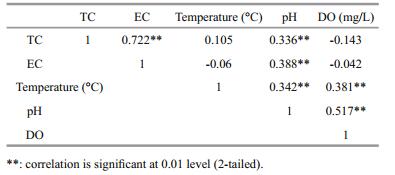
The quantities of different faecal contamination bacterial indicators per specific sites at a given season were also studied and comparisons made based on the copy numbers for lacZ, uidA and cyd genes (Fig. 4). Values for lacZ copies were highest and cyd was the least across the sites. Samples from summer season had higher values than from winter seasons. On comparing different sites, site 2 and 4 had higher copy values of all the genes than sites 1 and 3 (Fig. 5). There was positive correlation between total coliforms and E. coli. Dissolve oxygen and temperature did not show any correlation with both the total coliforms and E. coli. However, pH had positive correlation with all the other parameters (Table 4).

|
| Figure 4 Comparison of DNA copy numbers within different sites and seasons Site 1 Summer (S1S), Site 1 Winter (S1W), Site 2 Summer (S2S), Site 2 Winter (S2W), Site 3 Summer (S3S), Site 3 Winter (S3W), Site 4 Summer (S4S) and Site 4 Winter (S4W). |

|
| Figure 5 Comparison of DNA copy numbers between sites at different seasons Summer (S1S), Site 1 Winter (S1W), Site 2 Summer (S2S), Site 2 Winter (S2W), Site 3 Summer (S3S), Site 3 Winter (S3W), Site 4 Summer (S4S) and Site 4 Winter (S4W). |
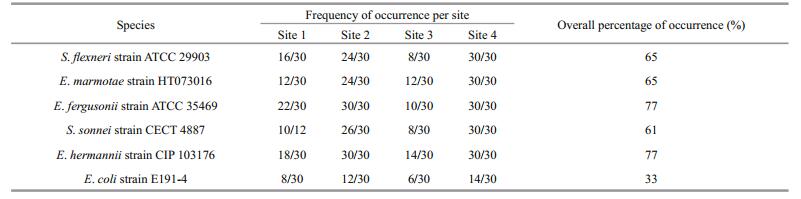
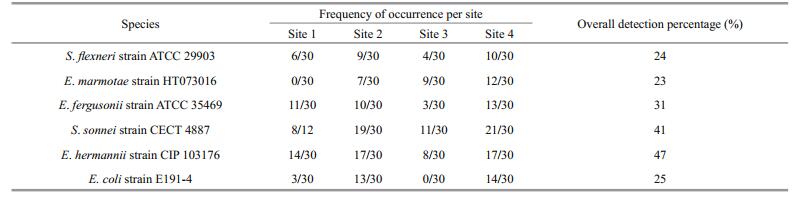
Sequencing result gave a number of faecal coliform bacteria species. Out of all, Shigella flexneri strain ATCC 29903, Escherichia marmotae strain HT073016, E. fergusonii strain ATCC 35469, S. sonnei strain CECT 4887, E. hermannii strain CIP 103176 and E. coli strain E191-4 were the most dominant with more than 30% detection on selective media. There was a higher detection percentage on using selective media (Chromocult coliform agar) than non-selective media (LB media) (Tables 5 and 6, Fig. 6). Escherichia fergusonii and E. hermannii had the highest detection percentage under selective media as compared to S. sonnei and E. hermannii under non-selective media. However, the other member of genus Shigella, (S. flexneri) had no close relationship as compared to the other dominant faecal coliform bacteria (Fig. 7).
|
|

|
| Figure 6 Detection percentages of different faecal contamination indicators under selective Chromocult media (Chr) and nonselective LB media (LB) |

|
| Figure 7 Phylogenetic tree relationship between the dominant species and the pathogenic E. coli O157:H7 |

|
| Figure 8 Marker copy numbers for Sites Ⅰ, Ⅱ, Ⅲ and Ⅳ during summer (S) and winter (W) seasons |
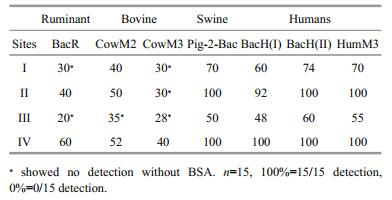
The PCR result for detecting DNA markers that are associated with various animals from composite samples DNA isolates (DNA isolated in water from each site) are in (Table 7). The DNA markers for humans and swine pollution source assays were detected in more samples and in higher quantities (higher detection percentages and higher copy numbers) than the DNA markers for ruminants and bovine pollution source assays. The use of Bovine Serum Albumin (BSA) during the PCR preparation highly improved the detection of the marker DNA.
The results for the influence of temperature, ultraviolet index and rainfall intensity were separated into two (Figs. 9 and 10). The Influence of weather conditions on detection of MST DNA markers for non-human faecal pollution (BacR, CowM2, CowM3 and Pig-2-Bac) depicted a non-uniform trend from the first month of sampling (May 2016 to the last month of sampling (February 2017). This indicates that weather condition influenced the detection of each MST DNA markers for non-human faecal pollution differently. On the other hand, the Influence of weather conditions on detection of MST DNA markers for human faecal pollution (BacH(Ⅰ), BacH(Ⅱ) and HumM3) depicted a uniform trend from the first month of sampling (May 2016 to the last month of sampling (February 2017). This indicates that weather condition influenced the detection of each MST DNA markers for human faecal pollution in moderately the same manner.

|
| Figure 9 Influence of Temperature, ultra violet index and rainfall intensity from May 2016 (5/16) to February 2017 (2/17) on detection of MST DNA markers for non-human faecal pollution (BacR (a), CowM2 (b), CowM3 (c) and Pig-2-Bac (d)) |

|
| Figure 10 Influence of temperature, ultra violet index and rainfall intensity from May 2016 (5/16) to February 2017 (2/17) on detection of MST DNA markers for human faecal pollution (BacH(Ⅰ) (a), BacH(Ⅱ) (b) and HumM3 (c)) |
The spatial temporal variation in pH, temperature and DO indicates variability in bacterial exposure to environmental variables at different sites and time. The correlation between physico-chemical parameters such as pH and faecal indicator bacteria indicated that bacterial abundance in aquatic systems is related to physico-chemical variables. Indeed, studies have recorded that differences in other environmental variables such as wind intensities, effluent load, seasonality, rainfall intensity cloud cover and vegetation cover at different times and sites contribute to spatial and temporal variation in the values of physico-chemical parameters (Dickerman et al., 2006; Ghimire et al., 2013; Zandagba et al., 2016; Ojok et al., 2017). This may consequently determine the abundance of bacterial communities as was noted in this study.
Through MFT and real time qPCR, sites 2 and 4 were more polluted than sites 1 and 3. This variation could have been due to the differences in the amount and nature of effluents that discharges into the lake at these points. Site 2 was close to a sewage discharge point while site 4 was close to a discharge point by a stream water-way that flows across Wuhan University into the lake. Many studies have attributed high faecal contamination into fresh water systems to the presence of sewage discharge points (Donde et al., 2014, 2015). Faecal contamination was found to be higher in summer seasons than winter season. This trend was replicated by the values for DNA marker copies. Higher values of faecal contamination source markers occurred in summer than in winter. One major factor which could have contributed to this was the variation in temperatures, higher temperatures in summers have been found to be causing higher bacterial proliferations (WHO, 2003; Kirchman et al., 2009; Boehm et al., 2013). Additionally, Rop et al. (2016) recorded that variations in overland flows as a result of precipitation differences can pose consequential variation in the nature and amount of faecal bacterial contamination. The presence of pathogens in sediments around the tributaries have also been proven to be an additional source of water pollution during rainfall events because they persist and can be mobilized into the receiving water bodies after heavy rainfall events (Donde and Xiao, 2017; García-Aljaro et al., 2017).
Based on gene copy numbers for lacZ, uidA and cyd, there were more total coliform bacteria as depicted by higher values of lacZ gene copies. Among the faecal coliforms, there were significant representation of both the genus Escherichia and Shigella. Both of which have been given significant attention when looking into the quality of water that is used for human consumption (Nejman-Faleńczyk et al., 2015). The existence in overlapping characteristics between the two genera has created the need for using more than one approach in faecal contamination source tracking (Yamazaki and Fukasawa, 2011). Additionally, the overlap has rendered the use of stand-alone MFT in bacterial quantification approach to remain weak because it makes it hard to differentiate between the different genera of closely related faecal pathogens as in the case of Escherichia and Shigella. Furthermore, the use of uidA gene copy numbers must also be accompanied by cyd to ensure that E. coli is clearly distinguished from other closely related faecal pathogen bacteria (Horáková et al., 2006; Staley and Edge, 2016). The lacZ gene can occur in coliform bacteria other than in E. coli, and uidA gene can also be detected in other genera apart from Escherichia. Therefore, for increased specificity in detection of E. coli, there is need to extend number of targeted genes such as the inclusion of cyd gene that codes for cytochrome bd complex in addition to uidA and lacZ genes to provide more efficient and reliable method for detection of various faecal contamination bacterial strains from water samples (Horakova et al., 2008). Moreover, this approach has made it possible to distinguish E. coli from genetically very similar species such as Shigella flexneri, and even the detection of non-coliform Klebsiella spp. and Raoutella spp., some of which are also potential human pathogens (Fatemeh et al., 2014). Positive correlation between total coliform and E. coli values as reported in this study is an additional evidence for the reliability on E. coli as faecal contamination indicator bacteria (Donde et al., 2015).
There were several species of faecal contamination indicator bacteria, however, the study narrowed down to 6 species (S. flexneri, E. marmotae, E. fergusonii, S. sonnei, E. hermannii and E. coli) which showed higher detection frequencies of more than 30% of the of the 30 samples per site for the entire 10 months' study period. The occurrence of mixed genera and various species of faecal contamination indicator, further pointed out the need to extend number of targeted genes such as the inclusion of cyd in addition to uidA and lacZ genes to provide more efficient and reliable methods for faecal contamination source tracking (Horakova et al., 2008; Sorensen et al., 2015). The use of selective media gave a higher detection percentage on all the species of faecal contamination indicator bacteria than the nonselective media did. This finding has further given an insight on the need to rely more on media that are specific to a given group of bacteria when studying their abundances, distribution or their responses to certain environmental conditions (Tran et al., 2015). The toxin producing pathogenic E. coli (E. coli O157:H7) is one of the known critical pathogenic species that is dominant in water and soil (Campbell et al., 2001; Ma et al., 2013). The result on phylogenetic analyses showed that apart from members of genus Escherichia, there were other members of genus Shigella that do have closer phylogenetic relationship with this deadly strain of E. coli and were also detected alongside Escherichia members in this study. Because of such diversity in faecal bacteria pathogen, there is need to make any contamination tracking method to be very comprehensive and inclusive. This will ensure that all the kinds of faecal pathogenic bacteria are detected irrespective of their genetic similarities or differences and also have their sources accurately traced for appropriate control measures.
The science of using host specific genetic markers as a tool in faecal contamination source tracking has been gaining ground because of its increased efficiency and reliability (Paruch et al., 2015; Quirós et al., 2015). The host specific DNA markers used in this study showed that humans and swine contribute more faecal pollution to the lake than the ruminants and bovine. This could be attributed to high human population density and many residential areas around the lake as well as numerous restaurants where pigs, chicken and other birds are often slaughtered for meals. The wastes from these restaurants could be getting their ways into the lake. Additionally, other birds that inhabit the lake ecosystem could be an additional source of the faecal contamination. However, the use of BSA that has the potential to stabilize component in DNA blunt end and replacement assays proved to be effective in increasing the efficiency of faecal contamination source tracking. Its addition to the reaction mix during the PCR, reduced the effects of PCR inhibitors and increased the detection levels. This resulted to higher detection of the markers. This finding was in agreement with a study by Plante et al. (2011) where BSA was found to improve the RT-qPCR detection of foodborne viruses rinsed from vegetable surfaces.
5 CONCLUSION AND RECOMMENDATIONBacterial abundance in aquatic systems is a factor of selected physico-chemical variables. From this study, sites 2 and 4 were more polluted than sites 1 and 3 and the pollution was higher in summer than in winter based on results from both the MFT and qPCR. The use of cyd gene in addition to uidA gene gave a clear confirmation on the presence of E. coli as opposed to other closely related faecal coliform bacteria. S. flexneri, E. marmotae, E. fergusonii, S. sonnei, E. hermannii and E. coli were the most dominant faecal coliform bacteria in Donghu Lake. The detection efficiency was increased on using selective media as opposed to non-selective media. The use of BSA proved to be effective in increasing the efficiency of faecal contamination source tracking by increasing PCR detection levels. Based on these findings, it is therefore recommended that for effecting management of faecal bacterial water quality of a freshwater ecosystem (Lake), high attention should be given to parts of the lakes where there are affluent, the frequency of pollution vigilance should be increased during summer seasons, cyd to be used alongside lacZ and uidA in monitoring faecal bacterial water quality, appropriate selective media should be used in bacterial detection as well as DNA sequencing and BSA to be used in PCR and qPCR procedures in faecal contamination bacterial studies to reduce the effects of PCR inhibitors. There is also the need to dig deeper into the influence of seasonality and environmental parameters on variability of MST genes. Understanding this relationship will add value to faecal contamination source tracking efficiencies.
6 DATA AVAILABILITY STATEMENTThe raw datasets generated during and/or analyzed during the current study are not publicly available due to the fact that they will be used in writing PhD thesis of the first author and so requires secure protection prior to thesis submission and graduation but are available from the corresponding author on reasonable request.
7 ACKNOWLEDGEMENTThe following institutions are also acknowledged for their support and opportunities that enhanced the success of this study: Key Laboratory of Algal Biology of Chinese Academy of Sciences, Institute of Hydrobiology, Chinese Academy of Sciences, Wuhan 430072, People's Republic of China; International College of the University of Chinese Academy of Sciences, Beijing 100049, People's Republic of China; Egerton University, Department of Environmental Science, P. O. Box 536-20115, Egerton-Kenya; Kenya Marine and Fisheries Research Institute, Lake Turkana Research Station, P. O. Box 205-30500, Lodwar, Kenya.
American Public Health Association (APHA). 2005. Compendium of Methods for the Microbiological Examination of Food and Water. 19th edn. Washington, DC. 350p.
|
Bej A K, McCarty S C, Atlas R M. 1991. Detection of coliform bacteria and Escherichia coli by multiplex polymerase chain reaction: comparison with defined substrate and plating methods for water quality monitoring. Applied and Environmental Microbiology, 57(8): 2429-2432.
|
Boehm A B, Van De Werfhorst L C, Griffith J F, Holden P A, Jay J A, Shanks O C, Wang D, Weisberg S B. 2013. Performance of forty-one microbial source tracking methods: a twenty-seven lab evaluation study. Water Research, 47(18): 6812-6828.
DOI:10.1016/j.watres.2012.12.046 |
Campbell G R, Prosser J, Glover A, Killham K. 2001. Detection of Escherichia coli O157: H7 in soil and water using multiplex PCR. Journal of Applied Microbiology, 91(6): 1004-1010.
DOI:10.1046/j.1365-2672.2001.01465.x |
Chase E, Hunting J, Staley C, Harwood V J. 2012. Microbial source tracking to identify human and ruminant sources of faecal pollution in an ephemeral Florida river. Journal of Applied Microbiology, 113(6): 1396-1406.
DOI:10.1111/jam.12007 |
Dickerman B, Metzger J, Lee W T. 2006. Molecular identification of Aeromonas and coliform bacteria isolated on m Endo media from Lake Erie waters. World Journal of Microbiology and Biotechnology, 22(1): 29-33.
DOI:10.1007/s11274-005-4022-x |
Donde O O, Muia A W, Wanga L A, Shivoga A W, Trick G, Creed I F. 2015. Faecal pollution and solar purification of community water sources within Lake Naivasha Basin, Kenya. Journal of Water, Sanitation and hygiene for Development, 5(2): 252-260.
DOI:10.2166/washdev.2015.150 |
Donde O O, Ojwang O W, Muia A W, Wanga L A. 2014. Bacterial abundance on the skin, gills and intestines of Cyprinus carpio in Lake Naivasha, Kenya: implications for public health and fish quality. Lakes & Reservoirs: Research and Management, 19(1): 46-55.
DOI:10.1111/lre.12050 |
Donde O O. 2017. Wastewater management techniques: a review of advancement on the appropriate wastewater treatment principles for sustainability. Environmental Management and Sustainable Development, 6(1): 40-58.
DOI:10.5296/emsd.v6i1.10137 |
Donde O O, Xiao B. 2017. Understanding wastewater treatment mechanisms: a review on detection, removal and purification efficiencies of faecal bacteria indicators across constructed wetlands. Environmental Reviews.
DOI:10.1139/er-2017-0017(inPress) |
Fatemeh D, Reza Z M, Mohammad A, Salomeh K, Reza A G, Hossein S, Maryam S, Azam A, Mana S, Negin N, Reza K A, Saeed F. 2014. Rapid detection of coliforms in drinking water of Arak city using multiplex PCR method in comparison with the standard method of culture (Most Probably Number). Asian Pacific Journal of Tropical Biomedicine, 4(5): 404-409.
DOI:10.12980/APJTB.4.2014C896 |
García-Aljaro C, Martín-Díaz J, Viñas-Balada E, CaleroCáceres W, Lucena F, Blanch A R. 2017. Mobilisation of microbial indicators, microbial source tracking markers and pathogens after rainfall events. Water Research, 112: 248-253.
DOI:10.1016/j.watres.2017.02.003 |
Ghimire N P, Jha P K, Caravello G. 2013. Physico-chemical parameters of high-altitude rivers in the Sagarmatha (Everest) National Park, Nepal. Journal of Water Resource and Protection, 5(8): 35827.
DOI:10.4236/jwarp.2013.58077 |
Horáková K, Mlejnková H, Mlejnek P. 2006. Direct detection of bacterial faecal indicators in water samples using PCR. Water Science & Technology, 54(3): 135-140.
DOI:10.2166/wst.2006.459 |
Horakova K, Mlejnkova H, Mlejnek P. 2008. Specific detection of Escherichia coli isolated from water samples using polymerase chain reaction targeting four genes: cytochrome bd complex, lactose permease, β-D-glucuronidase, and β-Dgalactosidase. Journal of Applied Microbiology, 105(4): 970-976.
DOI:10.1111/jam.2008.105.issue-4 |
Jahne M A, Schoen M E, Garland J L, Ashbolt N J. 2017. Simulation of enteric pathogen concentrations in locallycollected greywater and wastewater for microbial risk assessments. Microbial Risk Analysis, 5: 44-52.
DOI:10.1016/j.mran.2016.11.001 |
Jenkins C, Lawson A J, Cheasty T, Willshaw G A. 2012. Assessment of a real-time PCR for the detection and characterization of verocytotoxigenic Escherichia coli. Journal of Medical Microbiology, 61(8): 1082-1085.
DOI:10.1099/jmm.0.041517-0 |
Kaoga J, Ouma G, Abuom P. 2013. Effects of farm pesticides on water quality in Lake Naivasha, Kenya. American Journal of Plant Physiology, 8(3): 105-113.
DOI:10.3923/ajpp.2013.105.113 |
Kirchman D L, Morán X A G, Ducklow H. 2009. Microbial growth in the polar oceans—role of temperature and potential impact of climate change. Nature Reviews Microbiology, 7(6): 451-459.
DOI:10.1038/nrmicro2115 |
Lee C, Kim J, Shin S G, Hwang S. 2006. Absolute and relative QPCR quantification of plasmid copy number in Escherichia coli. Journal of Biotechnology, 12(3): 273-280.
DOI:10.1016/j.jbiotec.2005.11.014 |
Li J, Wang H, Liu Y, Lin M, Liu X, Hu X. 2014. Distribution and diversity of coliform bacteria in estuary of Jiahe River, China. International Journal of Environmental Research, 8(2): 501-508.
|
Liu Y M, Yuan X P, Zhang Q Y. 2006. Spatial distribution and morphologic diversity of virioplankton in Lake Donghu, China. Acta Oecologica, 29(3): 328-334.
DOI:10.1016/j.actao.2005.12.002 |
Ma J C, Ibekwe A M, Yang C H, Crowley D E. 2013. Influence of bacterial communities based on 454-pyrosequencing on the survival of Escherichia coli O157:H7 in soils. FEMS Microbiology Ecology, 84(3): 542-554.
DOI:10.1111/1574-6941.12083 |
Mieszkin S, Furet J P, Corthier G, Gourmelon M. 2009. Estimation of pig fecal contamination in a river catchment by real-time PCR using two pig-specific Bacteroidales 16S rRNA genetic markers. Applied and Environmental Microbiology, 75(10): 3045-3054.
DOI:10.1128/AEM.02343-08 |
Nejman-Faleńczyk B, Bloch S, Januszkiewicz A, Węgrzyn A, Węgrzyn G. 2015. A simple and rapid procedure for the detection of genes encoding Shiga toxins and other specific DNA sequences. Toxins, 7(11): 4745-4757.
DOI:10.3390/toxins7114745 |
Ohad S, Vaizel-Ohayon D, Rom M, Guttman J, Berger D, Kravitz V, Pilo S, Huberman Z, Kashi Y, Rorman E. 2015. Microbial source tracking in adjacent karst springs. Applied and Environmental Microbiology, 81(15): 5037-5047.
DOI:10.1128/AEM.00855-15 |
Ojok W, Wasswa J, Ntambi E. 2017. Assessment of seasonal variation in water quality in River Rwizi using multivariate statistical techniques, Mbarara Municipality, Uganda. Journal of Water Resource and Protection, 9(1): 83-97.
DOI:10.4236/jwarp.2017.91007 |
Paruch L, Paruch A M, Blankenberg A G B, Bechmann M, Mæhlum T. 2015. Application of host-specific genetic markers for microbial source tracking of faecal water contamination in an agricultural catchment. Acta Agriculturae Scandinavica, Section B-Soil & Plant Science, 65(S2): 164-172.
DOI:10.1080/09064710.2014.941392 |
Pimentel D, Berger B, Filiberto D, Newton M, Wolfe B, Karabinakis E, Clark S, Poon E, Abbett E, Nandagopal S. 2004. Water resources: agricultural and environmental issues. BioScience, 54(10): 909-918.
DOI:10.1641/0006-3568(2004)054[0909:WRAAEI]2.0.CO;2 |
Plante D, Bélanger G, Leblanc D, Ward P, Houde A, Trottier Y L. 2011. The use of bovine serum albumin to improve the RT-qPCR detection of foodborne viruses rinsed from vegetable surfaces. Letters in Applied Microbiology, 52(3): 239-244.
DOI:10.1111/j.1472-765X.2010.02989.x |
Public Health England (PHE). 2014. Enumeration of β-Glucuronidase Positive Escherichia coli: Pour Plate Method. Microbiology Services Food Water and Environmental Microbiology Standard Method. Public Health England, London.
|
Quirós P, Martínez-Castillo A, Muniesa M. 2015. Improving detection of Shiga toxin-producing Escherichia coli by molecular methods by reducing the interference of free Shiga toxin-encoding bacteriophages. Applied and Environmental Microbiology, 81(1): 415-421.
DOI:10.1128/AEM.02941-14 |
Reischer G H, Ebdon J E, Bauer J M, Schuster N, Ahmed W, Åström J, Blanch A R, Blöschl G, Byamukama D, Coakley T, Ferguson C, Goshu G, Ko G, de Roda Husman A M, Mushi D, Poma R, Pradhan B, Rajal V, Schade M A, Sommer R, Taylor H, Toth E M, Vrajmasu V, Wuertz S, Mach R L, Farnleitner A H. 2013. Performance characteristics of qPCR assays targeting human-and ruminant-associated Bacteroidetes for microbial source tracking across sixteen countries on six continents. Environmental Science & Technology, 47(15): 8548-8556.
DOI:10.1021/es304367t |
Reischer G H, Kasper D C, Steinborn R, Farnleitner A H, Mach R L. 2007. A quantitative real-time PCR assay for the highly sensitive and specific detection of human faecal influence in spring water from a large alpine catchment area. Letters in Applied Microbiology, 44(4): 351-356.
DOI:10.1111/lam.2007.44.issue-4 |
Reischer G H, Kasper D C, Steinborn R, Mach R L, Farnleitner A H. 2006. Quantitative PCR method for sensitive detection of ruminant fecal pollution in freshwater and evaluation of this method in alpine karstic regions. Applied and Environmental Microbiology, 72(8): 5610-5614.
DOI:10.1128/AEM.00364-06 |
Rop K R, Donde O O, Muia A W, Makindi S M. 2016. Influence of rainfall intensity on faecal contamination in River Nyangores of Mara Basin, Kenya: an eco-health integrity perspective. AsianJournalofMicrobiology, Biotechnology and Environmental Science, 18(2): 281-289.
|
Shanks O C, Atikovic E, Blackwood A D, Lu J R, Noble R T, Domingo J S, Seifring S, Sivaganesan M, Haugland R A. 2008. Quantitative PCR for detection and enumeration of genetic markers of bovine fecal pollution. Applied Environmental Microbiology, 74(3): 745-752.
DOI:10.1128/AEM.01843-07 |
Shanks O C, Kelty C A, Sivaganesan M, Varma M, Haugland R A. 2009. Quantitative PCR for genetic markers of human fecal pollution. Applied Environmental Microbiology, 75(17): 5507-5513.
DOI:10.1128/AEM.00305-09 |
Sorensen J P R, Lapworth D J, Read D S, Nkhuwa D C W, Bell R A, Chibesa M, Kabika J, Liemisa M, Pedley S. 2015. Tracing enteric pathogen contamination in sub-Saharan African groundwater. Science of The Total Environment, 538: 888-895.
DOI:10.1016/j.scitotenv.2015.08.119 |
Staley Z R, Edge T A. 2016. Comparative microbial source tracking methods for identification of fecal contamination sources at Sunnyside Beach in the Toronto region area of concern. Journal of Water and Health, 14(5): 839-850.
DOI:10.2166/wh.2016.296 |
Tian C, Wang C, Tian Y, Wu Q, Xiao B. 2015. Vertical distribution of Fe and Fe(Ⅲ)-reducing bacteria in the sediments of Lake Donghu, China. Canadian Journal of Microbiology, 61(8): 575-583.
DOI:10.1139/cjm-2015-0129 |
Tran N H, Gin K Y H, Ngo H H. 2015. Fecal pollution source tracking toolbox for identification, evaluation and characterization of fecal contamination in receiving urban surface waters and groundwater. Science of the Total Environment, 538: 38-57.
DOI:10.1016/j.scitotenv.2015.07.155 |
United Nation Environmental Management Program. 2001. Global drinking water quality index development and sensitivity analysis report. National Water Research Institute, Burlington, Ontario. http://www.un.org/waterforlifedecade/pdf/global_drinking_water_quality_index.pdf.
|
United State Environmental Protection Agency (USEPA). 2000. Risk characterization handbook, EPA 100-B-00-002. EPA, Washington DC.
|
USGCRP. 2016. The Impacts of Climate Change on Human Health in the United States: A Scientific Assessment. U.S. Global Change Research Program, Washington, DC. 312p.
|
Wang H, Zheng X W, Su J Q, Tian Y, Xiong X J, Zheng T L. 2009. Biological decolorization of the reactive dyes Reactive Black 5 by a novel isolated bacterial strain Enterobacter sp. EC3. Journal of Hazardous Materials, 171(1-3): 654-659.
DOI:10.1016/j.jhazmat.2009.06.050 |
World Health Organization. 2003. Heterotrophic plate counts and drinking-water safety. IWA Publishing, London, UK.
|
World Health Organization. 2005. Water Recreation and Disease: Plausibility of Associated Infections: Acute Effects, Sequelae and Mortality. International Water Association Publishing, London.
|
World Health Organization. 2013. Water Quality and Health Strategy 2013-2020, http://www.who.int/water_sanitation_health/dwq/water_quality_strategy.pdf. Accessed on 2016-02-02.
|
Yamazaki Y, Fukasawa A. 2011. Multiplex polymerase chain reaction method discriminating Escherichia coli and Shigella sp. Archives of Microbiology, 193(2): 83-87.
DOI:10.1007/s00203-010-0647-8 |
Zandagba J, Adandedji F M, Mama D, Chabi A, Afouda A. 2016. Assessment of the physico-chemical pollution of a water body in a perspective of integrated water resource management: case study of Nokoué Lake. Journal of Environmental Protection, 7(5): 656-669.
DOI:10.4236/jep.2016.75059 |