 2018, Vol. 36
Institute of Oceanology, Chinese Academy of Sciences
Article Information
- FANG Lujing(房路京), XIAO Shijun(肖世俊), HAN Zhaofang(韩兆方), WANG Zhiyong(王志勇)
- MicroRNAs identification and bioinformatics analysis in large yellow croaker Larimichthys crocea using an integrated comparative and ab initio approach
- Chinese Journal of Oceanology and Limnology, 36(5): 1707-1719
- http://dx.doi.org/10.1007/s00343-018-7053-5
Article History
- Received Feb. 28, 2017
- accepted in principle May. 8, 2017
- accepted for publication Jul. 17, 2017


MicroRNAs are ~22 nucleotides (nt), single-stranded, endogenous and non-coding RNAs that play important roles in many physiological and developmental processes (Ambros, 2004; Bartel, 2004; He and Hannon, 2004). Since the first miRNA was discovered in the early 1990s (Lee et al., 1993), increasing evidence on multicellular eukaryotes has shown that miRNAs regulate basic cellular functions, such as proliferation, differentiation, and death (Hannon, 2002; Hwang and Mendell, 2006; Shivdasani, 2006; Lenkala et al., 2014; Yao, 2016), and have multipurpose biological functions, including development, growth, signalling, differentiation, protein degradation (Behm-Ansmant et al., 2006), stress response, disease development, and acting as a signature for cancer (Fleming et al., 2013; Tüfekci et al., 2014). miRNAs can negatively mediate gene expression by recognizing completely or partially complementary sequences in target genes. Previous studies show that miRNA genes are present in the introns of coding genes or intergenic regions. A series of steps was involved in the biogenesis of miRNAs. In the nucleus, miRNA genes are transcribed into several hundred nucleotide-long primary miRNAs (pri-miRNAs). Pri-miRNAs can liberate pre-miRNA (precursor miRNA) hairpin structures, which are then exported from the nucleus to the cytoplasm. Next, a pre-miRNA can produce a duplex intermediate (miRNA:miRNA*) in the cytoplasm. Finally, mature miRNAs that usually come from one strand of the miRNA:miRNA* duplex combine with Dicer enzyme and other associated proteins to form an active RNA-induced silencing complex (RISC). The RISC can repress translation by binding to the 3′UTR of the target mRNA (Hannon, 2002; Bartel, 2004; Yang and Wang, 2011).
As reported in previous studies, there are two prevalent methods for miRNA identification, the computational and sequencing approaches. Although miRNA sequencing provides more complete miRNA information, the computational method remains a prevalent strategy for miRNA prediction before high-throughput sequencing experiments are performed, especially for organisms with abundant genome and transcriptome resources. (Tong et al., 2006; Baev et al., 2009; Zhou et al., 2009; Frazier et al., 2010; Huang et al., 2010; Patanun et al., 2013; Akter et al., 2014; Han et al., 2014a, b; Li et al., 2016a). The homology-based and ab initio approaches are two main computational methods for miRNA identification. The homology-based approach takes advantage of the high conservation of miRNA among species. Although homology-based methods are convenient, they can only identify known miRNA molecules that have been previously reported. The ab initio approach relies on the sequence, genomic organization and structure features of miRNA precursors, which can detect miRNAs that lack obvious homology with those in other organisms.
Large yellow croaker (Larimichthys crocea), belonging to the order Perciformes, is a widely cultured and important economic marine fish in China (Zheng et al., 2006). Although miRNAs molecules were predicted for large yellow croaker (Huang et al., 2016), a previous study only identified miRNAs from the genome sequence. However, scientists have suggested that the transcriptome is a more reliable resource to identify expressed non-coding RNA (Wan et al., 2012; Ou et al., 2013; Xu et al., 2013, 2015; Prakash et al., 2016). Therefore, integrated miRNA identification by combining homology-based and ab initio methods from both the genome and transcriptome are needed for systematic analysis of miRNA in large yellow croaker.
A single nucleotide polymorphism (SNP) is an important small genetic variant in the population and provides valuable genetic resources for bio-diversity, genome evolution, and trait association analyses (Shastry, 2009; Nicoloso et al., 2010; Gong et al., 2012; Jiang et al., 2016; Li et al., 2016b). Many studies have revealed that a genomic SNP can affect many essential biological processes via gene expression regulation by miRNA-related interaction networks, especially for SNPs that reside in miRNAs and the binding region of mRNA. For example, rs2910164 of miR-146a plays an important role in gastric cancer (Jiang et al., 2016), and genetic variants in mir-499 and mir-608 could significantly increase the risk of lung cancer (Li et al., 2016b). Interestingly, miRNA seed regions, 2–8 nucleotides of the 5′ end, bind to complementary sites in the 3′-untranslated regions (3′UTRs) of target messenger RNAs (mRNAs) and play an important role in regulating expression during translation. Therefore, alterations in the miRNA seed sequences might dramatically influence the regulation network of miRNA. Previous studies have revealed that polymorphisms are rare in mature sequences, especially in seed regions because of the conservation of the mature miRNA sequence and its seed regions (Lewis et al., 2005). However, most studies were performed on human species, and little is known about the distribution of SNPs and their effects around miRNA in large yellow croaker and other teleost species.
In this study, an integrated computational method combining homology-based and ab initio predictions was used to identify potential miRNAs in large yellow croaker from both genome and transcriptome sequences. Therefore, conserved miRNAs and large yellow croaker-specific miRNAs were identified through this comprehensive method. For a better understanding of the miRNA regulation function, target genes of those miRNAs were predicted and annotated with the Gene Ontology (GO) and Kyoto Encyclopedia of Genes and Genomes (KEGG) databases. The distribution of SNP markers was investigated around miRNA sequences to understand how genetic variants influence the biological function of miRNAs in living cells. The SNP loci residing in miRNA and their mRNA binding sites were analysed to reveal their possible biological effects. This study provides a systematic method of miRNA detection and miRNA-related SNP analysis from the genome and transcriptome of large yellow croaker using the integrated strategy, providing a valuable reference for miRNA identification and functional investigation of other teleost species.
2 MATERIAL AND METHOD 2.1 Sequence data and reference miRNAsThe latest miRBase release (Release 21), containing 35 828 miRNA genes from 223 species, was downloaded from the miRBase (Kozomara and Griffiths-Jones, 2014), and a total of 26 332 animal miRNAs were retrieved as the reference set of the miRNA sequence. To omit redundant or overlapping miRNAs, repeated sequences of miRNAs were removed and the remaining sequences were used as query sequences for homology-based miRNA identification. The genome and transcriptome sequences of large yellow croaker were downloaded from the NCBI database with genebank accession number JRPU00000000 (Ao et al., 2015) and project accession number PRJNA254539 (Xiao et al., 2015), respectively. The transcriptome sequence came from various developmental stage, including embryos cells, larval, 11 juvenile and 2 adult (one male and one female), and different tissues including ocular, skin, muscle, gonadal, intestinal, liver, kidney, blood gall and air bladder.
2.2 The softwares used in the studyThe alignment tool BLAST version 2.2.31 was used for conserved miRNA prediction. Secondary structures of pre-miRNAs were evaluated by RNAfold version 2.1.9 (http://www.tbi.univie.ac.at/RNA). RNAhybrid (http://bibiserv.techfak.uni-bielefeld.de) and Miranda (http://www.microrna.org) were used for miRNA target gene prediction.
2.3 Identification of the conserved miRNAsThe workflow for identifying conserved miRNAs is presented in Fig. 1. The genome sequences of large yellow croaker were used for the homology search against the known unique mature animal miRNA sequences. The homology search was performed using BLASTN with an E-value of 10 and word-match size of 7. The following seven criteria were also considered to identify the candidate miRNAs from the alignment results:

|
| Figure 1 miRNA prediction pipeline according to homology We put result of each steps into brackets, if there are two numbers in a same bracket, then the first one indicate the result from genome sequence and second one from transcriptome sequence. |
1) the number of mismatches and gaps between known miRNAs and genomic sequences was less than 3;
2) the minimal length of the pre-miRNA was set as 55 nt;
3) the pre-miRNA was folded into an appropriate stem loop hairpin secondary structure;
4) the mature miRNA sequence and its opposite miRNA strand had less than 5 nt mis-matches;
5) the mature miRNA sequence resided in one arm of the hairpin structure;
6) the A+U content was between 30 and 70%;
7) both minimal folding free energy (MFE) and a minimal folding free energy index (MFEI) are essential to distinguish between miRNAs and other small RNAs. MFE and MFEI were lower than -20 and 0.8 kcal/mol, respectively.
To reduce the false positive rate for miRNA identification, the pre-miRNA sequences were blasted against the protein database with BLASTX to remove the coding sequence. The word match size between candidate pre-miRNA and protein sequences was kept at 7. For a more accurate result, the E-values of all of the alignment were collected to determine the best E-value using ROC analysis. A Support Vector Machine (SVM), exhibiting excellent pre-miRNA classification in previous studies for other species (Ng and Mishra 2007; Batuwita and Palade 2009; Ding et al., 2010), was used to scan the pre-miRNA sequences to distinguish true pre-miRNAs from false ones. Thirty-six pre-miRNA sequence features (see Supplementary Table 1 for detailed information) of 328 Danio rerio pre-miRNAs from miRBase and 350 random pre-miRNA sequences were used to train the SVM classification. The resultant training model was applied to identify pre-miRNA in the following study. In addition to the genome sequences, transcriptome sequences were also used to detect pre-miRNA sequences with the above identical method.
The overview workflow for detecting novel miRNAs is presented in Fig. 2. Briefly, all miRNAs, including the predicted miRNAs from the homology-based method, were first aligned to the large yellow croaker genome using BLASTN to locate their position with a word match size of 7 and an E-value cut-off of 2. Second, the miRNA cluster was defined with at least 3 miRNAs in a sequence window of 2 kb. To predict possible miRNA sequences in the range of the miRNA cluster, 80 and 40 bp were used as the pre-miRNA and step length, respectively. Pre-miRNA sequences conforming to the above seven criteria were taken to predict potential miRNA molecules.

|
| Figure 2 miRNA prediction pipeline using the ab initio method Note that the number in brackets means the result number of this step. |
3′ UTR sequences longer than 20 bp were extracted using a python script according to the gene annotation and used for target gene prediction. To reduce false positives, we combined the results of the prevalent miRNA target prediction tools of RNAhybrid and Miranda. The default score threshold and energy cut-off (score≥165 and energy≤-23) were used in miRanda to predict the miRNA target. The p value and E-value (P=0.1 and e=-23) were applied in RNAhybrid.
The Gene Ontology (GO) and Kyoto Encyclopedia of Genes and Genomes (KEGG) databases were used for the functional annotation of miRNA target genes. First, the miRNA targets genes were annotated by BLASTX against the NR database. Second, the best hit results by NR blast were used for GO and KEGG annotation with default settings in Blast2GO. We also used KAAS (KEGG Automatic Annotation Server) for KEGG annotation, and the results were combined with the output from Blast2GO.
2.6 Identification of miRNA-related SNPWhole-genome resequencing data published in previous studies were used to call the SNP loci for large yellow croaker (Ao et al., 2015). The resulting SNP information was employed to analyse the SNP distribution around miRNA molecules. To investigate the characterization of the SNP distribution around miRNA, we estimated the density of SNPs in six regions (Gong et al., 2012), including miRNAs, pre-miRNAs, upstream and downstream 1 000 bp of pre-miRNA, and pre-miRNA upstream and downstream flanking regions (Fig. 3). We also randomly selected regions of 500 bp from the reference genome as the control region. The SNP density was defined as the number of SNPs per 1 000 bp.

|
| Figure 3 Definition of six regions (miRNA region, pre-miRNA region, pre-miRNA upstream and downstream flank regions, pre-miRNA upstream and downstream 1k regions) Upstream or downstream pre-miRNA flank represents a window (equal to the average size of pre-miRNA). |
The seed regions of miRNAs were more conserved than other regions of mature miRNAs because the SNP loci in miRNA target regions may influence the miRNA regulation cascades. To investigate how SNPs influence the miRNA function, miRNAs whose target regions contain SNP loci were considered in this study. As described above, two miRNA target tools, Miranda and RNAhybrid, were employed to predict the target genes for the wild-type and SNP-type miRNAs. For easy analysis of the effect induced by SNP in miRNAs, we defined the following four signs: WR (target genes of wild-type miRNAs processed by RNAhybrid), SR (target genes of SNP-type miRNAs processed by RNAhybrid), WM (target genes of wild-type miRNAs processed by Miranda), and SM (target genes of SNP-type miRNAs processed by Miranda). If one target exists in both WR and WM, but not in SM or SR, we defined this as target loss. If one target exists in both SM and SR, but not in WR or WM, we defined this as target gain. If one target exists in all four signs, we defined this as the target remain. All target genes for wild-type and SNP-type miRNA were classified into three groups, gained targets, lost targets and remained targets, for each miRNA.
3 RESULT AND DISCUSSION 3.1 Determination of the best E-value parameter for BLASTXAccording to previous studies, the sequence features of the miRNA precursor, including the conformation of the stem loop secondary structure, low MFE, relative narrow range of the A+U content and MFEI, could be used to distinguish true miRNA molecules from other potential sequences; however, it is still necessary to eliminate coding sequences by BLASTX from the miRNA precursor sequences against the known protein database. In previous studies, an arbitrary E-value was chosen during miRNA classification. In our work, we attempted to estimate the optimized E-value for miRNA identification from receiver operating characteristic (ROC) analysis. To this end, we use 599 medaka miRNAs from NGS (Li et al., 2010) as the positive dataset and 436 predicted miRNA from medaka CDS sequences as the negative dataset. Both the positive dataset and negative datasets were evaluated BLASTX against the NR database. We combined two E-values of the BLASTX results as the input dataset of the ROC analysis. As shown in Fig. 4, the optimized E-value was -5.611, leading to a specificity of 0.609 and sensitivity of 0.733.

|
| Figure 4 ROC result for the optimal E-value This ROC result using the pROC R package, with an AUC closer to 1, provided result accuracy. -5.611 is the E-value threshold. |
Most mature miRNAs are evolutionarily conserved among species. Animal miRNAs, including 1 275 species and 26 332 miRNAs, were selected from the latest miRBase. Large yellow croaker genome and transcriptome sequences were scanned to identify conservative miRNA genes using the prediction procedure, as demonstrated in Fig. 1. The whole miRNA detection processes included two steps. First, potentially conserved miRNAs were searched from genome and transcriptome sequences using BLASTN and preliminary filtration, resulting in 1 085 and 189 homologous miRNA from large yellow croaker genome and transcriptome sequences, respectively. Second, protein-coding and redundant miRNA were omitted from the potential miRNAs to reduce false positive results. After the filtration and SVM classification in the second step, the total numbers of potential miRNAs from the genome and transcriptome were reduced to 273 and 54 miRNAs, respectively. Redundant miRNAs were removed from total predicted miRNAs before we compared total predicted miRNAs with previous report miRNAs in large yellow croaker by using BLASTN, and 287 unique miRNAs were gained. The 287 identified miRNA sequences (Supplementary Table 2) covered 103 previously reported miRNAs (Qi et al., 2014; Huang et al., 2016) and 184 newly predicted miRNAs. According to the miRNA classification, all of the predicted miRNAs of large yellow croaker were grouped into 100 families (Supplementary Table 2). There were 184 newly miRNAs when compared with previous studies' results and 3 reasons can account for this. The first one is that the source data was different, in our study, we used the whole genome sequences and comprehensive transcriptome sequences while in previous research genome sequences or specific condition transcriptome sequences were used. The second one is that parameters may different for same software in different reports, for example, we use the ROC to find the best E-value for BLASTX. The last one which is the most important one is that different features were used to train SVM model when compared with previous researches.
3.3 Novel miRNA detection in the large yellow croaker genome using the ab initio approachPrevious reports revealed that miRNA genes were frequently grouped as clusters in chromosomes. For example, miRNA clusters containing more than three miRNA genes were found in D. melanogaster (Aravin et al., 2003); miRNA clusters containing let-7a-1 and let-7f-1 were identified in the human genome (Lagos-Quintana et al., 2001). Therefore, it is possible to discover novel miRNAs in the large yellow croaker genome around known miRNA clusters. Taking the miRNA predicted in this study and 112 miRNA genes previously reported (Qi et al., 2014) as known miRNA, 391 miRNA genes were left after removing redundant miRNA. To determine the miRNA gene locations, we mapped all known miRNAs in the large yellow croaker genome, and 384 (98.2%) of all known miRNA genes were successfully mapped to the best unique location.
To the best of our knowledge, the strict definition of a miRNA cluster is still lacking. Altuvia et al. utilized a fixed length with 3 kb to define a miRNA cluster (Altuvia et al., 2005), while other researchers adopted a more flexible length. For example, Chan et al. selected a range from 1 kb to 50 kb for a miRNA cluster (Chan et al., 2012). In this study, we chose 2 kb as the length of a miRNA cluster because a longer length may overestimate miRNA clusters in the large yellow croaker genome. A miRNA cluster was defined as the genomic region including at least two miRNA molecules. With the method described in the Methods section, 131 novel miRNAs were de novo predicted and are listed in Supplementary Table 3.
We combined homology results and ab initio results together and 418 miRNAs were gained. The number is very similar with previous report in Equus caballus (Zhou et al., 2009) with 407 miRNAs. Our results are more comprehensive when compared with the results in Equus caballu, as the fact we used both genome and transcriptome sequences as the input sequence. In the next future, new data on other species and the comparison with data obtained in closely related species will probably help to estimate if we can expect to find more miRNAs in the large yellow croaker. Besides, limits in our study were also exist and pri-miRNAs which only contain one miRNA precursor were considered while there are some pri-miRNAs which can produce more than one miRNA precursor (Bartel, 2004).
Predict miRNAs by this using computational method is efficient and low-cost, some work still need to be done in the future. In order to exam this workflow's accuracy, QPCR validations would be exerted. Furthermore, small RNA sequencing will be necessary in the future to confirm the biological significance of these predicted miRNAs as the fact that cost of sequencing technology is becoming cheaper and cheaper.
3.4 Features of the predicted miRNA genesWe calculated the features of the 418 predicted miRNAs and their precursor sequences from our research. In our study, the length of pre-miRNA varied from 56 to 187 nt, with an average of 90.96 nt, which was consistent with that of animal hairpin sequences downloaded from miRBase. The length of mature miRNAs ranged from 16 to 27 nt, with an average of 21.74 nt, showing a comparable length distribution with other animal mature miRNAs in the miRBase database (Supplementary Fig. 1).
We analysed the base composition at each position in mature miRNAs; the statistical results are shown in Fig. 5a. The nucleotide distributions at each position of large yellow croaker miRNA were in accordance with other animals (Fig. 5b). The base composition confirmed previous results that cytosine (C) is used less often than the other the three nucleotides at position 19, while adenine (A) is found at the smallest proportion at position 23.

|
| Figure 5 Base composition at each position in mature miRNAs a. base composition at each position in large yellow croaker mature miRNAs; b. base composition at each position in other animal mature miRNAs. |
miRNA precursors as well as other RNAs, mRNAs, tRNAs and rRNAs could fold into hairpin secondary structures. Therefore, the minimal free energy (MFE) and minimal free energy index (MFEI) are two important indicators to distinguish miRNAs from other small RNAs (Ng and Mishra, 2007). The MF E-value of the predicted pre-miRNAs ranges from -112.3 to -16.2 kcal/mol, with an average of -39.97 kcal/mol, and the average of MFEI was found to be 0.87 kcal/mol. The G+C content is another feature of miRNA precursors (Zhou et al., 2009) because a higher G+C content in miRNA precursors could influence the stability of the secondary structures. The G+C content of miRNA precursors varied from 30.36 to 68.97 with an average of 43.75.
3.5 Potential miRNA target gene prediction and functional annotationmiRNAs regulate gene expression by binding to the 3-UTR of target genes in various organisms. miRNA target gene identification is an important to better understand the role of miRNAs in cellular functions and gene regulation networks (Lai et al., 2016); however, false positives remain one of the most challenging issues during miRNA target prediction. We combined the 418 and 112 miRNAs, for a total of 530 miRNAs, from this and a previous study for further analysis. In this work, we predicted the potential targets of 530 miRNA genes by using two prevalent tools, miRanda and RNAhybrid. As a result, 16 142 and 23 510 miRNA target genes were predicted from miRanda and RNAhybrid, respectively. To reduce false positives, only target genes predicted by the two tools were used for the subsequent analysis. As a result, a total of 16 053 targets for 507 miRNA genes were predicted, with an average of 31 target genes for each miRNA. We only found that 23 miRNAs were not assigned to target genes in both tools, which might be attributed to the uncompleted reference genome and limitation of the target gene prediction tools.
The annotation of Gene Ontology (GO) uncovered the putative molecule functions of the target genes as well as the diverse biological processes that are regulated by related miRNAs. The 16 053 potential target genes were used for functional categorization and pathway analysis. The BLAST2GO suite was used to annotate the miRNA target genes by GO databases into three independent categories, cellular components, molecular functions, and biological processes. As a result, 14 609 target genes were successfully associated with GO terms. Furthermore, 13 284, 13 152 and 13 125 target genes were assigned to cellular components, biological processes and molecular functions, respectively. A more detailed annotation for each category is represented in Fig. 6. In the biological process category, the cellular processes (GO:0009987, 11357) and single-organism processes (GO:0044699, 10726) were the two most enriched terms. For the molecular function category, the majority consisted of binding (GO:0005488, 11052) and catalytic activity (GO:0003824, 5589). In the cellular component category, many miRNA target genes were involved in the cell part (GO:0044464, 11864), which was followed by cells (GO:0005623, 11915).

|
| Figure 6 miRNA target GO annotation miRNA targets annotated by Gene Ontology (GO) terms, which belong to three main categories, biological processes, cellular components and molecular functions. |
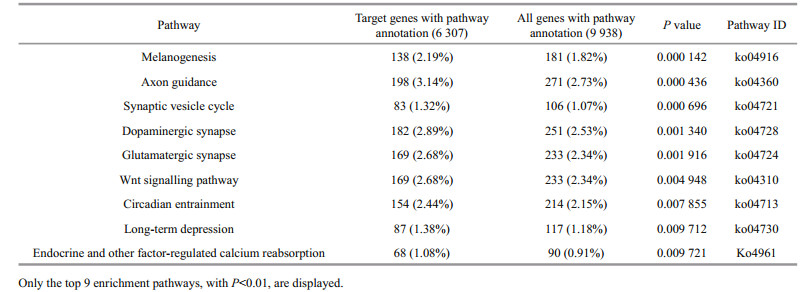
With the help of KEGG annotation, we can elucidate the functions of putative target genes related to primary metabolism and secondary metabolite biosynthetic pathways. KAAS (KEGG Automatic Annotation Server) was used for pathway annotation of genes with a BLAST output (see Methods for details). Then, 6 308 target genes were assigned to KO terms and classified into 341 pathways after mapping the target genes to the reference pathways. All pathways were divided into six categories according to the molecular interaction and reaction networks, including Metabolism, Genetic Information Processing, Environmental Information Processing, Cellular Processes, Organismal Systems and Human Diseases (Supplementary Fig. 2). With the whole genome genes as the background, we employed KEGG annotations for pathway enrichment. Those pathways represented the biological pathway influenced most by miRNA regulations (Table 1). The enriched pathways included many biological pathways that have been reported in previous studies, such as melanogenesis (Felicetti et al., 2008), dopaminergic synapse (Fiore et al., 2008) and the wnt signalling pathway (Gokhale et al., 2010).
3.6 SNP distribution around miRNA in the large yellow croaker genomeAnimal miRNA genes exhibited high conservation among organisms; therefore, we speculated that mutations around miRNA re suppressed by natural selection. The SNP distributions around miRNA molecules were previously depicted in human and rice genomes (Saunders et al., 2007; Zhu et al., 2012; Liu et al., 2013); however, to the best of our knowledge, there is no research on SNPs around miRNA genes of large yellow croaker. To compare the SNP distribution among diverse regions in the large yellow croaker genome, SNP densities of six regions were calculated, including the miRNA, pre-miRNA (miRNA precursor) and pre-miRNA adjacent upstream and downstream 1 000 bp regions; pre-miRNA flanking regions and whole-genome random regions (Fig. 7). As we expected, the pre-miRNA flanking regions had the highest SNP density (~31.21 per kb), while the mature miRNA regions had the lowest SNP density (~10.41 per kb). The results were consistent with a previous investigation in the human genome, which also confirmed the reliability of miRNA detection in this study.

|
| Figure 7 Six regions, including miRNA, pre-miRNA, pre-miRNA upstream 1 k, pre-miRNA downstream 1 k, pre-miRNA upstream flank, and pre-miRNA downstream flank, and the left region is a random region The height of the pillar represents the average SNP number in this region, and the error bars represent standard error. |
Previous investigations of polymorphisms in miRNA seed regions showed that miRNA SNPs might suppress gene expression by improving the binding affinity, while other mutations could lead to novel gene expression regulation. Alterations of the gene regulation cascade by polymorphisms in seed regions of miRNAs may significantly influence normal biological pathways in living cells; therefore, studies on SNPs in miRNA provided an important approach to probe the function of miRNAs in gene regulation pathways. For example, the T allele in miR-196a2 (rs11614913) could decrease the risk of breast cancer. By contrast, miR-499 (rs3746444) AG/GG could increase the risk of breast cancer (Hu et al., 2014). However, the biological influence analysis of polymorphisms in the seed regions of miRNAs has barely been reported for teleost.
miRNA target gene prediction mainly relied on miRNA seed region (nucleotides 2–8) complementation; therefore, SNPs in mature miRNA, especially the seed regions, may have a profound influence on the miRNA function and biogenesis. In this study, 22 SNPs were identified in the seed regions of 19 miRNAs. All miRNAs only had one SNP in the seed regions, except miR-7154-3p, miR-2025-5p and Pcr-mir-scaffold1370_34620. RNAhybrid and miRanda were employed to predict target genes for all mutated and wild-type miRNAs, except miR-449c-3p, which was too short for target gene prediction after mutation. All target genes for wild-type and SNP-type miRNA were classified into three groups for each miRNA, gained targets, lost targets and remaining targets. As shown in Fig. 8, we found that most of site mutations in putative miRNAs could greatly increase the target gene number. By comparing the remaining and gained target gene numbers for each miRNA, we found that nucleotide alterations of the miRNA seed regions can significantly enhance complementation with their target gene (Supplementary Table 4, t-test P-value=0.01). Meanwhile, the number of gained target genes was obviously higher than that of the remaining and lost targets, which was similar to the investigation in the rice genome, indicating that mutations in miRNA seed regions might dramatically influence the miRNA regulation pathway.

|
| Figure 8 miRNA targets change under the influence of miRNA seed SNPs SNP-related miRNA target genes, including the remaining target genes, lost target genes and gained target genes. Remaining target genes represent those genes that were not changed. Lost target genes represent those genes that were lost after SNP mutation, and the gained target genes refer to those new target genes after SNP mutation. |
miRNA-related SNPs could impair or enhance miRNA processing and alter the sites of processing. Many scientists have studied miRNA-related SNPs especially in human diseases. For example, Liu et al. (2012) established a miRNA-related SNP database for human species; Hu et al. (2016) have found a SNP site associate with plasma triglycerides levels and coronary heart disease in miR-4217 target gene. However most of these researches are related about SNPs in miRNAs' target 3′UTR sequences or pre-miRNAs or pre-miRNAs. Studies associated with SNPs which located in miRNA seed regions are very rare. So it's hard to find a proper previous research to compare with our results. Although miR-4217 in Hu's findings play an important role in human heart disease, the SNPs' location is not the seed region. But our results can provide a potential research direction in the near future for other species.
4 CONCLUSIONMost computational investigations for miRNA identification rely on the sequence conservation of mature miRNA among species. However, the homology-based approach can only detect known miRNA molecules. In this study, we adopted an integrated strategy combining the homology-based and ab initio methods, utilizing the characterization of the miRNA cluster to predict miRNAs from the large yellow croaker genome and transcriptome. A total of 418 miRNAs, including 287 miRNAs from homology searching and 131 miRNAs from the ab initio approach, were identified. Then, 16 053 putative target genes were predicted for the identified miRNAs, which were further annotated by GO term and KEGG pathway analyses. The SNP distribution around miRNAs revealed that miRNA mutations were suppressed. Then, 22 SNP loci were identified in large yellow croaker miRNA seed regions, and we demonstrated that these mutations could dramatically influence miRNA-gene regulation cascades. This study not only provides abundant miRNA resources for large yellow croaker for subsequent investigations as well as offers a reference strategy for miRNA detection and analysis for other non-model organisms.
5 DATA AVAILABILITY STATEMENTThe genome sequence data and transcriptome sequencing data that support the findings of this study are available in NCBI (accession No. JRPU00000000) with the identifier https://doi.org/10.1371/journal.pgen.1005118 and NCBI (SRA accession No. of SRR1509885) with the identifier https://doi.org/10.1371/journal.pone.0124432.
6 COMPETING INTERESTSThe authors declare there are no competing interests.
Electronic supplementary materialSupplementary material (Supplementary Figs.1–2 and Tables 1–4) is available in the online version of this article at https://doi.org/10.1007/s00343-018-7053-5.
Akter A, Islam M M, Mondal S I, Mahmud Z, Jewel N A, Ferdous S, Amin M R, Rahman M M. 2014. Computational identification of miRNA and targets from expressed sequence tags of coffee (Coffea arabica). Saudi Journal of Biological Sciences, 21(1): 3-12.
DOI:10.1016/j.sjbs.2013.04.007 |
Altuvia Y, Landgraf P, Lithwick G, Elefant N, Pfeffer S, Aravin A, Brownstein M J, Tuschl T, Margalit H. 2005. Clustering and conservation patterns of human microRNAs. Nucleic Acids Research, 33(8): 2 697-2 706.
DOI:10.1093/nar/gki567 |
Ambros V. 2004. The functions of animal microRNAs. Nature, 431(7006): 350-355.
DOI:10.1038/nature02871 |
Ao J Q, Mu Y N, Xiang L X, Fan D D, Feng M J, Zhang S C, Shi Q, Zhu L Y, Li T, Ding Y, Nie L, Li Q H, Dong W R, Jiang L, Sun B, Zhang X H, Li M Y, Zhang H Q, Xie S B, Zhu Y B, Jiang X T, Wang X H, Mu P F, Chen W, Yue Z, Wang Z, Wang J, Shao J Z, Chen X H. 2015. Genome sequencing of the perciform fish Larimichthys crocea provides insights into molecular and genetic mechanisms of stress adaptation. PLoS Genetics, 11(4): e1005118.
DOI:10.1371/journal.pgen.1005118 |
Aravin A A, Lagos-Quintana M, Yalcin A, Zavolan M, Marks D, Snyder B, Gaasterland T, Meyer J, Tuschl T. 2003. The small RNA profile during Drosophila melanogaster development. Developmental Cell, 5(2): 337-350.
DOI:10.1016/s1534-5807(03)00228-4 |
Baev V, Daskalova E, Minkov I. 2009. Computational identification of novel microRNA homologs in the chimpanzee genome. Computational Biology and Chemistry, 33(1): 62-70.
DOI:10.1016/j.compbiolchem.2008.07.024 |
Bartel D P. 2004. MicroRNAs:genomics, biogenesis, mechanism, and function. Cell, 116(2): 281-297.
DOI:10.1016/S0092-8674(04)00045-5 |
Batuwita R, Palade V. 2009. microPred:effective classification of pre-miRNAs for human miRNA gene prediction. Bioinformatics, 25(8): 989-995.
DOI:10.1093/bioinformatics/btp107 |
Behm-Ansmant I, Rehwinkel J, Izaurralde E. 2006. MicroRNAs silence gene expression by repressing protein expression and/or by promoting mRNA decay. Cold Spring Harbor Symposia on Quantitative Biology, 71: 523-530.
DOI:10.1101/sqb.2006.71.013 |
Chan W C, Ho M R, Li S C, Tsai K W, Lai C H, Hsu C N, Lin W C. 2012. MetaMirClust:discovery of miRNA cluster patterns using a data-mining approach. Genomics, 100(3): 141-148.
DOI:10.1016/j.ygeno.2012.06.007 |
Ding J D, Zhou S G, Guan J H. 2010. MiRenSVM:towards better prediction of microRNA precursors using an ensemble SVM classifier with multi-loop features. BMC Bioinformatics, 11(S11): S11.
DOI:10.1186/1471-2105-11-S11-S11 |
Felicetti F, Errico M C, Segnalini P, Mattia G, Carè A. 2008. MicroRNA-221 and -222 pathway controls melanoma progression. Expert Review of Anticancer Therapy, 8(11): 1 759-1 765.
DOI:10.1586/14737140.8.11.1759 |
Fiore R, Siegel G, Schratt G. 2008. MicroRNA function in neuronal development, plasticity and disease. Biochimica et Biophysica Acta (BBA)-Gene Regulatory Mechanisms, 1779(8): 471-478.
DOI:10.1016/j.bbagrm.2007.12.006 |
Fleming J L, Gable D L, Samadzadeh-Tarighat S, Cheng L K, Yu L B, Gillespie J L, Toland A E. 2013. Differential expression of miR-1, a putative tumor suppressing microRNA, in cancer resistant and cancer susceptible mice. PeerJ, 1: e68.
DOI:10.7717/peerj.68 |
Frazier T P, Xie F L, Freistaedter A, Burklew C E, Zhang B H. 2010. Identification and characterization of microRNAs and their target genes in tobacco (Nicotiana tabacum). Planta, 232(6): 1 289-1 308.
DOI:10.1007/s00425-010-1255-1 |
Gokhale A, Kunder R, Goel A, Sarin R, Moiyadi A, Shenoy A, Mamidipally C, Noronha S, Kannan S, Shirsat N V. 2010. Distinctive microRNA signature of medulloblastomas associated with the WNT signaling pathway. Journal of Cancer Research and Therapeutics, 6(4): 521.
DOI:10.4103/0973-1482.77072 |
Gong J, Tong Y, Zhang H M, Wang K, Hu T, Shan G, Sun J, Guo A Y. 2012. Genome-wide identification of SNPs in microRNA genes and the SNP effects on microRNA target binding and biogenesis. Human Mutation, 33(1): 254-263.
DOI:10.1002/humu.21641 |
Han J, Li A Y, Liu H, Wen X C, Zhao M Z, Korir N B, Korir N K, Wang C, Fang J G. 2014a. Computational identification of microRNAs in the strawberry (Fragaria x ananassa) genome sequence and validation of their precise sequences by miR-RACE. Gene, 536(1): 151-162.
DOI:10.1016/j.gene.2013.11.023 |
Han J, Xie H, Kong M L, Sun Q P, Li R Z, Pan J B. 2014b. Computational identification of miRNAs and their targets in Phaseolus vulgaris. Genetics and Molecular Research, 13(1): 310-322.
DOI:10.4238/2014.January.17.16 |
Hannon G J. 2002. RNA interference. Nature, 418(6894): 244-251.
DOI:10.1038/418244a |
He L, Hannon G J. 2004. MicroRNAs:small RNAs with a big role in gene regulation. Nature Reviews Genetics, 5(7): 522-531.
DOI:10.1038/nrg1379 |
Hu S L, Cui G L, Huang J, Jiang J G, Wang D W. 2016. An APOC3 3'UTR variant associated with plasma triglycerides levels and coronary heart disease by creating a functional miR-4271 binding site. Scientific Reports, 6: 32 700.
DOI:10.1038/srep32700 |
Hu Y, Yu C Y, Wang J L, Guan J, Chen H Y, Fang J Y. 2014. MicroRNA sequence polymorphisms and the risk of different types of cancer. Scientific Reports, 4: 3 648.
DOI:10.1038/srep03648 |
Huang Y, Cheng J H, Luo F N, Pan H, Sun X J, Diao L Y, Qin X J. 2016. Genome-wide identification and characterization of microRNA genes and their targets in large yellow croaker (Larimichthys crocea). Gene, 576(1): 261-267.
DOI:10.1016/j.gene.2015.10.044 |
Huang Y, Zou Q, Tang S M, Wang L G, Shen X J. 2010. Computational identification and characteristics of novel microRNAs from the silkworm (Bombyx mori L.). Molecular Biology Reports, 37(7): 3 171-3 176.
DOI:10.1007/s11033-009-9897-4 |
Hwang H W, Mendell J T. 2006. MicroRNAs in cell proliferation, cell death, and tumorigenesis. British Journal of Cancer, 94(6): 776-780.
DOI:10.1038/sj.bjc.6603023 |
Jiang J, Jia Z F, Cao D H, Wu Y H, Sun Z W, Cao X Y. 2016. Association of the miR-146a rs2910164 polymorphism with gastric cancer susceptibility and prognosis. Future Oncology, 12(19): 2 215-2 226.
DOI:10.2217/fon-2016-0224 |
Kozomara A, Griffiths-Jones S. 2014. miRBase:annotating high confidence microRNAs using deep sequencing data. Nucleic Acids Research, 42(D1): D68-D73.
DOI:10.1093/nar/gkt1181 |
Lagos-Quintana M, Rauhut R, Lendeckel W, Tuschl T. 2001. Identification of novel genes coding for small expressed RNAs. Science, 294(5543): 853-858.
DOI:10.1126/science.1064921 |
Lai X, Wolkenhauer O, Vera J. 2016. Understanding microRNA-mediated gene regulatory networks through mathematical modelling. Nucleic Acids Research, 44(13): 6 019-6 035.
DOI:10.1093/nar/gkw550 |
Lee R C, Feinbaum R L, Ambros V. 1993. The C.elegans heterochronic gene lin-4 encodes small RNAs with antisense complementarity to lin-14. Cell, 75(5): 843-854.
DOI:10.1016/0092-8674(93)90529-Y |
Lenkala D, LaCroix B, Gamazon E R, Geeleher P, Im H K, Huang R S. 2014. The impact of microRNA expression on cellular proliferation. Human Genetics, 133(7): 931-938.
DOI:10.1007/s00439-014-1434-4 |
Lewis B P, Burge C B, Bartel D P. 2005. Conserved seed pairing, often flanked by adenosines, indicates that thousands of human genes are microRNA targets. Cell, 120(1): 15-20.
DOI:10.1016/j.cell.2004.12.035 |
Li D D, Liu Z C, Gao L, Wang L F, Gao M J, Jiao Z J, Qiao H L, Yang J W, Chen M, Yao L G, Liu R Y, Kan Y C. 2016a. Genome-Wide Identification and Characterization of microRNAs in Developing Grains of Zea mays L. PLoS One, 11(4): e0153168.
DOI:10.1371/journal.pone.0153168 |
Li D R, Zhu G Y, Di H Q, Li H, Liu X Y, Zhao M, Zhang Z H, Yang Y H. 2016b. Associations between genetic variants located in mature microRNAs and risk of lung cancer. Oncotarget, 7(27): 41 715-41 724.
DOI:10.18632/oncotarget.9566 |
Li S C, Chan W C, Ho M R, Tsai K W, Hu L Y, Lai C H, Hsu C N, Hwang P P, Lin W C. 2010. Discovery and characterization of medaka miRNA genes by next generation sequencing platform. BMC Genomics, 11(S4): S8.
DOI:10.1186/1471-2164-11-S4-S8 |
Liu C X, Zhang F Q, Li T T, Lu M, Wang L F, Yue W H, Zhang D. 2012. MirSNP, a database of polymorphisms altering miRNA target sites, identifies miRNA-related SNPs in GWAS SNPs and eQTLs. BMC Genomics, 13: 661.
DOI:10.1186/1471-2164-13-661 |
Liu Q P, Wang H, Zhu L Y, Hu H C, Sun Y Q. 2013. Genomewide identification and analysis of miRNA-related single nucleotide polymorphisms (SNPs) in rice. Rice, 6: 10.
DOI:10.1186/1939-8433-6-10 |
Ng K L, Mishra S K. 2007. De novo SVM classification of precursor microRNAs from genomic pseudo hairpins using global and intrinsic folding measures. Bioinformatics, 23(11): 1 321-1 330.
DOI:10.1093/bioinformatics/btm026 |
Nicoloso M S, Sun H, Spizzo R, Kim H, Wickramasinghe P, Shimizu M, Wojcik S E, Ferdin J, Kunej T, Xiao L C, Manoukian S, Secreto G, Ravagnani F, Wang X M, Radice P, Croce C M, Davuluri R V, Calin G A. 2010. Singlenucleotide polymorphisms inside microRNA target sites influence tumor susceptibility. Cancer Research, 70(7): 2 789-2 798.
DOI:10.1158/0008-5472.CAN-09-3541 |
Ou J T, Li Y, Ding Z F, Xiu Y J, Wu T, Du J, Li W J, Zhu H X, Ren Q, Gu W, Wang W. 2013. Transcriptome-wide identification and characterization of the Procambarus clarkii microRNAs potentially related to immunity against Spiroplasma eriocheiris infection. Fish & Shellfish Immunology, 35(2): 607-617.
DOI:10.1016/j.fsi.2013.05.013 |
Patanun O, Lertpanyasampatha M, Sojikul P, Viboonjun U, Narangajavana J. 2013. Computational identification of microRNAs and their targets in cassava (Manihot esculenta Crantz.). Molecular Biotechnology, 53(3): 257-269.
DOI:10.1007/s12033-012-9521-z |
Prakash P, Rajakani R, Gupta V. 2016. Transcriptome-wide identification of Rauvolfia serpentina microRNAs and prediction of their potential targets. Computational Biology and Chemistry, 61: 62-74.
DOI:10.1016/j.compbiolchem.2015.12.002 |
Qi P Z, Guo B Y, Zhu A Y, Wu C W, Liu C L. 2014. Identification and comparative analysis of the Pseudosciaena crocea microRNA transcriptome response to poly(I:C) infection using a deep sequencing approach. Fish & Shellfish Immunology, 39(2): 483-491.
DOI:10.1016/j.fsi.2014.06.009 |
Saunders M A, Liang H, Li W H. 2007. Human polymorphism at microRNAs and microRNA target sites. Proceedings of the National Academy of Sciences of the United States of Amaerica, 104(9): 3 300-3 305.
DOI:10.1073/pnas.0611347104 |
Shastry B S. 2009. SNPs: impact on gene function and phenotype. In: Komar A ed. Single Nucleotide Polymorphisms. Humana Press, Totowa, NJ, USA. p. 3-22, https://doi.org/10.1007/978-1-60327-411-1_1.
|
Shivdasani R A. 2006. MicroRNAs:regulators of gene expression and cell differentiation. Blood, 108(12): 3 646-3 653.
DOI:10.1182/blood-2006-01-030015 |
Tong C Z, Jin Y F, Zhang Y Z. 2006. Computational prediction of microRNA genes in silkworm genome. Journal of Zhejiang University SCIENCE B, 7(10): 806-816.
DOI:10.1631/jzus.2006.B0806 |
Tüfekci K U, Meuwissen R L J, Genç Ş. 2014. The role of microRNAs in biological processes. In: Yousef M, Allmer J eds. miRNomics: MicroRNA Biology and Computational Analysis. Humana Press, Totowa, NJ, USA. p. 15-31, https://doi.org/10.1007/978-1-62703-748-8_2.
|
Wan L C, Zhang H Y, Lu S F, Zhang L, Qiu Z B, Zhao Y Y, Zeng Q Y, Lin J X. 2012. Transcriptome-wide identification and characterization of miRNAs from Pinus densata. BMC Genomics, 13: 132.
DOI:10.1186/1471-2164-13-132 |
Xiao S J, Han Z F, Wang P P, Han F, Liu Y, Li J T, Wang Z Y. 2015. Functional marker detection and analysis on a comprehensive transcriptome of large yellow croaker by next generation sequencing. PLoS One, 10(4): e0124432.
DOI:10.1371/journal.pone.0124432 |
Xu W, Cui Q H, Li F, Liu A Z. 2013. Transcriptome-wide identification and characterization of microRNAs from castor bean (Ricinus communis L.). PLoS One, 8(7): e69995.
DOI:10.1371/journal.pone.0069995 |
Xu Y C, Chu L L, Jin Q J, Wang Y J, Chen X, Zhao H, Xue Z Y. 2015. Transcriptome-wide identification of miRNAs and their targets from Typha angustifolia by RNA-Seq and their response to cadmium stress. PLoS One, 10(4): e0125462.
DOI:10.1371/journal.pone.0125462 |
Yang Z H, Wang L. 2011. Regulation of microRNA expression and function by nuclear receptor signaling. Cell & Bioscience, 1: 31.
DOI:10.1186/2045-3701-1-31 |
Yao S M. 2016. MicroRNA biogenesis and their functions in regulating stem cell potency and differentiation. Biological Procedures Online, 18: 8.
DOI:10.1186/s12575-016-0037-y |
Zheng W B, Liu G Z, Ao J Q, Chen X H. 2006. Expression analysis of immune-relevant genes in the spleen of large yellow croaker (Pseudosciaena crocea) stimulated with poly I:C. Fish & Shellfish Immunology, 21(4): 414-430.
DOI:10.1016/j.fsi.2006.01.006 |
Zhou M, Wang Q H, Sun J, Li X, Xu L D, Yang H X, Shi H B, Ning S W, Chen L, Li Y, He T T, Zheng Y. 2009. In silico detection and characteristics of novel microRNA genes in the Equus caballus genome using an integrated ab initio and comparative genomic approach. Genomics, 94(2): 125-131.
DOI:10.1016/j.ygeno.2009.04.006 |
Zhu Y P, Xue W, Wang J T, Wan Y M, Wang S L, Xu P, Zhang Y, Li J T, Sun X W. 2012. Identification of common carp(Cyprinus carpio) microRNAs and microRNA-related SNPs. BMC Genomics, 13: 413.
DOI:10.1186/1471-2164-13-413 |