 2018, Vol. 36
Institute of Oceanology, Chinese Academy of Sciences
Article Information
- CHEN Weizhong(陈卫忠), Hussain AL-FOUDARI
- Model simulations to determine optimal fishing effort and season duration for a tropical shrimp fishery
- Chinese Journal of Oceanology and Limnology, 36(5): 1860-1869
- http://dx.doi.org/10.1007/s00343-018-7101-1
Article History
- Received Apr. 6, 2017
- accepted in principle Jul. 3, 2017
- accepted for publication Sep. 12, 2017


Fisheries are the most important naturally occurring renewable food resources in Kuwait, and shrimps rank first in value. Shrimp catch represents 25% to 45% of the total fishery landings and 37% to 50% of the total fishery product value (Al-Foudari et al., 2013a; Chen et al., 2013).
Kuwait's shrimp trawl fishery consists of two types of fleet: the industrial steel boats and artisanal fiberglass (dhow) boats. The fishery targets on three shrimp species: the green tiger prawn (Penaeus semisulcatus), jinga shrimp (Metapenaeus affinis) and kiddi shrimp (Parapenaeopsis stylifera), with the majority of catch being P. semisulcatus (Ye et al., 1999). Thus, Kuwait shrimp fishery presents typical tropical and subtropical shrimp fishery characteristics with highly variable recruitment, fast growth and strong seasonal patterns (Ye, 1998).
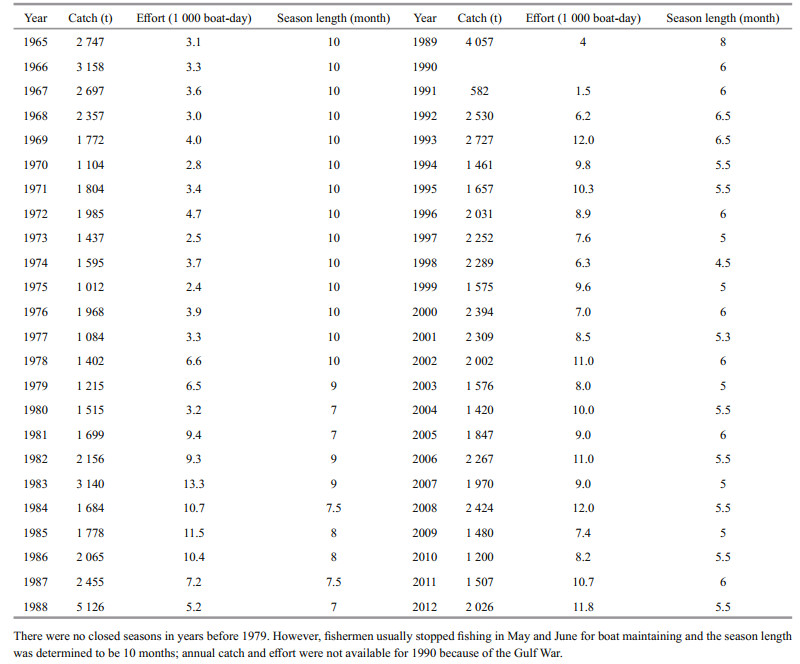
The total landings of shrimps has fluctuated between 1 012 and 5 126 t since 1965 except the 1990 and 1991, which were affected by the first Gulf War. Although the Maximum Sustainable Yield (MSY) had been estimated to be 2 460 t annually (Mathews and Samuel, 1989), total shrimp catch has been below MSY since 1994 (Table 1). The low catches are probably caused by overfishing and changes of environmental conditions such as the decline of the discharge of the Shatt Al-Arab (river) as a result of dam construction on the Euphrates, Tigris, and Karun rivers in Turkey, Iran, Syria and Iraq (Maltby, 1994), destruction of nursery grounds caused by coastal development and pollution (Bishop et al., 1995).
|
The Kuwait's shrimp fishery has experienced great changes since its inception in the late 1950s. The major component of the fishery, the industrial fleet, has become less important due to its reduced catch contribution from about 80% (before the Gulf War of 1991) to less than 50% (after the Gulf War) of the total shrimp landings. While the traditional dhow fishery has expanded both its fleet and vessel sizes, with registered dhow trawlers increased from 26 to 45. Total dhow trawlers may have tripled in number during the past two decades if the dhows not licensed to trawl are included. Over the years, dhow boats have became larger with more powerful engines, increasing from an average length and horsepower of 10 m and 35 hp in the late 1960s to 19 m and 250 hp by the mid 1990s, and to 21 m and 388 hp in recent years. Thus, dhow boats now directly compete with the industrial vessels and have increased their catch share to more than 50%. Another change is the fishing grounds. Previous fishing activities mostly concentrated in Kuwait's territorial waters. Catches from outside "international" waters were limited. With decreased catch rate in territorial waters, however, fishing activities and landings from "international" waters has greatly increased. During the 2011-12 season, catches from "international" waters represent 43% of the total shrimp landings (Al-Foudari et al., 2013b). In the same time, the catch from Kuwait's territorial waters has been declining and actually decreased to less than 1 000 t, which is lower than the lowest historical annual landings of 1 012 t in 1975. Present fishing effort far exceeds the effort for MSY (fMSY) with catches from Kuwait's territorial waters well below the MSY indicating that shrimp stocks are overfished. To allow the shrimp stocks to recover and maintain a sustainable fishery, the fishery management should be improved. For this purpose, we conducted shrimp stock assessment using both General Production Model and Age-structured Model based on the latest landings and effort data. Model simulations to determine the optimal fishing effort and season duration were also conducted. Based on these results, we recommend some management advices for the Kuwait' shrimp fishery.
2 MATERIAL AND METHOD 2.1 General production model 2.1.1 Data requiredThe General Production Model requires a time series of catch-and-effort data. Shrimp catch and effort from 1965 to 2012 for Kuwait's shrimp fishery were used in our study (Table 1). The monthly catch data are available from the Central Statistic Bureau (CSB) of Kuwait's Ministry of Planning, however, the annual catch we used denotes the catch from a whole shrimp season which may start from the middle of a year through the early month of the following year. The fishing effort also denotes the effort from a season and effort data are estimated from regular interviews with the fishermen by fisheries scientists in the Kuwait Institute for Scientific Research and have been revised based on a recently-conducted, comparative trawl experiment. The fishing effort is expressed as boat-days for a double-rigged steel vessel from the largest fishing company in Kuwait, the United Fisheries of Kuwait (UFK). Fishing effort from other fleets have been converted to the standard UFK boat-days according to the relative fishing power among the different vessels. For example, one dhow boat-day equals 0.594 UFK (standard) boatday, which was obtained by comparing average catch rates from different fishing vessels in a comparative trawling experiment.
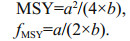
2.1.2 ModelsThe Schaefer model was used to estimate the Maximum Sustainable Yield (MSY) and its corresponding fishing effort (fMSY). The model stands as follow:

where, dependent variable Y/f is the catch per unit effort (CPUE), independent variable f is the fishing effort. Constant parameters a and b can be estimated through fitting the model using the time series CPUE and effort data. The MSY and fishing effort for MSY (fMSY) can be estimated using the following equations:
The Schaeffer model was fitted using the Excel Solver (Excel 2007®) together with the likelihood tool in Excel PopTools. The upper and lower 95% confidence limits for the estimated parameters a and b were obtained using likelihood profile in Excel PopTools. The upper and lower 95% confidence limits for MSY and fMSY were calculated based on the above equations and the upper and lower 95% confidence limits for a and b.
2.2 Age-structured Models 2.2.1 Data required(1) Estimated parameters of seasonal vonBertalanffy growth equations for both male and female shrimp (L∞, k, t0, ts and C) (Table 2, after Ye et al., 2003).

|
(2) Estimated parameters of length-weight relationships for both male and female shrimps (a and b) (Table 2, after Chen et al., 2007).
(3) Same time series catch and effort used in Production Models (Table 1).
(4) Average price of shrimp in Kuwait Dinars (KD 1≈US $3.4) from different month (Table 3).

|
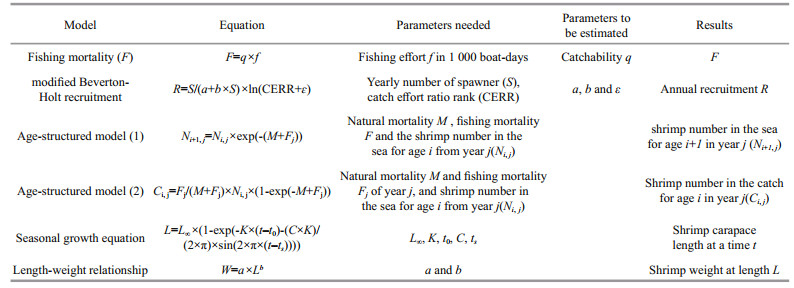
Various models were used in our model system and fitting (Table 4). After the Age-structured Model system with different models had been established, the predicted catches were compared with the actual catches when fitting the age-structured models using the likelyhood method to obtain the four needed parameters (catchability q in fishing equation F=qf, a, b and ε in the modified Beverton-Holt recruitment equation).
|
Stock assessment was conducted on a monthly basis. First, we gave initial values to the four parameters we needed to estimate. With the initial q, we obtained the annual fishing mortality for each year by F=qf. The monthly fishing effort Fm from every month was obtained by yearly fishing mortality Fy divided by the season length (the number of months).
The modified Beverton-Holt recruitment model (Chen et al., 2007) was used to establish the relationship between recruitment and the number of shrimp spawner.
The catch and effort rank ratio (CERR =Reffort/Rcatch) of a year is a relative abundance index reflecting the success of shrimp recruitment from that year (Beverton and Holt, 1966; Chen and Ye, 2003).
Parameter ε is a weight factor to adjust the effect on recruitment from CERR in the stock-recruitment relationship.
The recruitment of shrimps (mainly P.semisulcatus) is believed to be affected by both spawning stocks and environmental conditions (Morgan and Garcia, 1982; Morgan, 1989; Ye et al., 1999). That is, adequate spawning biomass is necessary, but proper environmental conditions to ensure successful recruitment are also important. The traditional Beverton-Holt recruitment model R=S/(a+bS) only explains how recruitment is affected by spawning stocks under normal (average) environmental conditions. To overcome this shortcoming, we included a factor ln(CERR+ε) to explain the relative recruitment fluctuations, which are probably caused by the environmental changes, around a traditional Beverton-Holt spawner-recruitment relationship. Use of logarithm and the parameter ε results in the values of ln(CERR+ε) varying around 1.0 to simulate the effects of environmental factors on recruitment success.
Given any number as the number of the spawner for the first year of calculation, the number of recruits of the following year can be calculated with the modified Beverton-Holt spawner-recruitment relationship equation. We assumed that the initial shrimp number in March represents recruitment. With this initial recruit number, the surviving shrimp (in number) in the sea with or without fishing and the estimated number of shrimp in the catch from different months after March for each year were calculated using Age-structured Models (1) and (2). The monthly biomass and catch weight were calculated using the estimated number multiplied by the average weight for the shrimp in the sea or in the catch from that month. The average weights were calculated based on the average length of shrimp from that month and the length-weight relationship. By totaling all the catch weight in all months of a season, we obtained the estimated yearly catch for that season.
Because the growth and length-weight relationships of male and female P. semisulcatus are quite different, the calculation of male and female shrimp number and weight in the sea and in the catch were conducted separately (we assumed that the sex ratio of the recruitment from each year was 1:1 and used 50% of total recruitment as the male or female recruitment).
When the best fitting models established, the MSY and its corresponding fishing effort (fMSY) were obtained by maximizing the predicted catch with change of fishing effort in the years from 2013 to 2025 (using MS Excel Solver).
The predicted number for recruitment, biomass and possible catch under different levels of fishing effort from year 2013 to 2025 were calculated using model simulations. For prediction, we assumed that every season after 2013 will be same as the season of 2012 (i.e., opens on 1st August and closes on 16 January of the following year). Different fishing effort levels from 1 000 to 30 000 boat-days were used in our model simulation.
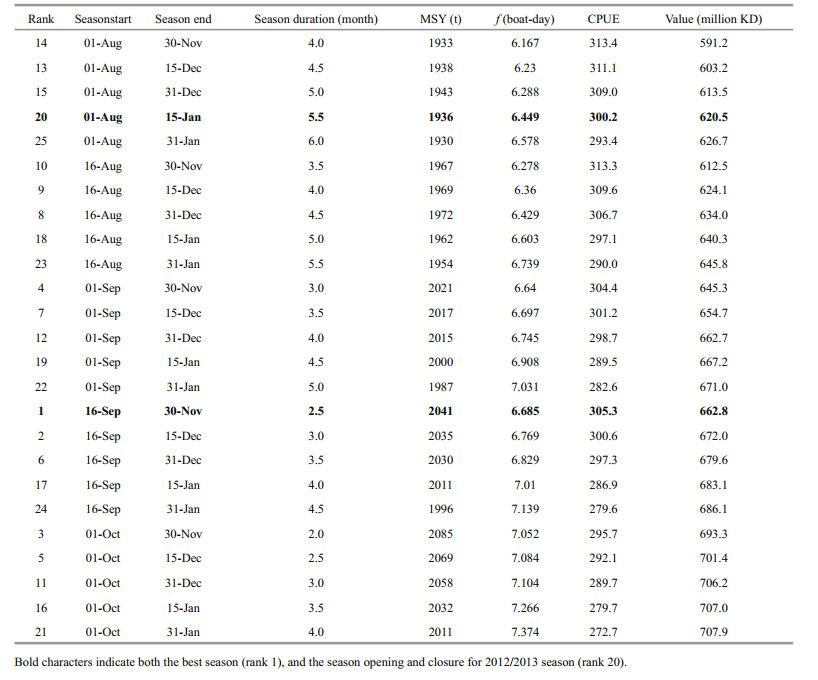
Model simulations were also conducted to determine the best fishing season. The change of fishing season from 2013 to 2025 were simulated by shifting both season opening and closing dates with half-month intervals. With each change of fishing season (either opening date or that of closing), the MSY, fMSY, CPUE and catch value were estimated. The value of the catch was estimated using monthly catch weight multiplied by the average shrimp price of that month (Table 3).
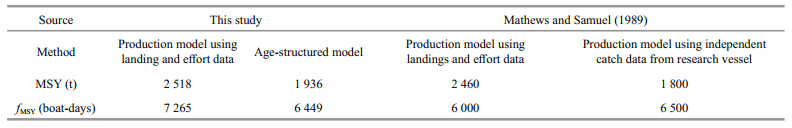
3 RESULT 3.1 General production modelWith available catch and effort data, the parameters a and b, the Maximum Sustainable Yield (MSY), the fishing effort necessary to achieve MSY (fMSY), and the upper and lower 95% confidence limits for these estimates are estimated using the Schaeffer Production Model (Table 5, Fig. 1). The estimated MSY is 2 518 t with a corresponding effort 7 265 standard boat-days.

|

|
| Figure 1 Estimated Maximum Sustainable Yield (MSY) and its corresponding fishing effort to achieve MSY for the Kuwait's shrimp fishery using Schaefer model and the catch and effort data from 1965 to 2012 |
The relationship between catch per unit effort (Y/f=CPUE) and fishing effort (f) for Kuwait's shrimp fishery showed a clear linear declining trend with an increase of fishing effort (Fig. 2). This indicated that shrimp abundance declined in a linear manner with the increased fishing effort and that the present fishing effort was too high to obtain a high catch per unit effort (Y/f).

|
| Figure 2 Relationship between catch per unit effort (Y/f) and fishing effort (f) for Kuwait's shrimp fishery showing a linear declining trend with the increase of fishing effort |
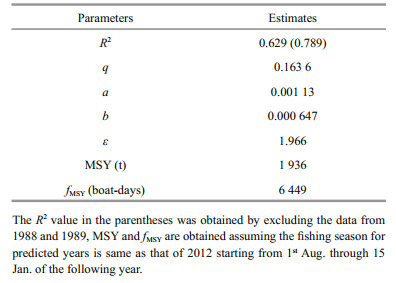
The estimated four parameters q, a, b and ε are listed in Table 6. The model fitting was well with a R2=0.629 for the relationship between estimated and observed catches (Table 6, Fig. 3). The fitting was improved if the data from two years (1988 and 1989) with very high catch were excluded (Fig. 3). The fitted spawning stock-recruitment relationship showed a loose relation (Fig. 4). The estimated biomass from 1965 to 2012 showed a declining trend (Fig. 5).

|
| Figure 3 Relationship between estimated catch and observed catch, the fitting was improved if the data from two years (1988 and 1989) with very high catch were excluded |

|
| Figure 4 Relationship between the estimated recruitment and spawner |

|
| Figure 5 Estimated biomass showed a declining trend from 1965 to 2012 |
The estimated MSY is 1936 t with a fishing effort (fMSY) 6 449 boat-days if the current opening and closing dates of shrimp season are maintained (i.e. 1st August through 15 January of the following year), but will increase slightly to 2 085 t and 7 052 boat-days with a shorter season scenario (1st October through 30 November; Table 7).
|
The results from model simulation with different fishing effort scenarios from 2013 up to 2025 show that reducing fishing effort will greatly increase both recruitment and biomass, and slightly increase catch, increasing fishing effort will reduce all recruitment, biomass and catch, especially if fishing effort is increased to 30 000 boat-days, the shrimp stocks will collapse because all recruitment, biomass and catch will approach zero (Fig. 6 to Fig. 8).

|
| Figure 6 Predicted recruits from year 2013 up to 2025 under different levels of fishing effort |

|
| Figure 7 Predicted biomass from year 2013 up to 2025 under different levels of fishing effort |

|
| Figure 8 Predicted catch from 2013 up to 2025 under different levels of fishing effort |
Model simulation for the best season show that either delaying opening or closing earlier or both will increase the MSY, and the shorter the season, the higher the MSY. The best season considering only MSY would be from 1st October through 30 November. A season opening on 1st August would result in low MSY regardless of the closing date (Table 7). CPUE also changes with the change of season, the earlier the season, the higher the CPUE. While the total value of the catch is related to season opening, the later the season, the higher the value. This is certainly related to shrimp size, which in term determines the price. A later season means larger size and higher price for the captured shrimp. The overall rank indicates that the best season will be from 16 September to 30 November, if both the biological aspects (high MSY and CPUE) and economic aspects [high product value and low cost (effort)] are considered (Table 7).
4 DISCUSSIONBoth General Production Model and Age-structured Model showed that MSY could be obtained at fishing effort around 7 000 boat-days. However, the Production Model gave higher MSY than Age-structured Model with slightly higher effort (Table 8). These results are similar to those previously reported (Mathews and Samuel, 1989, Table 8) and indicate that the MSY for Kuwait's shrimp fishery is most likely within the range of 1 800–2 500 t with necessary fishing effort around 6 500 boat-days. Comparing with these results, we conclude that the total shrimp landings were low and the effort was too high in recent years (Table 1), and the shrimp fishery is overfished.
|
Both the annual catch rates and the estimated biomass from Age-structured-Model showed declining trends since 1965 (Fig. 5), and indicates a likely decline in shrimp abundance and possibly a general decline in fisheries productivity in this region. This declining trend was observed for several key commercial species in this region and is probably caused by both overfishing and many environmental factors such as reduced discharge of Shatt Al-Arab, loss of nursery habitat caused by coastal development etc. (Bishop, 1999).
Although, the total annual landings by the shrimp fishery showed no significant decline in the past two decades (Table 1), catches from Kuwait's territorial waters have been declining and catches from outside "international" waters have been increasing. At present, landings from "international" waters contribute about 50% of the total shrimp landings in Kuwait. The shrimp catch from Kuwait's territorial waters has actually decreased to less than 1 000 t, which is lower than the lowest historical annual landings of 1 012 t in 1975 (Table 1). Present fishing effort far exceeds the effort for MSY (fMSY) with catches from Kuwait's territorial waters well below the estimated MSY indicating that shrimp stocks are overfished. To allow the shrimp stocks to recover and maintain a sustainable fishery, we recommend that the total fishing effort should be reduced to 6 000 boatdays, which could be accomplished by simply restricting trawling activities to only those vessels licensed to trawl.
The model simulations showed little decline in catch while greatly reducing fishing effort. This suggests that much higher fishing efficiency and subsequently higher fishery profit can be obtained if fishing effort is reduced. Meanwhile, model simulations also show that both recruitment and biomass will greatly increase if fishing effort is reduced from fMSY down to 3 000 and 1 000 boat-days. Higher levels of recruitment and biomass are crucial to maintain a sustainable fishery and will result higher annual yields in the long-term.
The present fishing season (2012/2013) which started on 1st August and closes on 16 January ranks 20 in our model simulation and resulted in low MSY and economic value. We recommend that the season opening be delayed and season closure advanced to reduce the season duration. With a reduced season, the fishing cost will be reduced, and the catch rate, biomass, yield (MSY) and fisheries profit will be increased. Best of all, a long-term sustainable shrimp fishery can be maintained.
Some previous studies (Morgan and Garcia, 1982; Morgan, 1989; Ye et al., 1999) and this study showed some environmental factors might also affect the recruitment of Kuwait's shrimp stocks (mainly P. semisulcatus) besides their spawning stocks. However, the exact environmental factors affecting the recruitment of shrimp stocks are unknown. We recommend that further studies should focus on the identification of these factors and to include them in the models to improve the assessing results.
5 CONCLUSIONThe estimated MSY for Kuwait's shrimp fishery is between 1 800–2 500 t and fMSY is around 6 500 UFK standard boat-days. The present catch was low and the fishing effort was too high, which indicates that the shrimp stocks are overfished.
Both the catch rates and estimated biomass of shrimps showed a declining trend, which is similar to that of many other key commercial species in this region. This indicates a decline in fisheries productivity probably caused by overfishing and environmental factors such as reduced discharge of Shatt Al-Arab, coastal development and climate change.
Fishing effort should be reduced to 6 000 boat-days to encourage the recovery of shrimp stocks and to obtain MSY. The reduction of fishing effort can be accomplished by restricting trawling activities to only those vessels licensed to trawl. For a long-term sustainable and high yield shrimp fishery, fishing effort should be reduced to greatly increase recruitment and biomass of the shrimp stocks.
The present fishing season should be shortened by delaying the opening and advancing the closure to increase shrimp size and reduce fishing cost to improve economic efficiency.
The exact environmental factors affecting the success of shrimp recruitment should be identified in a future study and be included in our established models to improve assessing results.
6 DATA AVAILABILITY STATEMENTThe annual Kuwait's shrimp landings are available in the Annual Bulletin of Fisheries Statistics published by the Central Statistic Bureau of State of Kuwait from website https://www.csb.gov.kw/Socan_Statistic_EN.aspx?ID=43.
The fishing effort data for Kuwait shrimp fishery is available from the corresponding author on reasonable request.
7 ACKNOWLEDGEMENTWe thank our colleague James Bishop for reviewing our manuscript.
Al-Foudari H M, Alsaffar A H, Bishop J M, Chen W Z, AlJazzaf S T, Deshti T, Al-Alawi A, Taqi A. 2013a. A comprehensive management strategy for long-term sustainability of Kuwait's shrimp stocks. Final Report(FM047C), Report No. KISR11676, Kuwait Institute for Scientific Research, Kuwait.
|
Al-Foudari H M, Bishop J M, Chen W. 2013b. The status of Kuwait's 2011/2012 shrimp fisheries. Basra J. Agric., 26: 283-305.
|
Beverton R J H, Holt S J. 1966. Manual of methods for fish stock assessment. Part 2. Tables of yield functions. FAO Fish. Tech. Pap. No. 38 (Rev. 1).
|
Bishop J M, Kwarteng A Y, Al-Yakoob S, Abdeli F, Jacob P G, Al-Matrouk K, Alsaffar A H. 1995. Post-war survey and evaluation of Kuwait's shrimp nursery grounds with emphasis on those South of Kuwait Bay, Phase Ⅱ. Final Report (MB-77), Report No. KISR4748, Kuwait Institute for Scientific Research, Kuwait.
|
Bishop J M. 1999. Current and planned coastal urban development. Development study for the optimal utilization of the marine environment. Task 2. Current and planned utilization and management of Kuwait's marine environment. Report No. KISR5511, Kuwait Institute for Scientific Research, Kuwait.
|
Chen W Z, Al-Husaini M, Al-Foudari H M. 2007. Using agestructured models to develop a stock recovery strategy for Kuwait's shrimp fishery. Fish. Res., 83(2-3): 276-284.
DOI:10.1016/j.fishres.2006.10.003 |
Chen W Z, Almatar S, Alsaffar A, Yousef A R. 2013. Retained and discarded bycatch from Kuwait's shrimp fishery. Aquatic Science and Technology, 1(1): 86-100.
|
Chen Y, Ye Y. 2003. Evaluation of changes in the Kuwaiti prawn fishery after the 1991 Gulf War. Aquatic Sciences, 65(2): 167-180.
DOI:10.1007/s00027-003-0636-y |
Maltby E. 1994. An Environmental & Ecological Study of the Marshlands of Mesopotamia. The AMAR Appeal Trust, London.
|
Mathews C P, Samuel M. 1989. The relation between by-catch, shrimp catches and shrimp landings in Kuwait. Kuw. Bull.Mar. Sci., 10: 135-146.
|
Morgan G R, Garcia S M. 1982. The relationship between stock and recruitment in the shrimp stocks of Kuwait and Saudi Arabia. Océanographie Tropicale, 17(2): 133-137.
|
Morgan G R. 1989. Separating environmental and fisheries effects in the recruitment of Gulf shrimp. Kuw. Bull. Mar.Sci., 10: 51-59.
|
Ye Y, Al-Foudari H M, Bishop J M. 1999. Shrimp resources and fisheries in Kuwait waters. Technical Report, Report No. KISR 5473, Kuwait Institute for Scientific Research, Kuwait.
|
Ye Y, Bishop J M, Fetta N, Abdulqader E, Al-Mohammadi J, Alsaffar A H, Almatar S. 2003. Spatial variation in growth of the green tiger prawn (Penaeus semisulcatus) along the coastal waters of Kuwait, eastern Saudi Arabia, Bahrain, and Qatar. ICES Journal of Marine Science, 60(4): 806-817.
DOI:10.1016/S1054-3139(03)00072-9 |
Ye Y. 1998. Assessing effects of closed seasons in tropical and subtropical penaeid shrimp fisheries using a length-based yield-per-recruit model. ICES Journal of Marine Science, 55(6): 1112-1124.
DOI:10.1006/jmsc.1998.0415 |