 2018, Vol. 36
Institute of Oceanology, Chinese Academy of Sciences
Article Information
- YE Liping(叶利萍), ZHANG Ruifeng(张瑞峰), SUN Qizhen(孙启振), JIN Jie(金杰), ZHANG Jing(张经)
- Hydrochemistry of the meltwater streams on Fildes Peninsula, King George Island, Antarctica
- Chinese Journal of Oceanology and Limnology, 36(6): 2181-2193
- http://dx.doi.org/10.1007/s00343-019-7193-2
Article History
- Received Jul. 3, 2017
- accepted in principle Aug. 30, 2017
- accepted for publication Nov. 27, 2017


2 Institute of Oceanography, Shanghai Jiao Tong University, Shanghai 200030, China;
3 Department of Polar Research and Forecast, National Marine Environmental Forecasting Center, Beijing 100081, China
The Intergovernmental Panel on Climate Change (IPCC) reported that mean global warming was 0.6±0.2℃ during the 20th century (Vaughan et al., 2003). The Antarctic Peninsula has experienced some of the most rapid air temperature increases on Earth: 2℃ over the past 40–50 years (Quayle et al., 2002). As a result, accelerated glacier melting runoff and iceberg calving have occurred (Cook et al., 2005). These processes deliver more dissolved and particulate terrestrial materials to the adjacent seas. It may have significant ecological and geochemical impacts, thus affecting the carbon cycle and then feedback to global climate (Gerringa et al., 2012; Bhatia et al., 2013).
The hydrochemistry of glacier meltwater is a key parameter to understanding the feedback mechanism of glacier melting and evaluating its influence on the environment. Based on the characteristics and variation of meltwater hydrochemistry, we can infer the impact of climate change, chemical weathering, and the circulation among terrain-river-ocean system (Hu et al., 1982; Meybeck, 1987; Gaillardet et al., 1999; Ingri et al., 2005; Dong et al., 2017). In high latitude regions, ice caps and glaciers are the main land cover. Many studies on the hydrochemistry of glacial meltwater and its contribution to the surroundings have been conducted (Wadham et al., 1998; Borghini and Bargagli, 2004; Rückamp et al., 2011; Stumpf et al., 2012; Graly et al., 2014; Lim et al., 2014; Nowak and Hodson, 2014). Glacial meltwater features depend on glacier type and location (Fegel et al., 2016), and the melt snow and ice can perturb the glaciochemical record beyond the natural variability (Wong et al., 2013). It had been suggested that meltwater discharge and rock types are the principal driving factors contributing to chemical denudation; thus, researchers could investigate the chemical denudation and further estimate the rate of temporary CO2 drawdown (Sharp et al., 1995; Tranter, 1996; Hodson et al., 2000; Wadham et al., 2010; Graly et al., 2017; Torres et al., 2017). Bioavailable trace metals (e.g. Fe) delivered by meltwater are able to stimulate primary production, and thus lead to CO2 drawdown (Raiswell et al., 2008).
King George Island (KGI) is the largest island of the South Shetland, lying approximately 120 km north of the Antarctic Peninsula. Glaciers occupy 92% of King George Island (Leal et al., 2008). KGI covered with several connected icecaps. Collins Ice Cap is the most western icecap on KGI which directly connected with Arctowski Icefield (Rückamp et al., 2010). Small streams and lakes near icecap feed by glacial or snow meltwater are present in ice-free areas of the Antarctic during summer. A recent study has shown that the air temperature in KGI increased by 1.2℃ from the year of 1948 to 2011 (Kejna et al., 2013). Consequently, the estimated ice volume loss on KGI was approximately 20 km3 (~1.6% area of the island loss), from 2000 to 2008 (Rückamp et al., 2011). The seas adjacent to the Antarctic Peninsula (e.g., Drake Passage and southern Scotia Sea) host a number of biogeochemical hot spots that support primary and secondary productions (Zhou et al., 2013). Investigating the geochemical composition of runoffs and glacier meltwater on KGI is important in evaluating the role they play after draining into the adjacent seas.
Fildes Peninsula (FP) locates next to the Collins Ice Cap, is one of the largest ice free areas on KGI, and dominated by periglacial, glacial, fluvial, and coastal processes and landforms (Schmid et al., 2017). FP was originally a component part of volcanic island, and the main rock type on FP is basalt (Liu and Zheng, 1988). Permanent ice and snow cover about 7% of the landform on FP (Schmid et al., 2017). The annual number of air freeze-thaw cycles is 120 to 122 on FP (Schmid et al., 2017). FP is sensitive to the environment change, the meltwater of snow and ice and the icecap will alert the hydrology on FP. However, to the best of the authors knowledge, few documented comprehensive hydrochemistry studies was carried out on FP. Geochemical features of the runoffs on FP are important to reflect this rapid changing environment. To have a better understanding of the characteristics of polar glacier meltwater, the mechanism of the chemical weathering and the circulation of terrain-river-ocean system, in January to February, 2015, we investigated various types of water samples, including streams, meltwaters, ground waters, snow and ice around the Great Wall Station, Fildes Peninsula. Major ions, alkalinities, silicate, pH, dissolved oxygen, temperature, and electric conductivities were measured, in order to better understand the hydrochemical features on FP.
2 MATERIAL AND METHOD 2.1 Study areaFP (62°08′48″–62°14′02″S, 58°40′59″–59°01′50″W) is the largest ice-free area on the KGI, west of Antarctica. The surface area of FP is 29 km2 (Alfonso et al., 2015) (Fig. 1). The monitoring data at the Great Wall Station from 1985 showed that the temperature is as low as -26.6℃ in winter, and as high as 11.7℃ in summer. Wind speed at the Great Wall reaches up to 40.3 m/s, and the precipitation is approximately 630 mm per year. The main rock type on FP is basalt (Liu and Zheng, 1988). Glacier and snow melting occurs from November to March (Wen et al., 1998; Lim et al., 2014).
2.2 Sample collection, handling and storageThe expedition on FP was carried out from January to February 2015. 13 stream water samples were collected, while ground waters, meltwaters, ice and snow samples were collected during the expedition (Fig. 1). Meltwater samples were defined as the water samples taken directly from the outlets of the Collins ice cap. Stream water samples are main consisted of meltwater from icecap and also possibly influenced by groundwater and melting of snow and ice. To get the relationship of the influence factors in streams water, we investigate the geochemical temporal variations in Yuquan River. The time series sampling on the Yuquan River located near the "Great Wall Station." Our sampling strategy is described in Zhang et al. (2015). Briefly, water samples were collected using a 1-L precleaned polyethylene bottle held at the tip of a pole to avoid any contamination by hand. Samples were then carried back to the Chinese "Great Wall Station" and processed in the laboratory on shore. To avoid potential contamination, all water samples were filtered in a plastic covered space with filtered air blowing from an air filter. Samples were filtered with 0.4 μm polycarbonate membrane (Whatman, USA). Samples for major ion analysis were stored in precleaned polyethylene bottles. Samples for silicate analysis were stored in precleaned polyethylene bottles separately, with saturated HgCl2 added before storage.

|
| Fig.1 Sampling sites a. Antarctica; b. Antarctic Peninsula; c. King George Island; d. Sampling stations on the Fildes Peninsula (modified after Rückamp et al. (2011)). "QS" and "YQ" represent Qingshui River and Yuquan River, respectively. "ST", "MW", "GD" and "SI" represent stream water, meltwater, ground water, ice and snow, respectively (Here, we regard snow and ice as the same type of sample since there is no significant difference between the two types of samples, according to the independent-samples' t-test results; see Table S1 in the supplementary materials). Symbols on the map represent our sample locations. |
The pH, dissolved oxygen (DO), temperature (T) and electric conductivity (EC) were measured on site with a portable multifunction water quality meter (Multi 350i, WTW Company, Germany). Alkalinity was measured using the method described in Zhu et al. (2006); the relative standard deviation (RSD) of our measurement is 1.3%. To achieve more precise [HCO3-] data, we calculated [HCO3-] using different equations under different hydrological conditions (Li et al., 2013). pH ranged from 6.43 to 9.66, and all samples were fresh water in this study. When pH < 8, [CO32-] can be ignored, as [CO32-] is much lower in water than [HCO3-]. [HCO3-] can be calculated as Eq.1, where K w refers to the ionic product constant of water, and the values under different temperatures were obtained from Marshall and Franck (1981). When pH>8, [H+] can be further ignored. [HCO3-] is calculated by Eq.2, where K2 refers to dissociation constants of carbonic acid, which is calculated refers to the method described by Goyet and Poisson (1989) and Millero et al. (2006).
 (1)
(1) (2)
(2)Major ions (cations: Na+, K+, Mg2+, Ca2+; anions: Cl-, SO42-) were analyzed with an Ion Chromatograph (ICS-2000, Dionex). The standard solution used for Na+, K+, Mg2+, and Ca2+ was 1 000 mg/L (Anpel, China); the standard solution used for Cl- and SO42- was 1 000 mg/L (Merck, Germany). The precision and accuracy data are documented in supplementary Table S2. Total cation content was calculated as TC=Na++K++2Mg2++2Ca2+ and total anion content was calculated as TA=Cl-+2SO42-+HCO3-+2CO32-. TC/ TA ranged from 91% to 110% (the charge balance is shown in supplementary Fig.S1).
2.3.3 Silicate and Nitrate analysisSiO32- and NO3- were analyzed by continuous flow colorimetry (SAN SKALAR Plus). The detection limit was 0.005 mg/L with a RSD of 1% for SiO32- and 0.002 mg/L with a RSD of 3% for NO3-.
2.3.4 Air temperature, precipitation, and dischargeThe air temperature and precipitation data were extracted from ERA-Interim, which is a reanalysis system of the global atmosphere covering the datarich period since 1979, and continuing in real time. ERA-Interim represents a major undertaking by ECMWF (European Center for Medium-Range Weather Forecasts, 2009) to produce a reanalysis with an improved atmospheric model and assimilation system and will be continued as an ECMWF Climate Data Assimilation System (ECDAS) until superseded by a new extended reanalysis. More details of this dataset can be found in Dee et al. (2011).
The ERA-Interim data used in this research was downloaded from NCAR (National Center for Atmospheric Research). NCAR's Data Support Section (DSS) is performing and supplying a grid transformed version of ERA-Interim, in which variables originally represented as spectral coefficients are archived on a reduced Gaussian grid and transformed to a regular 512 longitude by 256 latitude N128 Gaussian grid. The air temperature and precipitation data are configured for a reduced Gaussian grid with approximately uniform 79 km spacing for surface fields. Temporal resolution is four analysis per day at 00, 06, 12 and 18 UTC.
The discharge of each stream was roughly estimated via the float method, which is calculated from the cross-sectional area of the stream and the stream velocity, obtained by timing 8–10 small plastic floating balls.
2.3.5 StatisticsSignificance discriminant analysis and principal components analysis (PCA) were performed by SPSS (Statistical Package of the Social Sciences, vision 23.0). Significance discriminant analysis used the independent samples t-test. If the t-test results less than 0.05, we regard there exists significant difference, otherwise the difference is insignificant. Principal components analysis applied the KMO and Bartlett's Test and the maximum variance method. When the Bartlett' test result is less than 0.001, it represents there are correlations between these data, and the PCA analysis continued. Cluster analysis chose Ward's method and measure interval chose squared euclidean distance.
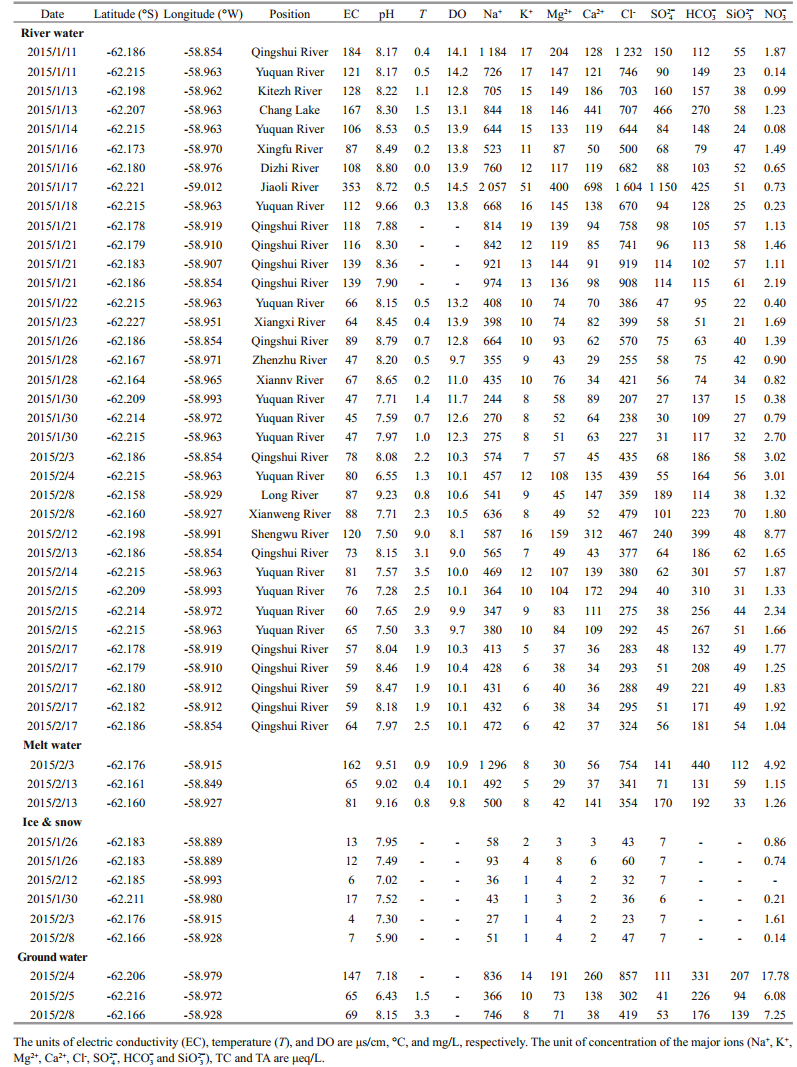
3 RESULT 3.1 Physical-chemical parameters and the major ionsTable 1 presents the physical-chemical parameters (including pH, T, DO, EC) and the major ions of Stream water, Meltwater, Ground water and Snow and Ice samples collected on FP. The pH of streams water ranges from 6.55 to 9.66, which has the highest average pH (8.15±0.56, n=36) over meltwater, ground water, snow and ice. The pH of snow and ice ranges from 5.90 to 7.95, with average value of 7.20±0.70 (n=6), which is lowest average pH compared to other samples. Streams water temperature ranges from 0.0 to 9.0℃, averaging 1.6℃. Temperature in meltwater and ground water are lower than in streams water, ranging from 0.4 to 0.9℃, and from 1.5 to 3.3℃, respectively. The range of EC in streams water, meltwater, ground water, snow and ice is from 45 to 353 μs/cm, 65 to 162 μs/cm, 65 to 147 μs/cm, and 4 to 17 μs/cm, respectively. The EC of snow and ice is significantly lower than in the other samples (P=0.000). DO in the meltwater is significantly lower than in the streams water (P=0.004).
|
The concentrations of major ions (Na+, K+, Mg2+, Ca2+, Cl-, SO42+, HCO3-) and silicate (Si) in the FP water system are presented in Table 1. Among all four types of water, major ion concentrations are highest in streams water, while major ion concentrations are lowest in snow and ice. Stream water samples have higher Na+ (range from 244 to 2 057 μeq/L) and Cl- (range from 207 to 1 604 μeq/L) concentrations relative to other major ions. K+ has the lowest concentration, range from 5 to 51 μeq/L. The average Si concentration is highest in ground water (147±57 μeq/L, n=3) and lowest in streams water (45±14 μeq/L, n=36).
3.2 Time series observation on Yuquan RiverYuquan River originates from the small permanent icecap on the south part of the FP. During our investigation, the air temperature on FP ranged from -1.8 to 5.2℃. After January 18, 2015, the air temperature on FP began warming. The air temperature averaged 2.3℃, ranging from -0.2 to 5.2℃. Relatively high precipitation (>6 mm) events occurred on January 31, February 4 and February 6, 2015. The greatest precipitation event occurred on January 31, measuring 11.1 mm.
The two end-member mixing model was applied to quantify the contribution of meltwater and snow and ice to the mass of the water in the Yuquan River (Eq.3). The concentration of total ions in three melting Collins Icecap water samples were chosen as the meltwater end-member since the outlet of the Yuquan River was not achievable, and six samples of young ice and snow were chosen as the snow and ice endmember. The average concentration of total ions from the two end-members were chosen for this model, since concentration of total ions in these two types of samples differed significantly from each other.
 (3)
(3)where TIobserved represents the observed concentration of total ions in Yuquan River, where TI(MW) and TI(SI) represent the end-member concentration of total ions' values in meltwater and snow and ice, respectively; f(MW) and f(SI) refer to the fractions of water from meltwater and snow and ice, respectively. The fraction of meltwater contribution to the Yuquan River on different days is shown in Fig. 2b and was noticeably higher before January 18. As snow and fresh ice melted due to the rising air temperature after January 18, the fraction of snow and ice contribution to the Yuquan River increased.

|
| Fig.2 Time series observation on Yuquan River The variation of temperature (line) and precipitation (column) on Fildes Peninsula during our survey period (a); fraction of meltwater contribution to water mass in Yuquan River (b). Time (d) is the day number and day 0 is calculated on January 1, 2015. Dashed line represents the date January 18, 2015. |
Seasalt is one of the important chemical components in the runoff systems. Seasalt contributing to a great proportion found in natural water located within 100 km from the ocean (Meybeck, 1983; Dong et al., 2016). In this study, the width of FP is only ~3 km, seasalt effects on the runoffs on FP would be expected. To better understand the hydrochemical process that occurred in catchments of the runoffs, seasalt corrections are usually applied to eliminate the seasalt from atmospheric deposition (Grosbois et al., 2000). The non-seasalt portion of major ions in FP streams is calculated by Eq.4:
 (4)
(4)where [M]measure and [Cl]measure represent the original concentration of major ions and Cl-, respectively. [M]sea/[Cl]sea represents the ratio of major ions to Cl- in sea water, where we applied the molar ratios from Millero et al. (2008). The original data and the results after seasalt correction in FP streams present in supplementary materials Table S5. Only a small portion of major ions remain after the seasalt correction, since the main controlling factor for hydrochemistry on FP is atmospheric deposition, as previously discussed. Post-seasalt correction, [K+] and [Mg2+] in some FP streams showed negative values. These negative values may be attributed to over-correction. This is because that the seasalt correction equation assumes chlorine is entirely coming from the ocean (Meybeck, 1983; Grosbois et al., 2000). There is an unsubstantiated hypothesis that chlorine may come from mineral dissolution during water-rock interaction (Prof. Andrew J Hodson, personal communication). Additionally, observed evidence suggests that in the glacial environment, Clmay be produced in the rock-water interface through the early englacial process (Brown, 2002). This observation is consistent with our observation of Cl- concentrations of up to 747 μeq/L in a meltwater sample collected directly from an outlet of the Collins ice cap. Constraining the chlorine from mineral dissolution is beyond the scope of this study; in the following section, we will discuss the rock weathering features revealed by the hydrochemistry on FP after seasalt correction.
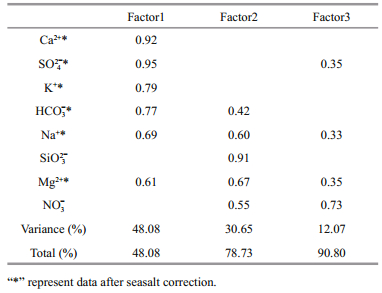
4.1.2 Identifying the main controlling factors of the hydrochemistry on FP after seasalt correctionAfter seasalt correction, the PCA result in Table 2 suggest there are three main factors that controlling the hydrochemistry on FP. Factor 1 accounts for 48.08% of the total variance and is correlated with Na+*, K+*, Mg2+*, Ca2+*, SO42-*, HCO3-*. We infer this factor mainly from carbonate weathering (Li et al., 2007). Factor 2 represents 30.65% of the total variance, and SiO32- is the important parameters in this factor. Since Si is usually regarded as a terrestrial tracer (Cornelis et al., 2011), we consider this factor represents silicate weathering. Factor 3 accounts 12.07% of the total variance, and NO3- plays a key role in this factor. Since only NO3- in snow and ice is significantly different from streams water (P=0.03, supplementary Table S4), factor 3 correlating to the aerosol flux, which may originally from photochemical reaction in atmosphere (Xu et al., 2011).
|
Different types of water (include stream water, meltwater, ground water, snow and ice) has been compared on the ternary diagram in Fig. 3. For cations, stream water, meltwater, snow and ice show the feature of the K+* and Na+* enrichment. Higher composition of Si, Ca2+* and Mg2+* were found in ground waters. For most samples, meltwater, ground water and stream water all exhibit the enrichment of Cl-. SO42- were found higher in four samples from Long River, Chang Lake, Shengwu River and Jiaoli River. The melt water which close to Long River also found a high concentration in SO42-.

|
| Fig.3 Ternary diagram (molar percentage) of stream water, ground water, meltwater and snow and ice on Fildes Peninsula "*" represent data after seasalt correction. The HCO3- of snow and ice is blow the detection line, therefore we s 3 howed the absence of the snow and ice in anion ions' diagram. |
The average ratio of HCO3-*/Na+* in streams water is 1.42, which falls into the range of silicateweathering dominated rivers all over the world (HCO3-*/Na+*=2±1, Gaillardet et al., 1999). Our result is also consistent with the previous finding that the Fildes Peninsula is composed mainly of basalt, which is a typical silicate rock (Liu and Zheng, 1988). After seasalt correction, the Ca2+*/SiO32- ratio in streams water samples on FP ranged from 0.67 to 10.72, with an average value of 3.6, which is much higher than the average Ca2+*/SiO32- ratio of 0.3 in basalt on FP (Liu and Zheng, 1988). We would expect the Ca2+*/ SiO32- ratios in streams water to be similar in the basalt on FP, as Ca has a similar relative mobility to that of Si (Georg et al., 2007). Our Si concentrations fall into the range of previous studies on King George Island (Nędzarek and Pociecha, 2010; Lim et al., 2014).
High Ca2+*/SiO32- ratios in the runoff systems on FP can be explained by either Ca gain or Si loss processes. Ca gain due to the preferred Ca dissolution in basalt rocks is usually found in the runoff systems in high latitude regions. For example, High Ca2+*/SiO32- ratios in glacial runoffs were found due to dissolution of calcite even with low calcite abundance in the host rock (Raiswell and Thomas, 1984; Jacobson et al., 2015). These examples suggested that the carbonate type rocks, e.g., calcite and heulandite in basalt, could be formed though hydrothermal alteration of basalt in the lava pile. Fildes Peninsula is mainly composed of basalt which formed by the same processes (Yang et al., 1990; Shin et al., 2009). Ca2+*/SiO32- ratios averaged 1.75 in our ground water samples, similar to the data reported by Pokrovsky et al. (2005). Our high Ca2+*/SiO32- ratios in runoffs on FP are also consistent with the observed loss of Ca in rocks on FP (Liu and Zheng, 1988). Applying the approach of Georg et al. (2007), the estimated fraction of Ca gain from the dissolution of carbonate into runoffs from the waterrock interaction on FP averaged 61%±35% (n=13). However, this calculation is based on the silicatederived Ca2+ per mole of Na+. Graly et al. (2017) suggested the higher Ca2+ to Na+ in the subglacial environment, which may create errors for our previous calculation. Si loss into secondary clay minerals or precipitation may contribute to the high Ca2+*/SiO32- ratio in rivers (Georg et al., 2007). Previous study reported that high amounts of secondary clay minerals were found in the sediment from lakes on FP (Alfonso et al., 2015). We found that streams closest to the Collins Ice Cap usually have lower Ca2+*/SiO32- ratios (0.67–0.75), e.g., Qingshui River, Zhenzhu River, and Xiannv River; while the streams with more vegetativecovered catchment, e.g., Shengwu River, Chang Lake, have much higher Ca2+*/SiO32- ratios (>3). The Ca2+*/SiO32- ratio reaches as high as 10.24 in the waters of the Chang Lake (Chang lake outflow), suggesting that biological uptake may be a factor responsible for the Si loss in waters on FP.
4.1.4 Cluster analysisCluster analysis (after seasalt correction) of the 13 streams on FP was conducted to identify these different streams, as shown in Fig. 4. Four groups are presented here. Streams in Gourp 1 are near the Collins Icecap maybe more close to glaciated stream, including, Xingfu River, Zhenzhu River, Xiannv River, Dizhi River. The streams in Group 1 are spatial closed, exhibited weakly alkaline (pH range from 8.2–8.8), and contain the lowest concentration of the Na+ over the 4 groups. Group 2, including, Kitezh River, Yuquan River, Xianweng River and Long River, are more complicated due to their complicated environmental influences, eg: glacial melted, anthropogenic activity and biological activity. This group has higher Na+, Ca2+ and SO42- than Group 1. Chang Lake and Shengwu River in Group 3, major ions are apparently higher than that of in Group 1 and 2. Group 3 locate more closed to the airport and many bases on FP. The only stream of Jiaoli River is in Group 4. The sampling location was closed to the sea, and may reflect more influence from the sea. The salinity in Jiaoli River is 0.1, contains much higher ions compared to other 3 groups.

|
| Fig.4 Cluster analysis of 13 streams on Fildes Peninsula |
As the glacier melting on the silicate based rocks, atmospheric CO2 will drawdown into the glacial meltwater accompanied silicate weathering (Sharp et al., 1995; Tranter, 1996; Brown, 2002). In this section, atmospheric CO2 drawdown during silicate weathering on FP was estimated.
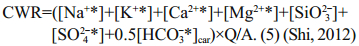
Chemical weathering rate is calculated by Eq.5:
Ca2+ and Mg2+ contribution from silicates:

Atmospheric CO2 consumption rate:
 (7)
(7)CWR, R(CO2), Q and A represent chemical weathering rate, atmospheric CO2 consumption rate, runoff and basin area respectively.
Precipitation is 630 mm/a and the surface area is 29 km2 on FP, an estimated runoff of 0.018 km3 from the peninsula can be calculated. If we considered silicate is the dominate bedrock, Ca2+ and Mg2+ which came from silicates can be calculated by Eq.6 (Graly et al., 2017). Then the rest Ca2+ and Mg2+ in the streams should be attributed from carbonate weathering. Therefore, we can estimate the proportion from the silicate weathering and carbonate weathering. In silicate weathering, 1 mol HCO3- would consume 1 mol CO2, while in carbonate weathering, 1 mol HCO3- only consume 0.5 mol CO2 (Shi, 2012). After applying Eq.7, the total atmospheric CO2 consumption of (0.5–5.0)×106 mol/a can be estimated, and the CO2 consumption rate can be estimated as (1.7–17.3)×104 mol/(km2·a) on FP. The chemical weathering rate is approximately 6.5–9.7 t/ (km2·a), after applying the total dissolved ions and the water flux on FP.
Our data is comparable to other polar glacial runoff system, for example Svalbard, Arctic and Onyx River, Antarctica (Hodson et al., 2000; Green et al., 2005). Detail information see supplementary Table S3. However, the differences between methodology for CO2 consumption calculation also need further comparison.
4.2 Si flux estimationSi concentration in meltwater samples averaged 34±20 μmol/L (n=3), and Si in all freshwater samples on FP averaged 25±17 μmol/L (n=45). Si concentration in sub-surface seawater of the adjacent seas of King George Island is 60 μmol/L, and salinity is 34.5 (Brandini, 1993). Due to freshwater input from the FP, salinity in surface seawater is diluted to ~33.6. As Si usually exhibited conservative behavior in estuary, it indicates the meltwater from King George Island is an unimportant source of Si to its adjacent seas, having a small, local impact with respect to Si flux. However, Hawkings et al. (2017) found that amorphous silica is the dominant Si species, rather than dissolved silica. Therefore, we may be underestimating the Si flux from King George Island to its adjacent seas based solely on our dissolved Si concentration.
5 CONCLUSIONIn this study, the hydrochemical features of the freshwater system on Fildes Peninsula, King George Island, Antarctica, were demonstrated, and the waterrock interaction process was evaluated. The hydrochemical features of streams on FP were influenced by the meltwater from icecap and melt snow. Ternary diagrams, principal components analysis and cluster analysis were applied to interpolate the data. It showed the runoffs on FP were largely influenced by seasalt from the atmospheric deposition. After seasalt correction, we conclude that the remaining geochemical components are released by silicate weathering from the local water-rock interactions. As revealed by the Ca*/Si ratios in the streams water on FP, a major assumption is that more than half of the Ca from the water-rock interactions originates from the dissolution of Ca-bearing silicate minerals (basalt is the main silicate rock type on FP). Si may be lost through secondary mineralization, precipitation and biological uptake processes. As observed by this and previous studies, dissolved Si concentration in runoffs on KGI are low, suggesting a less important Si source to the adjacent ocean. Four groups of streams on FP were identified after cluster analysis based on their hydrochemical features.
6 DATA AVAILABILITY STATEMENTThe datasets during and/or analyzed during the current study are available from the corresponding author on reasonable request.
7 ACKNOWLEDGEMENTWe are grateful to all the team members during our investigation in the Great Wall Station, who provided us with their assistance during our field work. Thank you to Dr. Bulat Mavlyudov, who kindly led us to the sampling locations at the outlet of the Collis ice cap.
Electronic supplementary materialSupplementary material (Supplementary Tables S1–S5, Figs.S1–S2) is available in the online version of this article at https://doi.org/10.1007/s00343-019-7193-2.
Alfonso J A, Vasquez Y, Hernandez A C, Mora A, Handt H, Sira E. 2015. Geochemistry of recent lacustrine sediments from Fildes Peninsula, King George Island, maritime Antarctica. Antarctic Science, 27(5): 462-471.
DOI:10.1017/S0954102015000127 |
Bhatia M P, Kujawinski E B, Das S B, Breier C F, Henderson P B, Charette M A. 2013. Greenland meltwater as a significant and potentially bioavailable source of iron to the ocean. Nature Geoscience, 6(4): 274-278.
|
Borghini F, Bargagli R. 2004. Changes of major ion concentrations in melting snow and terrestrial waters from northern Victoria Land, Antarctica. Antarctic Science, 16(2): 107-115.
DOI:10.1017/S095410200400197X |
Brandini F P. 1993. Phytoplankton biomass in an Antarctic coastal environment during stable water conditionsimplications for the iron limitation theory. Marine Ecology Progress Series, 93: 267-275.
DOI:10.3354/meps093267 |
Brown G H. 2002. Glacier meltwater hydrochemistry. Applied Geochemistry, 17(7): 855-883.
DOI:10.1016/S0883-2927(01)00123-8 |
Cook A J, Fox A J, Vaughan D G, Ferrigno J G. 2005. Retreating glacier fronts on the Antarctic Peninsula over the past half-century. Science, 308(5721): 541-544.
DOI:10.1126/science.1104235 |
Cornelis J T, Delvaux B, Georg R B, Lucas Y, Ranger J, Opfergelt S. 2011. Tracing the origin of dissolved silicon transferred from various soil-plant systems towards rivers:a review. Biogeosciences, 8(1): 89-112.
|
Dee D P, Uppala S M, Simmons A J, Berrisford P, Poli P, Kobayashi S, Andrae U, Balmaseda M A, Balsamo G, Bauer P, Bechtold P, Beljaars A C M, van de Berg L, Bidlot J, Bormann N, Delsol C, Dragani R, Fuentes M, Geer A J, Haimberger L, Healy S B, Hersbach H, Hólm E V, Isaksen L, Kållberg P, Köhler M, Matricardi M, McNally A P, Monge-Sanz B M, Morcrette J J, Park B K, Peubey C, de Rosnay P, Tavolato C, Thépaut J N, Vitart F. 2011. The ERA-Interim reanalysis:configuration and performance of the data assimilation system. Quarterly Journal of the Royal Meteorological Society, 137(656): 553-597.
DOI:10.1002/qj.v137.656 |
Dong Z W, Qin D H, Kang S C, Liu Y J, Li Y, Huang J, Qin X. 2016. Individual particles of cryoconite deposited on the mountain glaciers of the Tibetan Plateau:insights into chemical composition and sources. Atmospheric Environment, 138: 114-124.
DOI:10.1016/j.atmosenv.2016.05.020 |
Dong Z W, Qin D H, Qin X, Cui J Y, Kang S C. 2017. Changes in precipitating snow chemistry with seasonality in the remote Laohugou glacier basin, western Qilian Mountains. Environmental Science and Pollution Research, 24(12): 11404-11414.
DOI:10.1007/s11356-017-8778-y |
Einarsson M Á. 1984. Climate of Iceland. In:van Loon H ed.World Survey of Climatology, Vol 15:Climates of the Oceans. Elsevier, Amsterdam: p.673-697.
|
European Centre for Medium-Range Weather Forecasts. 2009.Updated monthly. ERA-Interim project. Research data archive at the national center for atmospheric research, computational and information systems laboratory. https://doi.org/10.5065/D6CR5RD9. Accessed on 2016-11-25.
|
Fegel T S, Baron J S, Fountain A G, Johnson G F, Hall E K. 2016. The differing biogeochemical and microbial signatures of glaciers and rock glaciers. Journal of Geophysical Research:Biogeosciences, 121(3): 919-932.
DOI:10.1002/2015JG003236 |
Gaillardet J, Dupré B, Louvat P, Allègrea C J. 1999. Global silicate weathering and CO2 consumption rates deduced from the chemistry of large rivers. Chemical Geology, 159(1-4): 3-30.
DOI:10.1016/S0009-2541(99)00031-5 |
Georg R B, Reynolds B C, West A J, Burton K W, Halliday A N. 2007. Silicon isotope variations accompanying basalt weathering in Iceland. Earth and Planetary Science Letters, 261(3-4): 476-490.
DOI:10.1016/j.epsl.2007.07.004 |
Gerringa L J A, Alderkamp A C, Laan P, Thuróczy C E, De Baar H J W, Mills M M, van Dijken G L, van Haren H, Arrigo K R. 2012. Iron from melting glaciers fuels the phytoplankton blooms in Amundsen Sea (Southern Ocean):iron biogeochemistry. Deep Sea Research Part Ⅱ:Topical Studies in Oceanography, 71-76: 16-31.
DOI:10.1016/j.dsr2.2012.03.007 |
Gislason S R, Arnorsson S, Armannsson H. 1996. Chemical weathering of basalt in southwest iceland:effects of runoff, age of rocks and vegetative glacial cover. American Journal of Science, 296(8): 837-907.
DOI:10.2475/ajs.296.8.837 |
Goyet C, Poisson A. 1989. New determination of carbonic acid dissociation constants in seawater as a function of temperature and salinity. Deep Sea Research Part A. Oceanographic Research Papers, 36(11): 1635-1654.
|
Graly J A, Drever J I, Humphrey N F. 2017. Calculating the balance between atmospheric CO2 drawdown and organic carbon oxidation in subglacial hydrochemical systems. Global Biogeochemical Cycles, 31(4): 709-727.
DOI:10.1002/gbc.v31.4 |
Graly J A, Humphrey N F, Landowski C M, Harper J T. 2014. Chemical weathering under the Greenland ice sheet. Geology, 42(6): 551-554.
DOI:10.1130/G35370.1 |
Green W J, Stage B R, Preston A, Wagers S, Shacat J, Newell S. 2005. Geochemical processes in the Onyx River, Wright Valley, Antarctica:Major ions, nutrients, trace metals. Geochimica et Cosmochimica Acta, 69(4): 839-850.
DOI:10.1016/j.gca.2004.08.001 |
Grosbois C, Négrel P, Fouillac C, Grimaud D. 2000. Dissolved load of the Loire River:chemical and isotopic characterization. Chemical Geology, 170(1-4): 179-201.
DOI:10.1016/S0009-2541(99)00247-8 |
Hawkings J R, Wadham J L, Benning L G, Hendry K R, Tranter M, Tedstone A, Nienow P, Raiswell R. 2017. Ice sheets as a missing source of silica to the polar oceans. Nature Communications, 8: 14198.
DOI:10.1038/ncomms14198 |
Hodson A, Tranter M, Gurnell A, Clark M, Hagen J O. 2002. The hydrochemistry of Bayelva, a high Arctic proglacial stream in Svalbard. Journal of Hydrology, 257(1-4): 91-114.
DOI:10.1016/S0022-1694(01)00543-1 |
Hodson A, Tranter M, Vatne G. 2000. Contemporary rates of chemical denudation and atmospheric CO2 sequestration in glacier basins:an Arctic perspective. Earth Surface Processes and Landforms, 25(13): 1447-1471.
DOI:10.1002/1096-9837(200012)25:13<>1.0.CO;2-D |
Hu M H, Stallard R F, Edmond J. 1982. Major ion chemistry of some large Chinese rivers. Nature, 298(5874): 550-553.
DOI:10.1038/298550a0 |
Ingri J, Widerlund A, Land M. 2005. Geochemistry of major elements in a pristine boreal river system; hydrological compartments and flow paths. Aquatic Geochemistry, 11(1): 57-88.
|
Jacobson A D, Grace Andrews M, Lehn G O, Holmden C. 2015. Silicate versus carbonate weathering in Iceland:new insights from Ca isotopes. Earth and Planetary Science Letters, 416: 132-142.
DOI:10.1016/j.epsl.2015.01.030 |
Kejna M, Araźny A, Sobota I. 2013. Climatic change on King George Island in the years 1948-2011. Polish Polar Research, 34(2): 213-235.
DOI:10.2478/popore-2013-0004 |
Keys J R, Williams K. 1981. Origin of crystalline, cold desert salts in the McMurdo region, Antarctica. Geochimica et Cosmochimica Acta, 45(12): 2299-2309.
DOI:10.1016/0016-7037(81)90084-3 |
Leal M A, Joppert M, Licínio M V, Evangelista H, Maldonado J, Dalia K C, Lima C, Barros Leite C V, Correa S M, Medeiros G, da Cunha K D. 2008. Atmospheric impacts due to anthropogenic activities in remote areas:the case study of Admiralty Bay/King George Island/Antarctic Peninsula. Water, Air, and Soil Pollution, 188(1-4): 67-80.
DOI:10.1007/s11270-007-9525-7 |
Li T T, Ji H B, Jiang Y B, Wang L X. 2007. Hydro-geochemistry and the sources of DIC in the upriver tributaries of the Ganjiang River. Acta Geographica Sinica, 62(7): 764-775.
|
Li T, Lu Y H, Li Y L, Zhu M X, Yang G M. 2013. Progress in studies of the apparent dissociation equilibrium constants of carbonate system of seawater. Transactions of Oceanology and Limnology, (3): 115-122.
(in Chinese with English abstract) |
Lim H S, Park Y, Lee J Y, Yoon H I. 2014. Geochemical characteristics of meltwater and pondwater on Barton and Weaver Peninsulas of King George Island, West Antarctica. Geochemical Journal, 48(4): 409-422.
DOI:10.2343/geochemj.2.0316 |
Liu X H, Zheng X S. 1988. Geology of volcanic rocks on Fildes Peninsula, King George Island, West Antarctica. Antarctic Research, 1(1): 25-35.
(in Chinese with English abstract) |
Marshall W L, Franck E U. 1981. Ion product of water substance, 0-1000℃, 1-10, 000 bars new international formulation and its background. Journal of Physical and Chemical Reference Data, 10(2): 295-304.
DOI:10.1063/1.555643 |
Mebeck M. 1987. Global chemical weathering of surficial rocks estimated from river dissolved loads. American Journal of Science, 287(5): 401-428.
DOI:10.2475/ajs.287.5.401 |
Meybeck M. 1983. Atmospheric inputs and river transport of dissolved substances. IAHS Publ., 141: 173-192.
|
Millero F J, Feistel R, Wright D G, McDougall T J. 2008. The composition of Standard Seawater and the definition of the reference-composition salinity scale. Deep Sea Research Part I:Oceanographic Research Papers, 55(1): 50-72.
DOI:10.1016/j.dsr.2007.10.001 |
Millero F J, Graham T B, Huang F, Bustos-Serrano H, Pierrot D. 2006. Dissociation constants of carbonic acid in seawater as a function of salinity and temperature. Marine Chemistry, 100(1-2): 80-94.
DOI:10.1016/j.marchem.2005.12.001 |
Navarre-Sitchler A, Brantley S. 2007. Basalt weathering across scales. Earth and Planetary Science Letters, 261(1-2): 321-334.
DOI:10.1016/j.epsl.2007.07.010 |
Nędzarek A, Pociecha A. 2010. Limnological characterization of freshwater systems of the Thomas Point Oasis(Admiralty Bay, King George Island, West Antarctica). Polar Science, 4(3): 457-467.
DOI:10.1016/j.polar.2010.05.008 |
Nowak A, Hodson A. 2014. Changes in meltwater chemistry over a 20-year period following a thermal regime switch from polythermal to cold-based glaciation at Austre Brøggerbreen, Svalbard. Polar Research, 33(1): 22779.
DOI:10.3402/polar.v33.22779 |
Ólafsson H, Furger M, Brümmer B. 2007. The weather and climate of Iceland. Meteorologische Zeitschrift, 16(1): 5-8.
DOI:10.1127/0941-2948/2007/0185 |
Pokrovsky O S, Schott J, Kudryavtzev D I, Dupré B. 2005. Basalt weathering in Central Siberia under permafrost conditions. Geochimica et Cosmochimica Acta, 69(24): 5659-5680.
DOI:10.1016/j.gca.2005.07.018 |
Quayle W C, Peck L S, Peat H, Ellis-Evans J C, Harrigan P R. 2002. Extreme responses to climate change in Antarctic lakes. Science, 295(5555): 645.
DOI:10.1126/science.1064074 |
Raiswell R, Benning L G, Tranter M, Tulaczyk S. 2008. Bioavailable iron in the Southern Ocean:the significance of the iceberg conveyor belt. Geochemical Transactions, 9(1): 7.
DOI:10.1186/1467-4866-9-7 |
Raiswell R, Thomas A G. 1984. Solute acquisition in glacial melt waters. I. Fjallsjökull (South-East Iceland):bulk melt waters with closed-system characteristics. Journal of Glaciology, 30(104): 35-43.
DOI:10.1017/S0022143000008467 |
Rückamp M, Blindow N, Suckro S, Braun M, Humbert A. 2010. Dynamics of the ice cap on King George Island, Antarctica:field measurements and numerical simulations. Annals of Glaciology, 51(55): 80-90.
DOI:10.3189/172756410791392817 |
Rückamp M, Braun M, Suckro S, Blindow N. 2011. Observed glacial changes on the King George Island ice cap, Antarctica, in the last decade. Global and Planetary Change, 79(1-2): 99-109.
DOI:10.1016/j.gloplacha.2011.06.009 |
Schmid T, López-Martínez J, Guillaso S, Serrano E, D'Hondt O, Koch M, Nieto A, O'Neill T, Mink S, Durán J J, Maestro A. 2017. Geomorphological mapping of ice-free areas using polarimetric RADARSAT-2 data on Fildes Peninsula and Ardley Island, Antarctica. Geomorphology, 293: 448-459.
DOI:10.1016/j.geomorph.2016.09.031 |
Sharp M, Tranter M, Brown G H, Skidmore M. 1995. Rates of chemical denudation and CO2 drawdown in a glaciercovered alpine catchment. Geology, 23(1): 61-64.
DOI:10.1130/0091-7613(1995)023<0061:ROCDAC>2.3.CO;2 |
Shi T T. 2012. The carbon sequestration effect of water cycle in a karst basin: a case study of Xiangxi River Basin, Hubei.Doctoral dissertation, China University of Geosciences(Wuhan), Wuhan, China. (in Chinese with English abstract)
|
Shin D, Lee J I, Hwang J, Hur S D. 2009. Hydrothermal alteration and isotopic variations of igneous rocks in Barton Peninsula, King George Island, Antarctica. Geosciences Journal, 13(1): 103-112.
|
Stumpf A R, Elwood Madden M E, Soreghan G S, Hall B L, Keiser L J, Marra K R. 2012. Glacier meltwater stream chemistry in Wright and Taylor Valleys, Antarctica:significant roles of drift, dust and biological processes in chemical weathering in a polar climate. Chemical Geology, 322-323: 79-90.
DOI:10.1016/j.chemgeo.2012.06.009 |
Torres M A, Moosdorf N, Hartmann J, Adkins J F, West A J. 2017. Glacial weathering, sulfide oxidation, and global carbon cycle feedbacks. Proceedings of the National Academy of Sciences of the United States of America, 114(33): 8716-8721.
DOI:10.1073/pnas.1702953114 |
Tranter M. 1996. Glacial runoff as a sink for atmospheric CO2 during the last glacial-interglacial transition. In: Proceedings of the Fourth International Symposium on the Geochemistry of the Earth's Surface. International Symposium on the Geochemistry of the Earth's Surface, Ilkley. p.709-713.
|
Vaughan D G, Marshall G J, Connolley W M, Parkinson C, Mulvaney R, Hodgson D A, King J C, Pudsey C J, Turner J. 2003. Recent rapid regional climate warming on the Antarctic Peninsula. Climatic Change, 60(3): 243-274.
|
Wadham J L, Tranter M, Skidmore M, Hodson A J, Priscu J, Lyons W B, Sharp M, Wynn P, Jackson M. 2010. Biogeochemical weathering under ice:size matters. Global Biogeochemical Cycles, 24(3): GB3025.
|
Wadham J, Hodson A, Tranter M, Dowdeswell J A. 1998. The hydrochemistry of meltwaters draining a polythermal-based, high Arctic glacier, south Svalbard:I. The ablation season. Hydrological Processes, 12(12): 1825-1849.
DOI:10.1002/(ISSN)1099-1085 |
Wen J H, Kang J C, Han J K, Xie Z C, Liu L B, Wang D L. 1998. Glaciological studies on the King George Island ice cap, South Shetland Islands, Antarctica. Annals of Glaciology, 27(1): 105-109.
|
Wong G J, Hawley R L, Lutz E R, Osterberg E C. 2013. Traceelement and physical response to melt percolation in Summit (Greenland) snow. Annals of Glaciology, 54(63): 52-62.
DOI:10.3189/2013AoG63A602 |
Wu W H, Zheng H B, Yang J D, Luo C. 2012. Review and advancements of studies on silicate weathering and the global carbon cycle. Geological Journal of China Universities, 18(2): 215-224.
(in Chinese with English abstract) |
Xu G J, Chen L Q, Zhang Y H, Wang J J, Li W, Lin Q. 2011. Chemical composition characteristics of marine aerosols collected on the route of the 26th Chinese national antarctic research expedition. Chinese Journal of Polar Research, 23(2): 98-107.
(in Chinese with English abstract) |
Yang S, Zhang W, Shen X. 1990. Ground temperature and rock thermophysical properties in Fildes Peninsula. Antarctic Research, 1(1): 58-66.
|
Yde J C, Knudsen N T, Nielsen O B. 2005. Glacier hydrochemistry, solute provenance, and chemical denudation at a surge-type glacier in Kuannersuit Kuussuat, Disko Island, West Greenland. Journal of Hydrology, 300(1-4): 172-187.
DOI:10.1016/j.jhydrol.2004.06.008 |
Zhang R F, John S G, Zhang J, Ren J L, Wu Y, Zhu Z Y, Liu S M, Zhu X C, Marsay C M, Wenger F. 2015. Transport and reaction of iron and iron stable isotopes in glacial meltwaters on Svalbard near Kongsfjorden:from rivers to estuary to ocean. Earth and Planetary Science Letters, 424: 201-211.
DOI:10.1016/j.epsl.2015.05.031 |
Zhou M, Zhu Y, Measures C I, Hatta M, Charette M A, Gille S T, Frants M, Jiang M S, Greg Mitchell B. 2013. Winter mesoscale circulation on the shelf slope region of the southern Drake Passage. Deep Sea Research Part Ⅱ:Topical Studies in Oceanography, 90: 4-14.
DOI:10.1016/j.dsr2.2013.03.041 |
Zhu C, Han X, Tan L. 2006. Experiment of Seawater Analytical Chemistry. China Ocean University Press, Qingdao, China.
(in Chinese)
|