 2019, Vol. 37
Institute of Oceanology, Chinese Academy of Sciences
Article Information
- WANG Jun, LI Zhengfei, SONG Zhuoyan, ZHANG Yun, JIANG Xiaoming, XIE Zhicai
- Responses of different biodiversity indices to subsampling efforts in lotic macroinvertebrate assemblages
- Journal of Oceanology and Limnology, 37(1): 122-133
- http://dx.doi.org/10.1007/s00343-019-7339-2
Article History
- Received Nov. 27, 2017
- accepted in principle Jan. 22, 2018
- accepted for publication Feb. 27, 2018


2 University of Chinese Academy of Sciences, Beijing 100049, China;
3 Department of Biological Sciences, University of Alberta, Edmonton, Alberta, Canada
Many biodiversity metrics have been proposed and widely applied in biodiversity assessment and environmental evaluation in aquatic ecosystems (Gallardo et al., 2011). Among them, traditional ones (e.g., species richness and Shannon-Wiener index (H′)) are widely used to measure biological diversity (alpha or gamma) of a community (Magurran, 2004). However, most of these indices are sensitive to sampling efforts (Marchant, 2007; Oliveira et al., 2011). Alternately, the taxonomic distinctness index (TD), reflecting taxonomic relatedness of a community, is argued to be apathetic to sampling effort (Clarke and Warwick, 1998), and has been successfully applied in some marine and freshwater ecosystems (Warwick and Clarke, 1998; Zintzen et al., 2011).
In aquatic systems, macroinvertebrates are a taxonomically and functionally diverse group including many organisms in various taxa (Morse et al., 2007; Qu et al., 2013). They are considered as excellent indicators of environmental monitoring and assessment programs, because they are dependent on local environments and can be easily sampled (Bailey et al., 2001; Morse et al., 2007). However, this requires much time, labor force and expertise for benthologists to sample, sort and identify these animals, especially in bulky investigation programs (Qu et al., 2013). In this context, as a less timeconsuming and laborsaving work procedure, subsampling has been widely used in the laboratory to process freshwater macroinvertebrates samples, and has gradually become a critical marker for bioassessment.
Among the subsampling procedures, fixed-area and fixed-count techniques are widely used. Although fixed-area subsampling has been considered a useful method for a long time (Barbour and Gerritsen, 1996), Walsh (1997) concluded that it is less efficient than fixed counts because of its strong variability in the number of individuals identified among samples. During the past two decades, benthologist recommended the fixed-count subsampling procedure as optimal for estimating true macroinvertebrates biodiversity (Barbour and Gerritsen, 1996; Buss et al., 2015).
Nevertheless, the subsampling procedure only captures a subset of the raw data, and so inevitably underestimates the taxonomic composition and metric values of a community study (Clarke et al., 2006; Chen et al., 2015). Moreover, the increase in fixedcount size cannot substantially increase taxa richness (Cao et al., 2001). Thus, determining a subsampling size that can deliver sufficient information of the raw data is critical for bioassessment and water quality monitoring, and the recommended counts of subsampling for macroinvertebrates are not consistent across regions (Carter and Resh, 2001; Clarke et al., 2006). For example, a minimum of 200 individuals were needed for estimating the raw data in south Florida (King and Richardson, 2002). Indeed, such minimum sizes may be between 100 and 300 in the Environmental Protection Agency Rapid Bioassessment Protocols (Lorenz et al., 2004). Instead, the European Development and Testing of an Integrated Assessment System for the Ecological Quality of Streams and Rivers using Benthic Macroinvertebrates suggests that 25% of total samples associated with a minimum of 700 specimens is suitable (Hering et al., 2004).
Although numerous studies concerning subsampling of benthic macroinvertebrates have been conducted in the USA, Europe and Australia, there have been no such studies in Asia, especially China (Chen et al., 2015). China has numerous river systems, embracing various environmental conditions (e.g., nutrients, altitude, and precipitation) that may determine the distribution and diversity of macroinvertebrates. However, research on macroinvertebrates in these ecosystems is still scarce. Therefore, it is still largely unknown as to the subsample counts required in the region. Moreover, taxonomic knowledge and experts on macroinvertebrates are sorely lacking in Asian countries, hindering the widespread use of macroinvertebrates in bioassessment programs (Jiang et al., 2013, 2017). It is thus critical and urgent to determine the ideal fixed-count size for macroinvertebrates studies in the region.
Many studies have focused on the responses of traditional indices to the subsampling. However, few studies have tested the sensitivity of TD indices to subsampling. TD indices (Δ+ and Λ+) are considered to be relatively insensitive to sampling effort (Clarke and Warwick, 1998), but the relationship between species richness and TD indices is ambiguous. Their correlation could be either weakly positive (Clarke and Warwick, 1998), or negative to nonsignificant (Heino et al., 2005). In the present study, we compared the performance of two traditional indices (richness and Shannon-Wiener diversity) and two TD indices (average taxonomic distinctness Δ+ and variation in taxonomic distinctness Λ+) for to different fixed-count subsampling (from 50 to 400 counts) using macroinvertebrates datasets from three different Chinese river systems. Our main objective was to determine the appropriate subsample counts needed to accurately measure the four diversity indices of macroinvertebrates community among the three regions, respectively. We also evaluated whether their sensitivities to the subsampling varied, and, if so, whether these differences in sensitivity were consistent across the regions.
2 MATERIAL AND METHOD 2.1 Study areaWe investigated three Chinese natural river systems, one a tributary of the Yarlung Zangbo River, and two representatives of the Upper Changjiang (Yangtze) River. The Chishui River (CR; 31°25′–32°48′N, 109°10′–110°45′E) is located at the juncture of the three provinces of Yunnan, Guizhou and Sichuan in southwestern China. It has a subtropical monsoon climate with annual rainfall of 700-1 100 mm and annual temperature of 11.3–18.2℃. It covers a drainage area of 20 440 km2, and has a mean altitude of 492 m. It has a total length of 436.5 km, mean width 52.2 m, and depth 2.7 m. It is the only one un-dammed primary tributary in the Upper Changjiang River and the core zone of the National Nature Reserve for Rare and Endemic Fishes of the Upper Changjiang River (Qin et al., 2008). The Du River (DR; 31°25–32°48′N, 109°10–110°45′E) is in central China and is the largest tributary of the Han River (the largest tributary of the Changjiang River). It represents an ecologically interesting transition between northern-tropic and warm-temperate regions, with annual temperature of 14.1℃ and annual precipitation 990 mm. It covers a drainage area of 12 400 km2 and has a mean altitude of 589 m. It has a total length of 343 km, mean width of 24.4 m, and depth 0.34 m. It is an important source region for the South-to-North Water Diversion Project (middle) (Jiang et al., 2014). The Niyang River (NR; 29°28′–30°30′N; 92°10′-94°35′E) is a typical high-altitude river system in southwestern Tibet. It has a plateau temperate semihumid monsoon climate, with annual precipitation of 672.5 mm, annual temperature of 7.6℃, and an elevation gradient from ca. 3 000 to 5 000 m (Dawaciren et al., 2008). It covers a basin area of 17 800 km2, a longitudinal length of 307.5 km from the west of the Mira Mountains to the river mouth, a mean width of 78.2 m, and water depth 0.78 m. The data set of CR was collected by our present study, but the other two were from our previous publications.
2.2 Site selection and data collectionMacroinvertebrates were collected in April 2016 for CR (44 sites), late March 2012 for DR (44), and late August 2009 for NR (18). At each sampling site, three randomly quantitative samples within a 100-m reach were sampled in principal habitats using a Surber sampler (0.09 m2 in area and 500 μm in mesh size) or modified Petersen sampler (0.062 5 m2 in area). Specimens were manually sorted from sediment in the field and preserved in 70% ethanol. In the laboratory, specimens were identified to the lowest possible taxonomic level possible (usually genus or species) according to relevant references (Brinkhurst, 1986; Morse et al., 1994; Wiggins, 1996; Dudgeon, 1999; Epler, 2001; Zhou et al., 2003), and counted.
2.3 Data analysisIn fixed-count methods, we randomly generated subsets of the raw macroinvertebrate data with eight subsampling sizes (50, 100, 150, 200, 250, 300, 350, 400 individuals) using rrarefy function in R package vegan. Function rrarefy can generate one randomly rarefied community data frame of a given sample size without replacement. For each fixed-count size, we repeated this process for all sites, and this process was repeated 1 000 times for each site. We thus obtained corresponding aggregation data of each subsample subset from raw data. Species richness was counted based on the aggregation subsets using the nrow function in R vegan, and Shannon-Wiener index was calculated based on the rarefied data using the diversity function in R vegan. For Δ+ and Λ+, we firstly catalogued the identified taxa as six taxonomic levels (species, genus, family, order, class and phylum), and then calculated Δ+ and Λ+ based on the simulated and raw presence-absence data were combined using taxondive function in R package vegan. Δ+ shows the average taxonomic path length between any two randomly chosen species and has the capability to provide more biodiversity information than species richness alone. Λ+ reveals the evenness of the distribution of taxa across the hierarchical taxonomic tree (Clarke and Warwick, 1998; Jiang et al., 2014).
We also calculated the variation of the four indices along the subsample counts levels at both regional (watershed) and local (within-watershed) scales. To explore the responses of the four indices to the fixedcount sizes, we separately analyzed the relationship of each index between 1 000 replicates and raw data using Pearson's correlation analysis. This was completed by testing correlation coefficients of each index value between 1 000 replicates and the raw data using cor.test in R vegan. We also tested the distribution of differentials of each index value between 1 000 replicates and the raw data using the following formula:

where Diff is the differentials of each index between each subsampled data and raw data. This indicates that the subsample size is more reliable for estimating the raw data when Diff < 5%; otherwise, the subsampling size is inadequate to estimate the raw data. Subsamplei is the ith subsample size. Box plots and histograms were used to show the variations of the four indices and the Diff tendency across 1 000 replicates of each subsample.
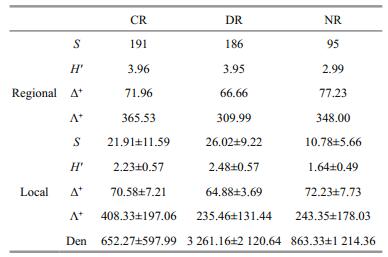
3 RESULTAt regional scale, 191 (belonging to 8 classes, 17 orders and 69 families), 186 (9, 16 and 69) and 95 taxa (4, 6 and 38) were collected in CR, DR and NR, respectively. Aquatic insects were all the dominant taxa across the three rivers. CR had the highest regional Shannon-Wiener diversity, followed by DR and NR. For TD indices, Λ+ was highest in CR compared with the other two rivers, whereas Δ+ was highest in NR, followed by CR and DR (Table 1).
|
All simulated regional taxa richness asymptotically increased with the fixed-counts, but there were different count sizes for capturing 95% of the information of raw total taxa richness among the three regions (250 in CR and NR, 300 in DR). For other indices, however, there were inconsistent trends with increasing fixed-counts, all with small deviations (< 5%) over the raw values (except H′ in NR) (Fig. 1).

|
| Fig.1 Results of subsampling for taxa richness (S), Shannon-Wiener index (H′), average taxonomic distinctness (Δ+) and variation in taxonomic distinctness (Λ+), and their standard deviations (SD) in Chishui River (CR), Du River (DR) and Niyang River (NR) at regional scale Dotted lines represents the index value of raw data. |
At local scale, DR had the highest average taxa richness and H′, followed by CR and NR. However, Δ+ was highest in NR, whereas Λ+ was highest in CR. DR had the lowest Δ+ and Λ+ (Table 1). All simulated indices were significantly and positively correlated with the original ones throughout the three regions (all P < 0.01) (Fig. 2). Simulated H′ had the strongest correlation with raw data (nearly all R > 0.95). The coefficient of taxa richness showed a lesser increase in CR (R=0.844 to 0.994) and NR (0.817 to 0.988) than in DR (0.771 to 0.971). For Δ+ and Λ+, the coefficients also showed greater change in DR (Δ+: 0.666 to 0.961, Λ+: 0.862 to 0.979) than in NR (Δ+:0.958 to 0.996, Λ+: 0.957 to 0.997) and CR (Δ+: 0.883 to 0.993, Λ+: 0.842 to 0.988).

|
| Fig.2 Box-plots showing Pearson correlations of taxa richness (S), Shannon-Wiener index (H′), average taxonomic distinctness (Δ+) and variation in taxonomic distinctness (Λ+) between raw data and subsampled data at different subsampling levels at local scale |
The four diversity measures showed different Diff patterns during the subsampling procedure. For taxa richness and Shannon-Wiener diversity index, the Diffs decreased rapidly with subsample counts in the three river systems, with deviations nearly 50% or more at smaller subsampling sizes (Figs. 3–5). For Δ+ and Λ+, however, the Diffs were very stable, and near zero, even with small subsample counts (Figs. 3–5).

|
| Fig.3 Frequency distribution of Diff values for taxa richness (S), Shannon-wiener index (H′), average taxonomic distinctness (Δ+) and the variation in taxonomic distinctness (Λ+) at different subsampling level with 1 000 replicates in CR at local scale |

|
| Fig.4 Frequency distribution of Diff values for taxa richness (S), Shannon-wiener index (H′), average taxonomic distinctness (Δ+) and the variation in taxonomic distinctness (Λ+) at different subsampling level with 1 000 replicates in DR at local scale |

|
| Fig.5 Frequency distribution of Diff values for taxa richness (S), Shannon-wiener index (H′), average taxonomic distinctness (Δ+) and the variation in taxonomic distinctness (Λ+) at different subsampling level with 1 000 replicates in NR at local scale |
Our study found that the regional macroinvertebrate richness increased asymptotically with increasing fixed-count size, whereas TD indices fluctuated slightly with varying fixed-count sizes. The dependence of taxa richness (both local and regional) on subsampling size has been reported in many studies (e.g., King and Richardson, 2002; McCord et al., 2007; Ligeiro et al., 2013), whereas the TD indices were empirically considered to be less sensitive to sampling size (Clarke and Warwick, 1999; Milošević et al., 2012). However, few studies directly tested the responses of TD indices to different sampling or subsampling sizes (Zhao et al., 2016). In the present study, we indeed found less sensitivity of TD indices to subsampling size than traditional ones. Such findings agree with previous studies (Clarke and Warwick, 1998; Bevilacqua et al., 2009; Bevilacqua et al., 2011), and the differences in sensitivity were consistent across the three river basins.
The effects of subsampling size on traditional biodiversity indices, which mainly capture information of taxa abundance associated with evenness, are due to the uneven distribution of species within natural communities. The numericallydominant species are more possibly captured or extracted than rare species during sampling process and therefore may result in less species richness in low sampling (or subsampling) effort (Magurran, 2004). In contrast, the Shannon-Wiener index is affected by taxa richness and evenness, and the evenness can account for greater variation in Shannon's diversity index (H′) than richness (Wilsey and Stirling, 2007). This is the reason why ShannonWiener diversities of simulated data all had the strong correlation with those of actual data in our study. Differently, TD indices use the Linnaean or phylogenetic classification to measure the length of the path connecting any two taxa, reflecting the information of evenness and variation in taxonomic hierarchical tree of a community (Clarke and Warwick, 1998; Campbell et al., 2011; Bevilacqua et al., 2012). Therefore, a captured community with less species richness cannot affect the construction of TD indices (e.g., Δ+), because the extracted species can largely reflect its true taxonomic structure (Clarke and Warwick, 1998; Ellingsen et al., 2005). Our research found that TD indices only need fewer subsample counts than species richness to approach 95% (which is common considered as a confidence level) of actual ones at regional and local scales. Moreover, the Diffs between simulated and actual values of TD indices were close to zero (even at small subsampling sizes) and much narrower than those of traditional indices, indicating that TD indices have stability and little sensitivity to the subsampling.
Nevertheless, too few subsampling counts can also have a negative impact on the TD indices. The deviations between simulated and actual data for Δ+ and Λ+ were remarkable in the low subsampling counts (50 counts) compared to the larger ones (100-300 counts), although these deviations were much narrower than those of species richness (Figs. 3–5). In the subsampling process, too few individuals increase the possibility of ignoring higher taxa (e.g., order and class) in the phylogenetic tree of a community (Milošević et al., 2012), and hence would affect the accuracy in simulating the actual taxonomic/ phylogenetic structure. Moreover, a small subsampling size is more possible to induce the loss of some high taxa with low abundance (e.g., Oligochaeta and Turbellarian), altering the taxonomic/phylogenetic structure and composition of the simulated community. Therefore, the number of subsamples calculated for the TD indices cannot be too small.
It is still controversial as to whether subsampling is a valid procedure for bioassessment and biomonitoring, evidenced by the inconsistency of fixed-counts size across different regions and taxa (Barbour and Gerritsen, 1996; Oliveira et al., 2011; Ligeiro et al., 2013). Our research indeed found that the appropriate subsampling for traditional diversity indices varied regionally (e.g., 250 individuals for CR and NR, and 300 for DR). This may be attributed to their differences in macroinvertebrate density. Among the three investigated basins, DR supported the highest macroinvertebrate density than the others (Table 1). Since DR locates in the ecologically interesting transition zone between northern-tropic and warmtemperate areas, with substantial forest coverage and little human disturbances, it can provide more food sources and ideal habitats for macroinvertebrates (Pu et al., 2006). In contrast, CR is exposed to more anthropogenic disturbance (e.g., agricultural pollution), leading to soil erosion and river bank destruction (Zhao et al., 2015). In NR, there are low levels of water temperature and dissolved oxygen, as well as scarce water plants and vegetation in the river basin (Jiang et al., 2013). Such harsh conditions may be the key limitations of both species richness and macroinvertebrates density. Small subsample counts may underestimate taxon richness and modify the responses of macroinvertebrates to sample size (Courtemanch, 1996). Thus, DR requires more subsample counts than the other two basins to reach 95% of the actual data. Moreover, aquatic insects make up a large proportion in DR, resulting in a few high classification orders and short path-lengths of the community (Jiang et al., 2014). Thus, DR had the lowest TD values, and the simulated Δ+ was weakly correlated with raw data at low subsampling counts.
5 CONCLUSIONIn summary, this study carefully examined the responses of multiple macroinvertebrates diversities to subsampling efforts in three typical Chinese river systems at regional and local scales. We found that TD indices (Δ+ and Λ+) required fewer subsampling counts (≥100) than taxa richness to make an accurate description of the original diversity across the three river systems. Further, they had less sensitivity and more cross-region stability to subsampling counts than richness and Shannon-Wiener diversity. Thus, we suggested that Δ+ and Λ+ should be considered as suitable tools for large-scale biodiversity assessment and environmental monitoring. However, these indicators are useful only if they can distinguish ecological conditions, which should be investigated in each case. In addition, China comprises numerous complex river systems with various environmental conditions (e.g., nutrients, altitude, and precipitation), which may determine the distribution and variation of macroinvertebrates. We found that taxa abundance may affect on traditional diversity indices. The ideal subsampling counts of species richness and TD indices could be inconsistent across regions. Hence, it is necessary to conduct a pilot analysis for determining the appropriate subsample counts for bioassessment in a new region or habitat type. There have been limited studies on the responses of diversity indices applied to macroinvertebrates (e.g. TD) to subsampling counts, and validation on these responses through time is also lacking (McCord et al., 2007; Zhang et al., 2016). Thus, future researches on lotic habitats across broad areas are needed to focus on the responses of biodiversity indices to subsampling counts both at spatial and temporal scales.
6 DATA AVAILABILITY STATEMENTThe datasets analyzed during the current study are available from the corresponding author on reasonable request.
7 ACKNOWLEDGEMENTThe authors are greatly indebted to Drs. HUANG Zhenli, TANG Tao, LU Yajing, CHU Zhenhao, GUO Shuhan, WANG Zhuo, REN Jiaying for their helps in the field sampling in CR.
Bailey R C, Norris R H, Reynoldson T B. 2001. Taxonomic resolution of benthic macroinvertebrate communities in bioassessments. Journal of the North American Benthological Society, 20(2): 280-286.
DOI:10.2307/1468322 |
Barbour M T, Gerritsen J. 1996. Subsampling of benthic samples: a defense of the fixed-count method. Journal of the North American Benthological Society, 15(3): 386-391.
DOI:10.2307/1467285 |
Bevilacqua S, Fraschetti S, Musco L, Guarnieri G, Terlizzi A. 2011. Low sensitiveness of taxonomic distinctness indices to human impacts: evidences across marine benthic organisms and habitat types. Ecological Indicators, 11(2): 448-455.
DOI:10.1016/j.ecolind.2010.06.016 |
Bevilacqua S, Fraschetti S, Terlizzi A, Boero F. 2009. The use of taxonomic distinctness indices in assessing patterns of biodiversity in modular organisms. Marine Ecology, 30(2): 151-163.
|
Brinkhurst R O. 1986. Guide to the Freshwater Aquatic Microdrile Oligochaetes of North America. Department of Fisheries and Oceans, OttawaCanadian Special Publication of Fisheries and Aquatic Sciences. 259p.
|
Buss D F, Carlisle D M, Chon T S, Culp J, Harding J S, KeizerVelk H E, Robinson W A, Strachan S, Thirion C, Hughes R M. 2015. Stream biomonitoring using macroinvertebrates around the globe: a comparison of large-scale programs. Environmental Monitoring and Assessment, 187(1): 4 132.
DOI:10.1007/s10661-014-4132-8 |
Campbell N, Neat F, Burns F, Kunzlik P. 2011. Species richness, taxonomic diversity, and taxonomic distinctness of the deep-water demersal fish community on the Northeast Atlantic continental slope (ICES Subdivision VIa). ICES Journal of Marine Science, 68(2): 365-376.
DOI:10.1093/icesjms/fsq070 |
Cao Y, Larsen D P, Hughes R M. 2001. Evaluating sampling sufficiency in fish assemblage surveys: a similarity-based approach. Canadian Journal of Fisheries and Aquatic Sciences, 58(9): 1 782-1 793.
DOI:10.1139/f01-120 |
Carter J L, Resh V H. 2001. After site selection and before data analysis: sampling, sorting, and laboratory procedures used in stream benthic macroinvertebrate monitoring programs by USA state agencies. Journal of the North American Benthological Society, 20(4): 658-682.
DOI:10.2307/1468095 |
Chen K, Hughes R M, Wang B X. 2015. Effects of fixed-count size on macroinvertebrate richness, site separation, and bioassessment of Chinese monsoonal streams. Ecological Indicators, 53: 162-170.
DOI:10.1016/j.ecolind.2015.01.011 |
Clarke K R, Warwick R M. 1998. A taxonomic distinctness index and its statistical properties. Journal of Applied Ecology, 35(4): 523-531.
DOI:10.1046/j.1365-2664.1998.3540523.x |
Clarke K R, Warwick R M. 1999. The taxonomic distinctness measure of biodiversity: weighting of step lengths between hierarchical levels. Marine Ecology Progress, 184: 21-29.
DOI:10.3354/meps184021 |
Clarke R T, Lorenz A, Sandin L, Schmidt-Kloiber A, Strackbein J, Kneebone N T, Haase P. 2006. Effects of sampling and sub-sampling variation using the STAR-AQEM sampling protocol on the precision of macroinvertebrate metrics. Hydrobiologia, 566(1): 441-459.
DOI:10.1007/s10750-006-0078-3 |
Courtemanch D L. 1996. Commentary on the subsampling procedures used for rapid bioassessments. Journal of the North American Benthological Society, 15(3): 381-385.
DOI:10.2307/1467284 |
Dawaciren Basang C L, Baima Qimeiduoji. 2008. Analysis of hydrologic characteristics in the Nepali Yang River Basin. Journal of China Hydrology, 28(4): 92-94.
(in Chinese with English abstract) |
Dudgeon D. 1999. Tropical Asian Streams: Zoobenthos, Ecology and Conservation. Hong Kong University Press, Hong Kong, China. 844p.
|
Ellingsen K E, Clarke K R, Somerfield P J, Warwick R M. 2005. Taxonomic distinctness as a measure of diversity applied over a large scale: the benthos of the Norwegian continental shelf. Journal of Animal Ecology, 74(6): 1 069-1 079.
DOI:10.1111/jae.2005.74.issue-6 |
Epler J H. 2001. Identification Manual for the Larval Chironomidae (Diptera) of North and South Carolina. Johns River Water Management District, Palatka, FL. 490p.
|
Gallardo B, Gascón S, Quintana X, Comín F A. 2011. How to choose a biodiversity indicator—Redundancy and complementarity of biodiversity metrics in a freshwater ecosystem. Ecological Indicators, 11(5): 1 177-1 184.
DOI:10.1016/j.ecolind.2010.12.019 |
Heino J, Soininen J, Lappalainen J, Virtanen R. 2005. The relationship between species richness and taxonomic distinctness in freshwater organisms. Limnology and Oceanography, 50(3): 978-986.
DOI:10.4319/lo.2005.50.3.0978 |
Hering D, Moog O, Sandin L, Verdonschot P F M. 2004. Overview and application of the AQEM assessment system. Hydrobiologia, 516(1-3): 1-20.
DOI:10.1023/B:HYDR.0000025255.70009.a5 |
Jiang X M, Song Z Y, Xiong J, Xie Z C. 2014. Can excluding non-insect taxa from stream macroinvertebrate surveys enhance the sensitivity of taxonomic distinctness indices to human disturbance?. Ecological Indicators, 41: 175-182.
DOI:10.1016/j.ecolind.2014.01.036 |
Jiang X M, Xie Z C, Chen Y F. 2013. Longitudinal patterns of macroinvertebrate communities in relation to environmental factors in a Tibetan-Plateau river system. Quaternary International, 304: 107-114.
DOI:10.1016/j.quaint.2013.02.034 |
Jiang X M, Xiong J, Xie Z C. 2017. Longitudinal and seasonal patterns of macroinvertebrate communities in a large undammed river system in Southwest China. Quaternary International, 440: 1-12.
|
King R S, Richardson C J. 2002. Evaluating subsampling approaches and macroinvertebrate taxonomic resolution for wetland bioassessment. Journal of the North American Benthological Society, 21(1): 150-171.
DOI:10.2307/1468306 |
Ligeiro R, Ferreira W, Hughes R M, Callisto M. 2013. The problem of using fixed-area subsampling methods to estimate macroinvertebrate richness: a case study with Neotropical stream data. Environmental Monitoring and Assessment, 185(5): 4 077-4 085.
DOI:10.1007/s10661-012-2850-3 |
Lorenz A, Kirchner L, Hering D. 2004. 'Electronic subsampling' of macrobenthic samples: how many individuals are needed for a valid assessment result?. Hydrobiologia, 516(1-3): 299-312.
DOI:10.1023/B:HYDR.0000025272.05793.00 |
Magurran A E. 2004. Measuring Biological Diversity. WileyBlackwell, Malden, MA. 264p.
|
Marchant R. 2007. The use of taxonomic distinctness to assess environmental disturbance of insect communities from running water. Freshwater Biology, 52(8): 1 634-1 645.
DOI:10.1111/fwb.2007.52.issue-8 |
McCord S B, Guha G S, Grippo R S. 2007. Effects of subsample size on seasonal and spatial comparisons of stream macroinvertebrate communities. Environmental Monitoring and Assessment, 135(1-3): 409-422.
DOI:10.1007/s10661-007-9660-z |
Milošević D, Simić V, Stojković M, Živić I. 2012. Chironomid faunal composition represented by taxonomic distinctness index reveals environmental change in a lotic system over three decades. Hydrobiologia, 683(1): 69-82.
DOI:10.1007/s10750-011-0941-8 |
Morse J C, Bae Y J, Munkhjargal G, Sangpradub N, Tanida K, Vshivkova T S, Wang B X, Yang L F, Yule C M. 2007. Freshwater biomonitoring with macroinvertebrates in East Asia. Frontiers in Ecology and the Environment, 5(1): 33-42.
DOI:10.1890/1540-9295(2007)5[33:FBWMIE]2.0.CO;2 |
Morse J C, Yang L F, Tian L X. 1994. Aquatic Insects of China useful for Monitoring Water Quality. Hohai University Press, Nanjing. 570p.
|
Oliveira R B, Mugnai R, Castro C M, Baptista D F. 2011. Determining subsampling effort for the development of a rapid bioassessment protocol using benthic macroinvertebrates in streams of Southeastern Brazil. Environmental Monitoring and Assessment, 175(1-4): 75-85.
DOI:10.1007/s10661-010-1494-4 |
Pu Y H, Zhang Y K, Jiang M X, Shi D L, Cao G B, Zhang D G. 2006. Study on plant diversity of Duheyuan nature reserve on the northern slope of Mt. Shennongjia, Hubei, China. Journal of Wuhan Botanical Research, 24(4): 327-332.
(in Chinese with English abstract) |
Qin W H, Liu L J, Xu W G, Wang Z, Jiang M K. 2008. Prediction of ecological impacts of the planned Xiaonanhai power dam on the rare and endemic fishes nature reserve in the upper reaches of the Yangtze River. Journal of Ecology and Rural Environment, 24(4): 23-26, 36.
(in Chinese with English abstract) |
Qu X D, Bae M J, Chon T S, Park Y S. 2013. Evaluation of subsampling efforts in estimating community indices and community structures. Ecological Informatics, 17: 3-13.
DOI:10.1016/j.ecoinf.2013.06.005 |
Walsh C J. 1997. A multivariate method for determining optimal subsample size in the analysis of macroinvertebrate samples. Marine and Freshwater Research, 48(3): 241-248.
DOI:10.1071/MF96096 |
Warwick R M, Clarke K R. 1998. Taxonomic distinctness and environmental assessment. Journal of Applied Ecology, 35(4): 532-543.
DOI:10.1046/j.1365-2664.1998.3540532.x |
Wiggins G B. 1996. Larvae of the North American Caddisfly Genera (Trichoptera). University of Toronto Press, Toronto. 456p.
|
Wilsey B, Stirling G. 2007. Species richness and evenness respond in a different manner to propagule density in developing prairie microcosm communities. Plant Ecology, 190(2): 259-273.
DOI:10.1007/s11258-006-9206-4 |
Zhang Q T, Hu G K, Yang R R. 2016. Application of taxonomic diversity indices in assessing ecological environment: a review. Environmental Monitoring in China, 32(3): 92-98.
(in Chinese with English abstract) |
Zhao J, Tang J B, Huang S S, Duan J, Guo X M, Niu D K. 2015. Study on the categories of soil erosion of Chishui River Basin and corresponding measures for soil and water conservation. Hubei Agricultural Sciences, 54(14): 3 369-3 371.
(in Chinese with English abstract) |
Zhao L, Xu Y P, Yang Z W, Xu G J, Wang Z, Xu H L. 2016. Sampling effort of periphytic diatoms for bioassessment research using taxonomic distinctness in marine ecosystems: a case study in coastal waters. Marine Pollution Bulletin, 112(1-2): 389-392.
DOI:10.1016/j.marpolbul.2016.08.008 |
Zhou C F, Gui H, Zhou K Y. 2003. Larval key to families of Ephemeroptera from China (Insecta). Journal of Nanjing Normal University (Natural Science Edition), 26(3): 65-68.
(in Chinese with English abstract) |
Zintzen V, Anderson M J, Roberts C D, Diebel C E. 2011. Increasing variation in taxonomic distinctness reveals clusters of specialists in the deep sea. Ecography, 34(2): 306-317.
DOI:10.1111/ecog.2011.34.issue-2 |