 2019, Vol. 37
Institute of Oceanology, Chinese Academy of Sciences
Article Information
- SHEN Qiushi, ZHANG Lu, Ismael Aaron KIMIREI, WANG Zhaode, GAO Qun, CHEN Shuang, YU Cheng
- Vertical physicochemical parameter distributions and health risk assessment for trace metals in water columns in eastern Lake Tanganyika, Tanzania
- Journal of Oceanology and Limnology, 37(1): 134-145
- http://dx.doi.org/10.1007/s00343-019-7351-6
Article History
- Received Nov. 29, 2017
- accepted in principle Feb. 2, 2018
- accepted for publication Apr. 8, 2018


2 Sino-Africa Joint Research Center, Chinese Academy of Sciences, Wuhan 430074, China;
3 Tanzania Fisheries Research Institute-Kigoma Centre, Kigoma P. O. Box 90, Tanzania;
4 School of Environmental Science and Technology, Suzhou University of Science and Technology, Suzhou 215009, China
Metals are naturally abundant in the environment around the world. However, the distributions and concentrations of metals in different ecosystems are strongly influenced by human activities such as mining, farming, and smelting (Kraemer et al., 2006). Heavy metals can enter aquatic ecosystems from both natural and anthropogenic sources, such as soil erosion in the catchment, atmospheric deposition, water drainage, runoff from agricultural and urban areas, and industrial and mining effluents (Facchinelli et al., 2001; Iqbal et al., 2012; Li et al., 2014). Some metals are essential, others non-essential, and some toxic to organisms. Traces of most non-essential metals (e.g., As and Hg) are very toxic, but some heavy metals (such as Cu, Fe, Mn, and Zn) are essential nutrients at low concentrations (WHO, 2008) but toxic to aquatic organisms at higher concentrations. Heavy metals can bioaccumulate and biomagnify, eventually posing potential health risks to humans. Heavy metals are some of the most critical pollutants in aquatic ecosystems (Järup, 2003; Khan et al., 2008; Christophoridis et al., 2009; Li and Zhang, 2010a). Heavy metals are therefore ecotoxicologically important, and heavy metal concentrations in environmental systems should regularly be monitored. Increased toxic metal concentrations in drinking water, for example, are considered to be closely associated with metabolic/ gastrointestinal disorders and cytotoxic, neurotoxic, and carcinogenic effects (WHO, 2008; Iqbal and Shah, 2012). Investigating the distributions of heavy metals in aquatic ecosystems and assessing the risks posed are therefore important activities in the aquatic environmental monitoring and protection field (Simeonov et al., 2003; Khan et al., 2008; Li and Zhang, 2010b; Rahman et al., 2014; Salem et al., 2014; Pandey et al., 2015). Many studies over the last few decades have been focused on heavy metal contamination of fish in the East Africa Great Rift lakes because fish from these lakes are the cheapest sources of animal protein for the local population (Sindayigaya et al., 1994; Chale, 2002; Taylor et al., 2005; Campbell et al., 2008; Verburg and Hecky, 2009; Poste et al., 2012; Ngure et al., 2014). Heavy metal concentrations in lake water and sediment samples from this area have also been determined (Chale, 2002; Kishe and Machiwa, 2003), but the risks to health posed by heavy metals in the area have not been assessed.
Comprehensive and representative heavy metal health risk assessments are important tools for estimating the potential health effects of heavy metals in aquatic ecosystems (Li and Zhang, 2010a; Iqbal et al., 2012). Many methods for assessing the health risks posed by heavy metals in freshwater lakes and oceans have been described (Simeonov et al., 2003; Nasrabadi and Maedeh, 2014; Rahman et al., 2014). World Health Organization (WHO) guidelines for drinking water quality (WHO, 2008) and United States Environmental Protection Agency (US EPA) risk assessment guidance (US-EPA, 1989, 2004) have been widely used to assess heavy metal pollution in water bodies and to assess the risks posed to human health by trace metals (Li et al., 2008; Wu et al., 2009; Li and Zhang, 2010a, b; Iqbal and Shah, 2012, 2013).
Lake Tanganyika is the second deepest and second largest (by volume) freshwater lake in the world (Tierney et al., 2010a). It is the most important freshwater body in Central Africa and is famous for its biodiversity (Degens et al., 1971). Lake Tanganyika is also an important source of drinking water, and fish from the lake are an important source of protein and income (Mölsä et al., 1999). The human population of the Lake Tanganyika basin is growing at almost twice the Tanzanian national average growth rate. The Tanzanian economy is growing at an average annual rate of 7%. It is therefore important for the deterioration of the environment, which is of great concern around the world, to be monitored (Camargo and Alonso, 2006; Guo, 2007; Iqbal and Shah, 2012; Nasrabadi and Maedeh, 2014; Pandey et al., 2015; ShibiniMol et al., 2015). Tanzania is implementing industrial and agricultural development plans, especially in the Lake Tanganyika catchment. These plans will place the aquatic environment of Tanzania under great pressure. Lake Tanganyika is an important source of both drinking water and protein (as fish) to local and more distant communities, towns, and cities, so contamination of the lake water will eventually affect human health (Järup, 2003; Fu et al., 2013; Rahman et al., 2014; Race et al., 2015). It is necessary to monitor heavy metal pollution of the water in Lake Tanganyika and to assess the potential health risks posed to those consuming the water.
The objective of this study were (1) to investigate the vertical distributions of eight heavy metals (As, Cd, Cr, Cu, Hg, Ni, Pb, and Zn) and other trace metals in the water columns of Kigoma Bay and Kungwe Bay in Lake Tanganyika; (2) to determine the inorganic anion (Cl-, F-, and SO42ˉ) concentrations, nutrient (P and Si) concentrations, and other physicochemical parameters (dissolved oxygen (DO) content, pH, and oxidation-reduction potential (ORP)) in the water columns in the bays; and (3) to assess the health risks posed by heavy metals in the lake water. A health risk assessment was performed following US EPA risk assessment guidelines to estimate the potential non-carcinogenic health effects on the local population. Lake Tanganyika is the second deepest lake (Lake Baikal is the deepest), so information on the vertical profiles of physicochemical parameters in the water column could help us understand stratification of different physicochemical parameters in lakes. The results will be important baseline data for heavy metal contamination in Lake Tanganyika and will help in the development of appropriate water quality management strategies.
2 MATERIAL AND METHOD 2.1 Study areaLake Tanganyika is a typical rift valley lake in the western branch of the East African Rift. It is the second largest freshwater lake in the world, with a surface area of 32 900 km2, a volume of 18 880 km3, and a maximum depth of 1 470 m (Alleman et al., 2005). The Lake Tanganyika catchment has an area of 238 700 km2 (Tierney et al., 2010b) and includes parts of four countries, the Republic of Burundi, the United Republic of Tanzania, the Republic of Zambia, and the Democratic Republic of Congo. Two large rivers, the Ruzizi River and Malagarasi River, flow into the eastern part of the lake, and many other small rivers and streams flow into the lake (Burnett et al., 2011). The Lukuga River is the only outflow connecting the lake to the Congo River basin (Tierney et al., 2010b). Lake Tanganyika is the most important fishing area and source of freshwater in Central Africa. The quality of the water in Lake Tanganyika is essential to local ecosystems.
Two areas in eastern Lake Tanganyika (in the part belonging to Tanzania) were selected, and the vertical distributions of physicochemical parameters, particularly trace heavy metal concentrations, in those areas were investigated. The sampling sites were Kigoma Bay (29.501 57°E, 4.821 53°S) and Kungwe Bay (29.658 26°E, 6.240 54°S), which are marked on the map shown in Fig. 1. Kigoma Bay is near Kigoma City, the capital of Kigoma Region and one of the busiest ports on Lake Tanganyika. Kungwe Bay is near the Kungwe Bay Forest Reserve, to the south of Kigoma Region. The water columns at the two sampling sites are deep and not directly affected by human lakeshore activities.

|
| Fig.1 Location of Lake Tanganyika and the sampling sites |
Lake water samples were collected from depths of 0 m (actually collected from 0.2 m below the surface) and 20, 40, 60, 80, 100, 110, 120, 140, 160, 180, 200, 400, and 600 m. Samples from 40 m deep or less were collected using an ordinary water sampler, but a deep water sampler was used to collect samples from > 40 m deep. Each water sample was passed through a disposable syringe filter (pore size 0.45 μm) immediately after being collected, then stored in 15 mL polypropylene centrifuge tubes. Each sample was divided into two portions, one for trace and nontrace element analysis and the other for inorganic anion analysis. Duplicate samples were collected at each sampling point and at each depth. A drop of concentrated nitric acid was added to each sample intended for the analysis of elements. The samples were stored in cooled boxes at about 4℃ until they were analyzed.
Trace and non-trace elements were analyzed at the State Key Laboratory of Lake Science and Environment, P.R. China (China National Accreditation Service for Conformity Assessment code CNAS L1628). The non-trace elements Ca, K, Mg, Na, and Si were determined using a Prodigy inductively coupled plasma atomic emission spectrometer (Teledyne Leeman Labs, USA) following US EPA method 200.7 for analyzing trace elements in water, solids, and biosolids by inductively coupled plasma atomic emission spectrometry (USEPA, 2004). The Ca, K, Mg, Na, and Si detection limits were 0.01, 0.1, 0.01, and 0.02, and 0.02 mg/L, respectively. An external standards method (using mixed standard solution 50020-90 provided by the Ministry of Environmental Protection of the People's Republic of China for Ca, K, Mg, and Na and a single standard solution for Si) was used to quantify the analytes. Other elements were determined using a 7700x inductively coupled plasma mass spectrometer (Agilent Technologies, USA) following US EPA Method 6020a (Revision 1, February 2007). The detection limits were 2 μg/L for Al, 0.05 μg/L for As, 0.04 μg/L for Ba, 0.005 μg/L for Cd, 0.05 μg/L for Cr, 0.005 μg/L for Co, 0.01 μg/L for Cu, 0.02 μg/L for Hg, 0.02 μg/L for Mn, 0.02 μg/L for Mo, 0.03 μg/L for Ni, 5 μg/L for P, 0.01 μg/L for Pb, 0.03 μg/L for Sn, 0.02 μg/L for Sr, 0.05 μg/L for V, and 0.1 μg/L for Zn. An external standard method (using CLARITAS PPT® mixed standard solution CL-CAL-2 (from SPEXTM) for Al, As, Ba, Cd, Cr, Co, Cu, Hg, Mn, Mo, Ni, Pb, Sn, Sr, V, and Zn and a single standard solution for P) was used to quantify the analytes. Multielement standard solution IV-ICPMS-71A (InorganicTM VENTURES, USA) was used to obtain quality control data during the analyses. The relative standard deviations of the inductively coupled plasma atomic emission spectrometry and inductively coupled plasma mass spectrometry data were < 5% and < 10%, respectively.
The major inorganic anions F-, Cl-, and SO42ˉ were analyzed using a Dionex ICS2000 ion chromatograph (Thermo Fisher Scientific, USA). The pH, ORP, and DO content were measured using an YSI Professional Plus handheld multiparameter device (Yellow Spring Instrument, USA) as soon as a water sample was collected. Sampling was conducted with generous help from the staff at the Tanzania Fisheries Research Institute, Kigoma Center, in August 2014.
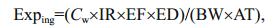
2.3 Health risk assessmentThere are three main pathways through which humans are exposed to heavy metals, direct ingestion, inhalation (through the mouth and nose), and dermal absorption (Wu et al., 2009). Inhalation can be ignored when assessing the health risks posed by heavy metals in a water body. The human health risks posed by heavy metals in the Lake Tanganyika water column were assessed following the US EPA risk assessment guidance for Superfund method (US-EPA, 2004). The numeric expressions used are shown in Eqs.1–4 (USEPA, 2004; Wu et al., 2009; Iqbal and Shah, 2012).
 (1)
(1) (2)
(2)In Eqs.1 and 2, Exping is the exposure through ingestion of water ((μg/kg)/d), Cw is the heavy metal concentration in water (μg/L), IR is the ingestion rate (2.2 L/d), EF is the exposure frequency (365 d/y), ED is the duration (30 y), BW is the average body weight (60 kg for an adult), AT is the average time for noncarcinogens and carcinogens (10 950 d), Expderm is dermal uptake from water ((μg/kg)/d), SA is the skin surface area available for contact (2 300 cm2), Kp is the dermal permeability constant (cm/h), ET is the exposure time (1 h/d), and CF is the volumetric conversion factor for water (1 L/1 000 cm3). The risk assessment was performed for adults, so all the parameter values selected were for an adult. The parameter values were taken from the US EPA risk assessment guidance for Superfund method (USEPA, 2004).
The non-carcinogenic risks posed by heavy metals were calculated using the equations (US-EPA, 2004; Wu et al., 2009; Iqbal and Shah, 2012)
 (3)
(3)and
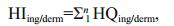 (4)
(4)where HQing/derm is the hazard quotient (dimensionless), HIing/derm is the hazard index (dimensionless), and RfDing/derm is the reference dose for an analyte ((μg/ kg)/d) taken from the US EPA risk assessment guidance for Superfund method (US-EPA, 2004).
2.4 Statistical analysisThe environmental parameters pH, ORP, and DO content for the water samples from the two bays were compared using t-tests. Boxplots of the trace heavy metal and inorganic anion concentrations were drawn using OriginLab 8.5 software. Cluster analysis of the metal concentrations in the water column samples was performed using Ward's method coupled with the Euclidean distance method, using OriginLab 8.5 software. Factor analysis involved performing principal component analysis then using the varimax rotation method. Correlation analyses and factor analysis were performed using SPSS 16.0 software.
3 RESULT AND DISCUSSION 3.1 pH, ORP, and DO contents of the water column samplesThe temperature, salinity, pH, ORP, and DO content are important basic physical properties of a water body. These parameters are closely related to element transportation in lake water, and the pH, ORP, and DO content are closely related to chemical transformations. The vertical distributions of the pH, ORPs, and DO contents in the Kigoma Bay and Kungwe Bay water columns were not significantly different (t=-1.95, P > 0.05 for pH; t=-1.83, P > 0.05 for the ORP; t=0.35, P > 0.05 for the DO content) (Fig. 2). The pH distributions in the water columns (0–600 m deep) were relatively stable and did not show significant increase or decrease with water depth, but the pH was higher in the Kungwe Bay surface water (pH 9.78) than in the Kigoma Bay surface water (pH 9.27).

|
| Fig.2 Vertical distributions of the pH, oxidation-reduction potential (ORP), and dissolved oxygen content (DO) in the Kungwe Bay and Kigoma Bay water columns |
The ORP decreased vertically as the depth increased at both sampling sites. The ORP decreased from 273.4 mV at the surface to 126.8 mV at 600 m in Kigoma Bay and from 226 mV at the surface to 63.1 mV at 600 m in Kungwe Bay (Fig. 2b). The ORP decreased more rapidly between 120 and 160 m than between other depths, indicating that 120–160 m deep is probably the redox transition layer. The ORPs in Kigoma Bay were slightly higher than in Kungwe Bay but the differences were not statistically significant.
The DO content distributions in the water columns in both bays followed typical stratification patterns, saturation being found in the top 40 m in Kigoma bay and the top 60 m in Kungwe Bay, and the DO content decreasing sharply with increasing depth until the water was anoxic at and below 100 m (Fig. 2c). The DO contents decreased dramatically from oxic conditions to hypoxic and anoxic conditions from the surface to a depth of 100 m. This supports the presence of a permanently anoxic deep water mass in Lake Tanganyika. The oxycline depth was shallower in Kigoma Bay (~75 m) than in Kungwe Bay (~95 m). The DO contents at similar depths in the top 100 m were higher in Kungwe Bay than in Kigoma Bay (Fig. 2c).
3.2 Dissolved P and SiDissolved P and Si are important biogenic elements in aquatic ecosystems. The vertical distributions of the P and Si concentrations in the Kigoma Bay and Kungwe Bay water columns are shown in Fig. 3. The P and Si concentrations both increased with increasing depth, giving typical nutrient distributions with lower concentrations in the mixed layer than in the deep layer (Alleman et al., 2005). The Si concentrations in the top 40 m were very low (1.15–1.17 mg/L in Kigoma Bay and 1.18–1.23 mg/L in Kungwe Bay) compared with the concentrations at 600 m (which were 4.84 and 6.56 times the surface concentrations in Kigoma Bay and Kungwe Bay, respectively). The limited amount of dissolved Si in the surface water was probably used for diatom reproduction and could not be increased effectively by inflowing water (Alleman et al., 2005), keeping the Si concentration in the upper water layer low. Most of the dissolved Si in the deep water was, however, stored in the water itself because of the lack of diatom activity, meaning the Si concentration was higher in the deep water than in the upper water. Dead diatoms from the upper water layer can sink into the deep water, where they will degrade (Degens et al., 1971) and release Si.

|
| Fig.3 Vertical distributions of the Si and P concentrations in the Kungwe Bay and Kigoma Bay water columns |
The P concentrations in the Kigoma Bay and Kungwe Bay water columns were only 0.006–0.008 and 0.009–0.014 mg/L, respectively, in the top 40 m and 0.19 and 0.23 mg/L, respectively, at 600 m. Low nutrient concentrations in the photic zone may indicate two scenarios, that the nutrient turnover rates in the lake are very high (Järvinen et al., 1999; Kimirei and Mgaya, 2007) or that internal regeneration from deep nutrient-rich water is not possible because of thermal stratification and decreased internal mixing (Verburg and Hecky, 2009; Naithani et al., 2011). Dead phytoplankton, zooplankton, and fish and other sinking biogenic and inorganic (mainly allochthonous) material will release P to the deep hypolimnetic water, and the P will be entrapped there (Degens et al., 1971; Edmond et al., 1993). This may be an important source of P to deep water. The low temperature and lack of DO in deep water make biological metabolism slow and chemical activities low, slowing P transportation from the soluble phase to the biophase and solid phase and retarding the biogeochemical cycle rate for P. P will accumulate in deep water. The P concentration may also be high in deep water because water stratification and stable hydrodynamic conditions prevent vertical convective exchange of lake water and hinder P transportation from the deep water to the upper water. P is therefore stored in deep water.
3.3 Main inorganic anionsThe major anions that were analyzed were F-, Cl-, and SO42ˉ. The anion concentrations were generally higher in Kungwe Bay than in Kigoma Bay (Suppl. Fig. 1 in the supplementary material). However, the vertical distributions of the anions were constant in both bays, and no obvious increases or decreases being found as the depth increased. The Cl- concentrations were typically higher than the concentrations of the other anions, making Cl- the main inorganic anion. The SO42ˉ concentrations in Kungwe Bay and Kigoma Bay were very low compared with the SO42ˉ concentrations in eutrophic lakes such as Lake Taihu in China (77.1 mg/L) (Mu et al., 2015). Under hypoxic and anoxic conditions, SO42ˉ is one of the most important electron acceptors in oxidation and reduction reactions (Middelburg and Levin, 2009; Shen et al., 2013). The low SO42ˉ concentrations in the water in the study areas will have negatively affected the growth and reproduction of sulfate-reducing bacteria, disfavoring the production of ΣH2S (S2-+HS-+H2S) (Nielsen et al., 2010) in the water column.
3.4 Vertical distributions of heavy metalsThe concentrations of eight common toxic heavy metals (As, Cd, Cr, Cu, Hg, Ni, Pb, and Zn) in the Kigoma Bay and Kungwe Bay water column samples were determined. Hg was detected in only five samples (in the 0 and 20 m deep Kigoma Bay samples and the 40, 110, and 140 m deep Kungwe Bay samples) and was below the detection limit in the other samples. The Hg concentrations in the samples in which it was detected were 0.02–0.05 μg/L, which is much lower than the WHO guideline concentration of 6 μg/L (WHO, 2008). However, the Hg concentration in Lake Tanganyika sediment is increasing (Conaway et al., 2012), and atmospheric and riverine inputs of Hg may become important in the near future because gold extraction is increasing in the area (Taylor et al., 2005; Campbell et al., 2008). Cd was detected in only a small number of samples (at 0, 110, and 160 m deep in the Kigoma Bay samples and 0, 20, and 140 m deep in the Kungwe Bay samples), and the concentrations were 0.005– 0.014 μg/L. These concentrations were lower than the WHO guideline value (3 μg/L) (WHO, 2008). The results indicated that Hg and Cd in Lake Tanganyika water are likely to cause no to minimal ecological risks through contact with the water.
The Cu, Ni, Pb, and Zn concentrations were higher in the surface water than in the deeper water (Fig. 4). The As concentrations at both sampling sites were relatively constant as the depth increased, with no clear increasing or decreasing trends. The Cr concentration profile was different, increasing with increasing depth to about 110 m deep and then decreasing gradually as the depth increased further. The maximum Cr concentration was at the same depth as the change in redox conditions from oxic to hypoxic/anoxic. In the chemocline, a limited amount of high valance Cr would be reduced to low valance Cr, depleting the former and causing high valance Cr to be transported from the oxic upper water layer to the chemocline driven by the concentration gradient. This may explain the high Cr concentrations at about 110 m in both bays. The Cu, Ni, Pb, and Zn concentrations decreased as the depth increased.

|
| Fig.4 Vertical distributions of toxic heavy metal concentrations in the Kungwe Bay and Kigoma Bay water columns |
The concentrations of these heavy metals were relatively high, possibly indicating that they had allochthonous origins, such as through surface runoff, agricultural/ industrial drainage, or atmospheric dry/wet deposition. The concentrations of these heavy metals were lower at both sites than the WHO guideline values except for the Pb concentration in the Kungwe Bay surface water (57.11±1.57 μg/L, the WHO guideline is 10 μg/L) (WHO, 2008)). High Pb concentrations were also found in sediment samples and fish in a previous study (Chale, 2002). Pb can cause a number of serious diseases including cardiovascular diseases and nerve damage, so the high Pb concentration in Kungwe Bay surface water should be of great concern.
3.5 Other metalsThe Al, Ba, Ca, Co, K, Mg, Mn, Mo, Na, Sn, Sr, and V concentrations in the samples were also determined. Sr was the most abundant, followed by Ba, Na, Mn, Mg, and K, and the least abundant were Co, Sn, V, and Mo (Suppl. Fig. 2 in supplementary material). The Al, Ba, Ca, Co, K, Mg, Mo, Na, Sn, Sr, and V vertical concentration distributions in the water columns were almost constant, and no clear increases or decreases were found as the depth increased. Ca, K, Mg, and Na are essential to the growth and metabolism of organisms and are considered to be harmless and nontoxic. The other metals are important trace elements required by organisms, but excessive intakes can have serious pathological effects. The concentrations of these trace elements in the water column samples were all below the WHO guideline values, indicating that none would harm human health.
Lower Mn concentrations were found in the surface water than in the deep water, which may have been related to several biogeochemical processes such as photoinhibition of manganese-oxidizing microbes by light at a high intensity, uptake by green algae, and precipitation of manganese oxides because of the pH being high (Langlet et al., 2007). It has previously been found that, in the absence of allochthonous inputs, Mn in lake water comes mainly from geogenic background inputs (Li and Zhang, 2010b). The lake sediment supplies Mn and may release Mn to the overlying water driven by chemical or biochemical activities under anoxic conditions. This would have caused the high Mn concentrations in the deep water samples.
3.6 Multivariate apportionment analysis of trace metals in the water columnsCorrelations between the metal concentrations and physicochemical parameters were analyzed to attempt to explain the patterns found in some metal concentrations. The results are shown in Suppl. Table 1 in supplementary material. Significant negative correlations were found between the ORP and P concentration, the ORP and Si concentration, the DO content and P concentration, and the DO content and Si concentration. This may indicate that P and Si can be efficiently transferred from the soluble phase to other phases in a water column with a high ORP and DO contents. In an anoxic and reduced environment, soluble P and Si will be stored in the water column and accumulate. The P and Si concentrations significantly positively correlated with the Ba, Ca, and Co concentrations. The chemical properties of these elements suggest that the concentrations may have correlated predominantly because of phosphates and silicates dissolving and precipitating. Other complex correlations were found between different parameters and the metal concentrations, but no meaningful conclusions could be drawn from these results.
|
Correlations between the concentrations of the different metals were also analyzed, and the results are shown in Suppl. Table 2 in supplementary material. Strong correlations were found between the As, Ba, Co, Cr, Cu, Mo, Ni, Pb, Sn, Sr, V, and Zn concentrations, implying that these metals may have shared certain sources. Principal component analysis and cluster analysis were performed to explore the complex relationships between the metal concentrations and other physicochemical parameters to improve our understanding of the metal distributions in the lake water. The cluster analysis dendrogram (Fig. 5) indicated that Al, As, Ca, Cr, Cu, Co, Mo, Ni, Pb, Sn, and V could be clustered in one class with Mn. In the absence of artificial inputs, these elements are typically supplied by geogenic background inputs and the lake sediment (Pekey et al., 2004; Li et al., 2009; Li and Zhang, 2010b; Iqbal and Shah, 2012). The nutrients essential to organisms (Ba, K, Mg, Na, Sr, and Zn) were clustered in another class. These elements were always found at higher concentrations than the other elements in the water column samples.

|
| Fig.5 Cluster analysis dendrogram for the metals in the Lake Tanganyika water samples |
The principal component analysis results (Fig. 6) indicated that the first three extracted components with eigenvalues > 1 explained 58.19% of the accumulated variance. The first component explained 34.42% of the total variance. The main contributions to the loading of this component were the common elements Ca, P, and Si and the trace elements Ba, Co, Sr, and V. These elements have mainly geogenic background sources and are mainly released from and transported by sediment. Component 1, therefore, represented geogenic sources of heavy metals to the lake water. Component 2 explained 12.53% of the total variance. As, Cr, Cu, Mo, Ni, Sn, and Pb, and Zn were the main contributors to the loading of component 2. These elements are mainly toxic heavy metals and are probably supplied by anthropogenic sources, particularly when poor land-use practices are used and through mining activities within the lake basin. Component 2 represented artificial sources of toxic heavy metals to the lake water. Component 3 explained only 11.02% of the total variance, and Ca, Mg, and Na were the main contributors to the loading. These elements are essential biogenic elements and are mainly found in lake water as common ions. Component 3 represented common biogenic ions in the water columns.

|
| Fig.6 Principal component analysis loading plot for the physicochemical parameters for the Lake Tanganyika water samples |
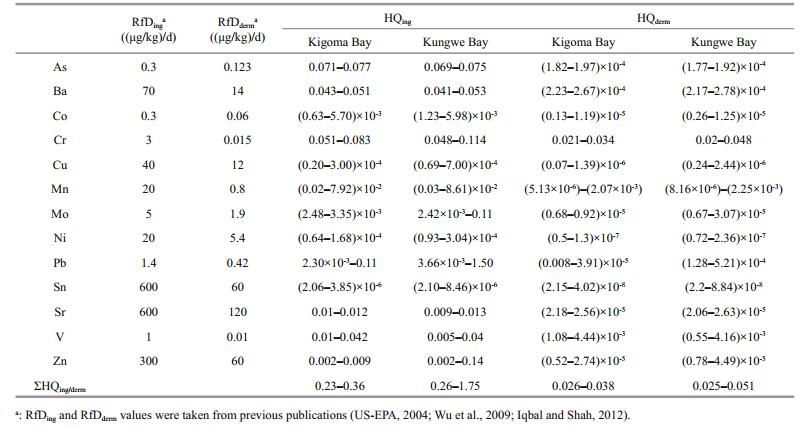
The non-carcinogenic health risks posed to humans by trace metals in water at the study sites were estimated using a method published by the US EPA (US-EPA, 2004). The risk assessment results for the trace metals in the Kigoma Bay and Kungwe Bay water columns through exposure through the ingestion and dermal exposure pathways are shown in Table 1. The ΣHQing values for the Kigoma Bay water samples were < 1. This is a relatively low value and indicates that ingesting trace metals in water from Kigoma Bay does not pose adverse hazards or health risks to humans. The ΣHQing values for Kungwe Bay water samples were 0.26–1.75. The ΣHQing values for Kungwe Bay surface water were > 1 (and were the highest values found), so the ingestion of trace metals in surface water from Kungwe Bay poses health risks to humans. Pb was the main contributor to the surface water ΣHQing because of its high concentration. Other elements in the surface water are not likely to cause adverse effects in people ingesting the water, but the HQing values for As, Ba, Cr, V, and Zn in water from both bays were higher than the HQing values for the other elements, so the As, Ba, Cr, V, and Zn concentrations should be monitored closely so that proactive management decisions can be made. The ΣHQderm and HQderm values for all the trace metals in water from both Kigoma Bay and Kungwe Bay were very low, indicating that the trace metals pose no hazards or non-carcinogenic health risks to people through dermal contact with the water.
4 CONCLUSIONThe water in Kigoma Bay and Kungwe Bay changed from oxidizing conditions to reducing conditions between 0 and 140 m deep. The concentrations of the main soluble nutrients P and Si increased as the depth increased, so deep water will be a sink for P and Si.
The concentrations of the toxic heavy metals As, Cu, Ni, Pb, and Zn were higher in the surface water than in the deep water, but the Cr concentration increased as the depth increased to 110 m and then decreased as the depth increased further. The As, Cr, Cu, Ni, Pb, and Zn concentrations in most of the samples were lower than the WHO guideline values, but the Pb concentration in the Kungwe Bay surface water was higher than the WHO guideline. The concentrations of the common and trace metals Al, Ba, Ca, Co, K, Mg, Mn, Mo, Na, Sn, Sr, and V were also lower than the WHO guideline values, and the concentrations were relatively constant as the water depth increased. The multivariate analysis results indicated that there are three sources of metals to the water in Kigoma Bay and Kungwe Bay, geogenic sources for the trace metals Al, Ba, Ca, Co, Cu, Cr, Mn, Sr, Sn, and V; anthropogenic sources for the toxic heavy metals As, Cu, Cr, Mo, Ni, Sn Pb, and Zn; and biogenic sources for As, Ca, Co, Mg, and Na.
The trace metal health risk assessments indicated that the trace metals in water from most depths in Kigoma Bay and Kungwe Bay are unlikely to cause adverse effects and pose no non-carcinogenic health risks through dermal contact or ingestion. However, the ΣHQing value for the Kungwe Bay surface water was 1.75, and the Pb HQing was 1.50 (85.7% of the ΣHQing). This indicates that ingestion of Kungwe Bay surface water may have negative effects on human health. More concern should be paid to the long-term management of Pb pollution in Lake Tanganyika than is currently the case, especially as extractive industries in the lake basin grow.
5 DATA AVAILABILITY STATEMENTThe datasets generated and/or analyzed during the study are available from the corresponding author.
6 ACKNOWLEDGMENTWe express our gratitude to Mr. Huruma Fredrick Mgana from the Tanzania Fisheries Research Institute Kigoma Centre and the crew of RV ECHO who helped with the sampling work in Lake Tanganyika despite very harsh weather conditions. We thank Associate Professor Dr. ZHU Yuxin from the State Key Laboratory of Lake Science and Environment, Nanjing Institute of Geography and Limnology of the Chinese Academy of Sciences for his kind help with trace element analyses. We would also like to thank two anonymous reviewers very much for their helpful and constructive comments. We thank Gareth Thomas, PhD, from Edanz Group (www.edanzediting.com/ac) for editing a draft of this manuscript. The authors declare that they have no conflict of interests.
Electronic supplementary materialSupplementary material (Supplementary Tables 1–2 and Figs. 1–2) is available in the online version of this article at https://doi.org/10.1007/s00343-019-7351-6.
Alleman L Y, Cardinal D, Cocquyt C, Plisnier P D, Descy J P, Kimirei I, Sinyinza D, André L. 2005. Silicon isotopic fractionation in Lake Tanganyika and its main tributaries. Journal of Great Lakes Research, 31(4): 509-519.
DOI:10.1016/S0380-1330(05)70280-X |
Burnett A P, Soreghan M J, Scholz C A, Brown E T. 2011. Tropical east African climate change and its relation to global climate: a record from Lake Tanganyika, tropical east Africa, over the past 90+ kyr. Palaeogeography, Palaeoclimatology, Palaeoecology, 303(1-4): 155-167.
DOI:10.1016/j.palaeo.2010.02.011 |
Camargo J A, Alonso Á. 2006. Ecological and toxicological effects of inorganic nitrogen pollution in aquatic ecosystems: a global assessment. Environment International, 32(6): 831-849.
DOI:10.1016/j.envint.2006.05.002 |
Campbell L, Verburg P, Dixon D G, Hecky R E. 2008. Mercury biomagnification in the food web of Lake Tanganyika (Tanzania, East Africa). Science of the Total Environment, 402(2-3): 184-191.
DOI:10.1016/j.scitotenv.2008.04.017 |
Chale F M M. 2002. Trace metal concentrations in water, sediments and fish tissue from Lake Tanganyika. Science of the Total Environment, 299(1-3): 115-121.
DOI:10.1016/S0048-9697(02)00252-8 |
Christophoridis C, Dedepsidis D, Fytianos K. 2009. Occurrence and distribution of selected heavy metals in the surface sediments of Thermaikos Gulf, N. Greece. Assessment using pollution indicators. Journal of Hazardous Materials, 168(2-3): 1 082-1 091.
|
Conaway C H, Swarzenski P W, Cohen A S. 2012. Recent paleorecords document rising mercury contamination in Lake Tanganyika. Applied Geochemistry, 27(1): 352-359.
DOI:10.1016/j.apgeochem.2011.11.005 |
Degens E T, Von Herzen R P, Wong H K. 1971. Lake Tanganyika: water chemistry, sediments, geological structure. Naturwissenschaften, 58(5): 229-241.
DOI:10.1007/BF00602986 |
Edmond J M, Stallard R F, Craig H, Craig V, Weiss R F, Coulter G W. 1993. Nutrient chemistry of the water column of Lake Tanganyika. Limnology and Oceanography, 38(4): 725-738.
DOI:10.4319/lo.1993.38.4.0725 |
Facchinelli A, Sacchi E, Mallen L. 2001. Multivariate statistical and GIS-based approach to identify heavy metal sources in soils. Environmental Pollution, 114(3): 313-324.
DOI:10.1016/S0269-7491(00)00243-8 |
Fu J, Hu X, Tao X C, Yu H X, Zhang X W. 2013. Risk and toxicity assessments of heavy metals in sediments and fishes from the Yangtze River and Taihu Lake, China. Chemosphere, 93(9): 1 887-1 895.
DOI:10.1016/j.chemosphere.2013.06.061 |
Guo L. 2007. Doing battle with the green monster of Taihu Lake. Science, 317(5842): 1 166.
DOI:10.1126/science.317.5842.1166 |
Iqbal J, Shah M H. 2012. Water quality evaluation, health risk assessment and multivariate apportionment of selected elements from Simly Lake, Pakistan. Water Science and Technology: Water Supply, 12(5): 588-594.
DOI:10.2166/ws.2012.019 |
Iqbal J, Shah M H. 2013. Health risk assessment of metals in surface water from freshwater source lakes, Pakistan. Human and Ecological Risk Assessment: An International Journal, 19(6): 1 530-1 543.
DOI:10.1080/10807039.2012.716681 |
Iqbal J, Tirmizi S A, Shah M H. 2012. Non-carcinogenic health risk assessment and source apportionment of selected metals in source freshwater Khanpur Lake, Pakistan. Bulletin of Environmental Contamination and Toxicology, 88(2): 177-181.
DOI:10.1007/s00128-011-0480-z |
Järup L. 2003. Hazards of heavy metal contamination. British Medical Bulletin, 68(1): 167-182.
DOI:10.1093/bmb/ldg032 |
Järvinen M, Salonen K, Sarvala J, Vuorio K, Virtanen A. 1999. The stoichiometry of particulate nutrients in Lake Tanganyika-implications for nutrient limitation of phytoplankton. Hydrobiologia, 407: 81-88.
DOI:10.1023/A:1003706002126 |
Khan S, Cao Q, Zheng Y M, Huang Y Z, Zhu Y G. 2008. Health risks of heavy metals in contaminated soils and food crops irrigated with wastewater in Beijing, China. Environmental Pollution, 152(3): 686-692.
DOI:10.1016/j.envpol.2007.06.056 |
Kimirei I A, Mgaya Y D. 2007. Influence of environmental factors on seasonal changes in clupeid catches in the Kigoma area of Lake Tanganyika. African Journal of Aquatic Science, 32(3): 291-298.
DOI:10.2989/AJAS.2007.32.3.9.308 |
Kishe M A, Machiwa J F. 2003. Distribution of heavy metals in sediments of Mwanza Gulf of Lake Victoria, Tanzania. Environment International, 28(7): 619-625.
DOI:10.1016/S0160-4120(02)00099-5 |
Kraemer L D, Campbell P G C, Hare L. 2006. Seasonal variations in hepatic Cd and Cu concentrations and in the sub-cellular distribution of these metals in juvenile yellow perch (Perca flavescens). Environmental Pollution, 142(2): 313-325.
DOI:10.1016/j.envpol.2005.10.004 |
Langlet D, Alleman L Y, Plisnier P D, Hughes H, André L. 2007. Manganese content records seasonal upwelling in Lake Tanganyika mussels. Biogeosciences, 4(2): 195-203.
DOI:10.5194/bg-4-195-2007 |
Li F, Huang J H, Zeng G M, Huang X L, Li X D, Liang J, Wu H P, Wang X Y, Bai B. 2014. Integrated source apportionment, screening risk assessment, and risk mapping of heavy metals in surface sediments: a case study of the dongting lake, middle China. Human and Ecological Risk Assessment: An International Journal, 20(5): 1 213-1 230.
DOI:10.1080/10807039.2013.849479 |
Li J L, He M, Han W, Gu Y F. 2009. Analysis and assessment on heavy metal sources in the coastal soils developed from alluvial deposits using multivariate statistical methods. Journal of Hazardous Materials, 164(2-3): 976-981.
DOI:10.1016/j.jhazmat.2008.08.112 |
Li S Y, Xu Z F, Cheng X L, Zhang Q F. 2008. Dissolved trace elements and heavy metals in the Danjiangkou Reservoir, China. Environmental Geology, 55(5): 977-983.
DOI:10.1007/s00254-007-1047-5 |
Li S Y, Zhang Q F. 2010a. Risk assessment and seasonal variations of dissolved trace elements and heavy metals in the Upper Han River, China. Journal of Hazardous Materials, 181(1-3): 1 051-1 058.
DOI:10.1016/j.jhazmat.2010.05.120 |
Li S Y, Zhang Q F. 2010b. Spatial characterization of dissolved trace elements and heavy metals in the upper Han River (China) using multivariate statistical techniques. Journal of Hazardous Materials, 176(1-3): 579-588.
DOI:10.1016/j.jhazmat.2009.11.069 |
Middelburg J J, Levin L A. 2009. Coastal hypoxia and sediment biogeochemistry. Biogeosciences, 6: 1 273-1 293.
DOI:10.5194/bg-6-1273-2009 |
Mölsä H, Reynolds J E, Coenen E J, Lindqvist O V. 1999. Fisheries research towards resource management on Lake Tanganyika. Hydrobiologia, 407: 1-24.
DOI:10.1023/A:1003712708969 |
Mu X Y, Brower J, Siegel D I, Fiorentino Ⅱ A J, An S Q, Cai Y, Xu D L, Jiang H. 2015. Using integrated multivariate statistics to assess the hydrochemistry of surface water quality, Lake Taihu basin, China. Journal of Limnology, 74(2): 234-247.
|
Naithani J, Plisnier P D, Deleersnijder E. 2011. Possible effects of global climate change on the ecosystem of Lake Tanganyika. Hydrobiologia, 671(1): 147-163.
DOI:10.1007/s10750-011-0713-5 |
Nasrabadi T, Maedeh P A. 2014. Groundwater quality assessment in southern parts of Tehran plain, Iran. Environmental Earth Sciences, 71(5): 2 077-2 086.
DOI:10.1007/s12665-013-2610-x |
Ngure V, Davies T, Kinuthia G, Sitati N, Shisia S, Oyoo-Okoth E. 2014. Concentration levels of potentially harmful elements from gold mining in Lake Victoria Region, Kenya: environmental and health implications. Journal of Geochemical Exploration, 144: 511-516.
DOI:10.1016/j.gexplo.2014.04.004 |
Nielsen L P, Risgaard-Petersen N, Fossing H, Christensen P B, Sayama M. 2010. Electric currents couple spatially separated biogeochemical processes in marine sediment. Nature, 463(7284): 1 071-1 074.
DOI:10.1038/nature08790 |
Pandey M, Pandey A K, Mishra A, Tripathi B D. 2015. Assessment of metal species in river Ganga sediment at Varanasi, India using sequential extraction procedure and SEM-EDS. Chemosphere, 134: 466-474.
DOI:10.1016/j.chemosphere.2015.04.047 |
Pekey H, Karakas D, Bakoğlu M. 2004. Source apportionment of trace metals in surface waters of a polluted stream using multivariate statistical analyses. Marine Pollution Bulletin, 49(9-10): 809-818.
DOI:10.1016/j.marpolbul.2004.06.029 |
Poste A E, Muir D C G, Mbabazi D, Hecky R E. 2012. Food web structure and mercury trophodynamics in two contrasting embayments in northern Lake Victoria. Journal of Great Lakes Research, 38(4): 699-707.
DOI:10.1016/j.jglr.2012.09.001 |
Race M, Nabelkova J, Fabbricino M, Pirozzi F, Raia P. 2015. Analysis of heavy metal sources for urban creeks in the Czech Republic. Water, Air, & Soil Pollution, 226: 322.
|
Rahman M S, Saha N, Molla A H, Al-Reza S M. 2014. Assessment of anthropogenic influence on heavy metals contamination in the aquatic ecosystem components: water, sediment, and fish. Soil and Sediment Contamination: An International Journal, 23(4): 353-373.
DOI:10.1080/15320383.2014.829025 |
Salem Z B, Capelli N, Laffray X, Elise G, Ayadi H, Aleya L. 2014. Seasonal variation of heavy metals in water, sediment and roach tissues in a landfill draining system pond (Etueffont, France). Ecological Engineering, 69: 25-37.
DOI:10.1016/j.ecoleng.2014.03.072 |
Shen Q S, Liu C, Zhou Q L, Shang J G, Zhang L, Fan C X. 2013. Effects of physical and chemical characteristics of surface sediments in the formation of shallow lake algaeinduced black bloom. Journal of Environmental Sciences, 25(12): 2 353-2 360.
DOI:10.1016/S1001-0742(12)60325-8 |
ShibiniMol P A, Raveendran R, Sujatha C H. 2015. Elucidation of contaminant-induced toxic responses in the biota of Lake Vembanad, kerala, India. Human and Ecological Risk Assessment: An International Journal, 21(6): 1 576-1 592.
DOI:10.1080/10807039.2014.960722 |
Simeonov V, Stratis J A, Samara C, Zachariadis G, Voutsa D, Anthemidis A, Sofoniou M, Kouimtzis T. 2003. Assessment of the surface water quality in Northern Greece. Water Research, 37(17): 4 119-4 124.
DOI:10.1016/S0043-1354(03)00398-1 |
Sindayigaya E, Van Cauwenbergh R, Robberecht H, Deelstra H. 1994. Copper, zinc, manganese, iron, lead, cadmium, mercury and arsenic in fish from Lake Tanganyika, Burundi. Science of the Total Environment, 144(1-3): 103-115.
DOI:10.1016/0048-9697(94)90431-6 |
Taylor H, Appleton J D, Lister R, Smith B, Chitamweba D, Mkumbo O, Machiwa J F, Tesha A L, Beinhoff C. 2005. Environmental assessment of mercury contamination from the Rwamagasa artisanal gold mining centre, Geita District, Tanzania. Science of the Total Environment, 343(1-3): 111-133.
DOI:10.1016/j.scitotenv.2004.09.042 |
Tierney J E, Mayes M T, Meyer N, Johnson C, Swarzenski P W, Cohen A S, Russell J M. 2010a. Late-twentieth-century warming in Lake Tanganyika unprecedented since AD 500. Nature Geoscience Volume, 3(6): 422-425.
DOI:10.1038/ngeo865 |
Tierney J E, Russell J M, Huang Y S. 2010b. A molecular perspective on Late Quaternary climate and vegetation change in the Lake Tanganyika basin, East Africa. Quaternary Science Reviews, 29(5-6): 787-800.
DOI:10.1016/j.quascirev.2009.11.030 |
US-EPA. 1989. Risk Assessment Guidance for Superfund Volume Ⅰ: Human Health Evaluation Manual (Part A). Interim report (Final). Office of Emergency and Remedial Response, US-EPA, Washington D. C.
|
US-EPA. 2004. Risk Assessment Guidance for Superfund (RAGS), Volume Ⅰ: Human Health Evaluation Manual (Part E, Supplemental Guidance for Dermal Risk Assessment). US-EPA, Washington D. C.
|
Verburg P, Hecky R E. 2009. The physics of the warming of Lake Tanganyika by climate change. Limnology and Oceanography, 54(6): 2 418-2 430.
|
WHO. 2008. Guidelines for Drinking-water Quality, Third Edition, Incorporating First and Second Addenda. WHO, Gevena.
|
Wu B, Zhao D Y, Jia H Y, Zhang Y, Zhang X X, Cheng S P. 2009. Preliminary risk assessment of trace metal pollution in surface water from Yangtze River in Nanjing section, China. Bulletin of Environmental Contamination and Toxicology, 82(4): 405-409.
DOI:10.1007/s00128-008-9497-3 |