 2019, Vol. 37
Institute of Oceanology, Chinese Academy of Sciences
Article Information
- YONG Wai-Kuan, LIM Phaik-Eem, VELLO Vejeysri, SIM Kae-Shin, ABDUL MAJID Nazia, MUSTAFA Emienour Muzalina, NIK SULAIMAN Nik Meriam, LIEW Kan-Ern, CHEN Brenna Jia-Tian, PHANG Siew-Moi
- Metabolic and physiological regulation of Chlorella sp. (Trebouxiophyceae, Chlorophyta) under nitrogen deprivation
- Journal of Oceanology and Limnology, 37(1): 186-198
- http://dx.doi.org/10.1007/s00343-019-7263-5
Article History
- Received Sep. 11, 2017
- accepted in principle Nov. 20, 2017
- accepted for publication Mar. 2, 2018


2 Institute of Graduate Studies, University of Malaya, 50603 Kuala Lumpur, Malaysia;
3 Institute of Biological Sciences, Faculty of Science, University of Malaya, 50603 Kuala Lumpur, Malaysia;
4 School of Fisheries and Aquaculture Sciences, University of Malaysia, Terengganu, T145, 21300 Kuala Terengganu, Terengganu, Malaysia;
5 Department of Chemical Engineering, Faculty of Engineering, University of Malaya, 50603 Kuala Lumpur, Malaysia;
6 Airbus Group Malaysia, Menara HLA, 3, Jalan Kia Peng, 50450 Kuala Lumpur, Malaysia;
7 Aerospace Malaysia Innovation Centre, Level 1, MIGHT Building, 3517, Jalan Teknokrat 5, 63000 Cyberjaya, Selangor, Malaysia
Microalgae are a potential feedstock for triacylglycerol (TAG) and neutral lipids which are used in biofuel production due to their fast growth rate, high photosynthetic efficiency, high lipid yields and ability to grow in a broad range of environmental conditions. Various strategies, such as nutrient deprivation (e.g. nitrogen starvation), temperature, salinity, pH, high concentration of metal ion stress, and irradiation, have been developed to improve the biomass yield and the lipid content of microalgal cells (Sharma et al., 2012).
Nitrogen is an important building block for amino acids, nucleic acids, enzymes and proteins. It is assimilated into microalgal cells in the form of nitrate or ammonium, and is involved in multiple metabolic networks. While it is widely known that the deprivation of nitrogen leads to lipid accumulation in microalgae, it also triggers many other metabolic responses in the organisms. Nitrogen deprivation inhibits photosynthesis by impairing photosystem Ⅱ (PSⅡ) reaction centres, decreasing chlorophyll fluorescence yield, and reducing synthesis of chlorophylls which requires nitrogen-containing precursors (Yang et al., 2013). Phaeodactylum tricornutum, a model diatom, showed reorganized proteome profile, reduced lipid degradation, restructured central energy metabolism and reduced photosynthetic activity under nitrogen deprivation (Longworth et al., 2016). In Chlamydomonas reinhardtii, nitrogen starvation affected the respiratory metabolism, protein and pigment content, RNAs in chloroplast and photosynthetic activity (Schmollinger et al., 2014).
Nitrogen starvation leads to a complex metabolic network rewiring in the cells. A systems biology approach, including transcriptomics, proteomics and metabolomics, was used to study the response of Chlamydomonas reinhardtii to nitrogen deprivation (Park et al., 2015). Lipid accumulation mechanisms of Chlorella protothecoides was proposed by integrating data from its genome, transcriptome and proteome. The flow of carbon and nitrogen were regulated by nitrogen regulatory protein PII and glutamate synthase in nitrogen assimilation and TCA cycle (Gao et al., 2014). Metabolome and lipidome profiles of Pseudochoricystis ellipsoidea revealed that under nitrogen stress, the amino acids in nitrogen assimilation and N-transporting metabolisms were decreased to 1/20 compared to the nitrogen-rich condition (Ito et al., 2013).
Chlorella sp., UMACC344 is a local strain with promising potential as feedstock for biofuel production. This study aimed to investigate and provide an overview of the response of UMACC344 to nitrogen deprivation. Cultures subjected to nitrogen-replete and deplete conditions were compared in terms of growth, pigment content, photosynthetic efficiency, biochemical and metabolic profiles.
2 MATERIAL AND METHOD 2.1 Microalgae culture maintenanceThe green microalga Chlorella sp. (UMACC344) was obtained from the University of Malaya Algae Culture Collection (UMACC) and cultured in Bold's Basal Medium (Nichols and Bold, 1965). The cultures were maintained in the exponential growth phase on an orbital shaker (1×g) under the illumination of 15 μmol photons/(m2·s) with 12 h:12 h light:dark cycles at 25±1℃.
2.2 Stress treatmentThe inoculum was prepared by growing the cultures under continuous aeration and cool white fluorescent lamps (30 μmol photons/(m2·s)) on 12 h: 12 h light:dark cycles at 25±1℃ for 6 d. Cultures in the exponential growth phase were washed once with BBM deprived of NaNO3 to remove nitrate from the cultures prior to treatment. Subsequently, 100 mL (10%) of the inoculum (approximately 2×10⁶ cells/ mL) was cultivated in 900 mL of BBM with full composition (the control: nitrogen-replete, N+ group) or BBM deprived of NaNO3 (the treatment: nitrogendeplete, N- group). Effects of nitrogen deprivation on microalgae were assessed on day 0, 1, 2 and 4. The experiments were carried out in batch culture method. For every time point, three biological replicates, each with the total volume of 1 000 mL, was used to carry out the experiments for all assays.
2.3 Growth parameters and pigments extractionGrowth was monitored based on optical density at 620 nm (OD620nm) and cell count using a hemocytometer (improved Double-Neubauer). Biomass productivity was calculated based on dry weight over 4 d of treatment. For dry weight, 50 mL of culture was filtered onto an oven-dried pre-weighed GF/C (0.45 μm glass fibre cellulose, GF/C- 47 mm filter paper), followed by drying in an oven at 70℃ for 24 h.
Chlorophyll (Chl) a, b and carotenoid concentrations were determined using acetone extraction method. Samples (10 mL) were collected on GF/C filter papers and extracted with 10 mL of analytical grade 100% acetone overnight. Supernatant was obtained by centrifugation (1 900×g, 5 min). Optical densities of the supernatant at 452 nm, 630 nm, 645 nm and 665 nm were used to determine pigment concentrations using the spectrophotometric equations in Strickland and Parson (1972). Data were presented as the ratio of carotenoids to chlorophylls as an estimation for the photooxidative state of microalgae (Millán-Oropeza and Fernández-Linares, 2017).
2.4 Pulse amplitude modulation (PAM) fluorometer measurementPhotosynthetic parameters were measured using a Water-PAM (Walz, Germany) (Ng et al., 2014). Briefly, each sample was dark-adapted for 15 min before exposure for each light level for 10 s in the measurement chamber. Maximum quantum efficiency (Fv/Fm) is a parameter used to indicate the physiological state of microalgae. Fv refers to the variable chlorophyll fluorescence and Fm refers to the maximum chlorophyll fluorescence, the ratio was used as an indicator of photosynthetic efficiency of photosystem Ⅱ (Yang et al., 2014).
2.5 Total soluble protein and carbohydrate contentFor total soluble protein content analysis, 50 mL of filtered algae cells on GF/C was homogenized with 10 mL 0.5 mol/L NaOH and subsequently incubated for 20 min in an 80℃ water bath. The sample was then centrifuged at 1 430×g for 10 min. To determine total soluble protein content of each sample, 5 μL of the supernatant was mixed with 250 μL Bradford reagent (Bio-Rad Laboratories, USA) in a 96-well microplate and incubated for 5 min. The absorbance readings were measured using a microplate spectrophotometer at 595 nm (BioTek Epoch, USA). Standard solutions with known concentrations of bovine serum albumin (BSA) were prepared to generate calibration curves.
The total carbohydrate content was determined using the phenol-sulfuric acid method (Dubois et al., 1956). Fifty millilitres of filtered algae cells on GF/C was homogenized in 10 mL 2 mol/L HCl, incubated in a water bath for 1 h at 80℃ and centrifuged at 1 430×g for 10 min. For each reaction, 20 μL supernatant, 20 μL 10% phenol and 200 μL concentrated sulfuric acid were mixed and incubated for 30 min. The absorbance value of the product was measured at 485 nm using a microplate spectrophotometer. Standard solutions with known concentrations of glucose were prepared to generate calibration curves.
2.6 Lipid and fatty acid analysis 2.6.1 Lipid extractionLipids from microalgae were extracted according to Bligh and Dyer (1959). Briefly, 50 mL filtered algal samples were homogenized in a hand-homogenizer followed by centrifugation at 1 430×g for 10 min at 4℃. The supernatant was mixed with 2 mL of chloroform and distilled water, vortexed and centrifuged again. The lower lipid layer was carefully drawn out, transferred to a pre-weighed glass vial and blown dry in gentle stream of nitrogen gas. The vials were then later placed in a desiccator and weighed until a constant weight was obtained.
2.6.2 Transesterification of fatty acid and gas chromatography-mass spectrometry (GC-MS) analysisLipid samples were trans-esterified in 1% sulphuric acid in methanol (Chu et al., 1994) and analysed using the QP-2010 Ultra GC-MS with A20i autosampler (Shimadzu, Japan) and Rt-2560 column (100 m× 0.25 mm×0.20 μm) (Supelco, USA). 99.9% helium was used as the carrier gas with the column flow rate of 20 cm/s and the pre-column pressure of 49.7 kPa. The column temperature regime was 140℃ for 2 min, followed by a 2℃/min ramp up to 225℃, held for 5 min, subsequently a 2℃/min ramp to 240℃ and followed by a 20-min-hold. The injection volume was 1 μL, the injection temperature was 250℃ and the split ratio was 100:1.
The mass spectrometer was operated in ionization energy of 70 eV. The ion source temperature was set at 200℃ and the interface temperature were set at 250℃. FAME (fatty acid methyl esters) peaks were identified by comparison of their retention times and ion spectra with authentic standards by GC-MS post run analysis, and quantified via multi-point external calibration curve of individual fatty acid methyl esters standard from Supelco 37 component FAME mix (Sigma-Aldrich, USA). All fatty acid methyl contents were represented in percentage of total fatty acid content (% TFA).
2.7 Metabolic profiling 2.7.1 Sample preparation and metabolite extractionAt the end of incubation, 500 mL of cultures was collected and cell pellets obtained by centrifugation at 1 900×g for 5 min. The cells were subsequently snapfrozen using liquid nitrogen, freeze-dried overnight at -50℃ and ~300 mbar and stored at -80℃ until extraction.
For each biological replicate, 5 mg freeze-dried algal powder was extracted with 1 mL cold 80% methanol containing 10 μg/mL Fmoc-GLY-OH as the internal standard. Lysing matrix E containing ceramic spheres, silica spheres and glass bead (MP Biochemicals, USA) were used to homogenize the samples in a bead ruptor (Omni International, USA). The bead-rupting process was performed at high speed for 20 s and 7 times. Samples were kept cool in ice throughout the process to prevent degradation.
The samples were centrifuged at 15 000×g and 4℃ for 7 min. The supernatant was subjected to sample clean-up using Captiva Non-Drip Lipid plate (Agilent Technology, USA) with vacuum applied to facilitate filtration. The filtrates were collected and stored at -80℃ prior to injection.
2.7.2 LC-MS data acquisitionData was acquired using an Infinity 1290 binary ultrahigh performance liquid chromatography (UHPLC) system coupled to a 6550 electrospray ionisation quadrupole time-of-flight mass spectrometer (LC-ESI-QTOF) (Agilent, USA). Protonated purine (m/z 121.050 9) and protonated hexakis (m/z 922.009 8) were selected as the reference masses for positive mode. Mass spectral source parameters were as follows: fragmentor voltage, 100 V; sheath gas temperature, 350℃; sheath gas flow, 9 L/min; nebulizer pressure, 25 psi; capillary voltage, 2 000 V; nozzle voltage, 1 500 V; drying gas temperature, 250℃; drying gas flow, 9 L/min. MS data was collected in centroid mode and positive ionization within the mass range of 50–1 000 m/z. Auto MS/MS method was used with collision energy set at 20 and 40 eV. Sample injection sequence was randomized to avoid systematic bias.
For each sample, 5 μL was injected onto the column at a flow rate of 0.2 mL/min. The C18 column (Zorbax 2.1×100 mm, 1.8 μm) was held at 50℃. Solvent A composed of 0.1% formic acid in ultrapure water and solvent B composed of 0.1% formic acid in acetonitrile. In the first 5 min, solvent B maintained at 5% and subsequently a linear gradient (5% to 95% solvent B) was applied for 10 min. Solvent B maintained at 95% for 5 min before returning to 5% at 21.5 min to 22 min. Post time was 3 min. Total time for each sample was 25 min. All samples were maintained in the auto-sampler tray at 8℃ throughout the run.
2.7.3 Data processing, multivariate analysis and metabolite annotationAgilent's MassHunter Qualitative software (version B.06.00) was used to visualize different chromatograms. Agilent raw data (.d) files were converted to.mzXML cross-platform open file format using the freely available MSconvert/Proteowizard software. The.mzXML files were uploaded to XCMS Online (http://xcmsonline.scripps.edu) for feature detection, retention time (RT) alignment, metabolite annotation and statistical analysis (Gowda et al., 2014). The data were analysed as pairwise job with the following settings: centWave feature detection at 15×10-6 maximal tolerated m/z deviation in consecutive scans, obiwarp retention time correction with 1 m/z step size (profStep) was used to generate the profiles and the feature alignments with allowable retention time deviation of 5 s. An unpaired parametric t-test (Welch t-test) was performed with a P-value threshold of 0.05 and fold-change (FC) of more than 1.5 to identify significant features. Annotation of significant features was performed by searching accurate masses of features against the METLIN database (http://www.metlin.scripps.edu) with mass tolerance of ±10×10-6.
Result tables generated from XCMS Online were also analysed by SIMCA 14 software to generate score plots of principal component analysis (PCA) and orthogonal partial least squares discriminant analysis (OPLS-DA). Pareto scaling was used for data normalization before multivariate data analysis (MVDA). PC1 and PC2 scores were used for the PCA models to reflect the main variation and separation in data (Worley and Powers, 2013).
MetaboAnalyst (http://www.metaboanalyst.ca/) was used to perform pathway analysis using the Arabidopsis thaliana library, hypergeometric test and relative-betweenness centrality algorithms. Pathway mapping was performed by searching against the Chlorella variabilis database in Kyoto Encyclopedia of Genes and Genomes (KEGG).
2.8 Statistical analysisAll data for growth parameters, photosynthetic efficiency and biochemical profiles were expressed as mean value±standard deviation (SD). To determine statistical significance between N+ and N- condition over time, repeated measures ANOVA (analysis of variance) was performed with Bonferroni confidence interval adjustment test using the SPSS (version 22) statistical software (IBM, USA).
3 RESULT 3.1 Effect of nitrogen deprivation on growth and photosynthetic efficiencyDaily growth of the culture was monitored based on optical density (OD) and cell density. Significant difference between N+ and N- culture in OD could be observed on day 2 of the stress condition. Under N-replete condition, cell density increased more than 12-fold at day 4 compared to day 0 (Fig. 1a). In contrast, cell density in N- culture only increased by 6-fold after 4 d, suggesting a lower rate of cell division.

|
| Fig.1 Changes in physiological parameters of Chlorella sp. under nitrogen-deprivation over time a. growth curve based on cell density; b. carotenoid to chlorophylls ratio; c. maximum quantum yield of photosystem Ⅱ (Fv/Fm) for N-replete (N+) and N-deplete (N-) conditions. Each data point is an average of three biological replicates and error bars represent standard deviation. Statistical significance between N+ and Ngroup are indicated by asterisks (* P < 0.05; ** P < 0.01). |
Photosynthetic pigment content was highly affected by nitrogen availability. Nitrogen-deplete culture turned yellowish-green in colour as the amount of chlorophyll a and b decreased, while the carotenoids increased. The Car:Chl(a+b) ratio of N- group were significantly higher than the N+ group (Fig. 1b).
Changes on photosynthetic pigment content are highly related to the photosynthetic efficiency in microalgae. Maximum quantum efficiency (Fv/Fm) is used to represent light harvesting complex and photosystem Ⅱ (PSⅡ) activity, and to indicate the physiological state of the cells under stress condition (Ng et al., 2014). During the 4-day incubation, the Fv/Fm values of N+ condition maintained between 0.75 and 0.83, indicating that the cultures were in a healthy state. On the contrary, the Fv/Fm values of Ncondition decreased significantly as early as day 1 (Fig. 1c).
3.2 Effect of nitrogen deprivation on biochemical compositionNitrogen is a key element in microalgae as the building block for macromolecules such as lipids, proteins and carbohydrates. Hence its availability had greatly influenced the biochemical composition of Chlorella sp. Removal of nitrate from the growth media significantly decreased the protein content in Chlorella sp. to 3.58±0.83, 2.27±0.78 and 1.80± 0.06 μg/million cells at day 1, 2 and 4 (Fig. 2). Higher carbohydrate content was observed in N- culture at day 1, 2 and 4 respectively. On day 4, the carbohydrate content in N- group accounted for 29.14% of the biomass compared to 12.32% in N+ group.

|
| Fig.2 Effect of nitrogen deprivation on biochemical composition of Chlorella sp. Each data point is an average of three biological replicates and error bars represent standard deviation. Significant difference between N+ and N- conditions are indicated by asterisks (* P < 0.05; ** P < 0.01). |
The results showed that the cells started to accumulate lipid at day 1 under N- condition. Lipid content at day 2 and 4 was similar for cells grown in N- media and significantly higher than the content in N+ media. The amount of lipid exceeded 50% of the biomass at day 2 and 4 in nitrogen-depleted cells. Total fatty acid (TFA) content remained similar between N+ and N- conditions during the first two days of nitrogen deprivation and increased significantly under N- condition at the last day of culture, approximately 3-fold higher than the TFA content of N+ condition.
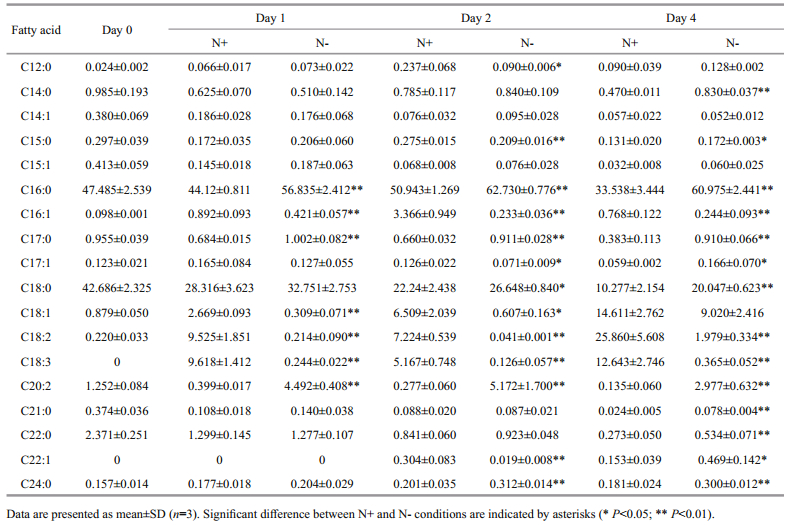
To analyze the changes in fatty acid composition, lipids in the cells were extracted, trans-esterified and quantified using GC-MS. The profiles of saturated fatty acid (SFA), monounsaturated fatty acid (MUFA) and polyunsaturated fatty acid (PUFA) were expressed in the form of percentage of total fatty acid content (%TFA) (Fig. 3). Nitrogen-deprivation led to an increase in SFA and decrease in MUFA and PUFA levels. SFA level in N- culture was 2-fold higher compared to N+ culture. MUFA level of N- culture was lower than N+ culture at all time points. PUFA was significantly lower in N- than N+ at day 1, 2 and 4 especially on day 4 where PUFA level was 6-fold lower in N- culture compared to N+ culture. The fatty acid profiles between N+ and N- culture were drastically different at day 4. In N+ culture, SFA constituted 45.37%±5.6%, MUFA constituted 15.68%±2.67% and PUFA constituted 38.64%±8.26% of total fatty acids, whereas in N- culture, SFA constituted 83.97%±3.02%, MUFA constituted 10.01%±2.48% and PUFA constituted 5.32%±0.92% of total fatty acids.

|
| Fig.3 Proportion of saturated fatty acid (SFA), monounsaturated fatty acid (MUFA) and polyunsaturated fatty acid (PUFA) presented as percentage of total fatty acids (%TFA) Each data point is an average of three biological replicates and error bars represent standard deviation. |
Individual profiles of 18 fatty acids were presented in Table 1. Palmitate (C16:0) and stearate (C18:0) were the major SFA detected in this study. C16:0 was present in high abundance on day 2 and day 4 in Nculture compared to N+ culture. C18:0 was notably higher (~2-fold) in N- culture than N+ culture at day 4. Other SFA (C14:0, C17:0, C21:0, C22:0 and C24:0) were also higher under nitrogen deprivation throughout the treatment period. For MUFA, the proportions of C16:1, C17:1 and C18:1 were lower in N- cultures. C22:1 was unable to be quantified at day 0 and 1, but significantly decreased at day 2 and increased at day 4 under nitrogen deprivation. For PUFA, C18:2 and C18:3 were significantly decreased while the proportion of C20:2 increased in N- culture across the experiment compared to N+ culture.
|
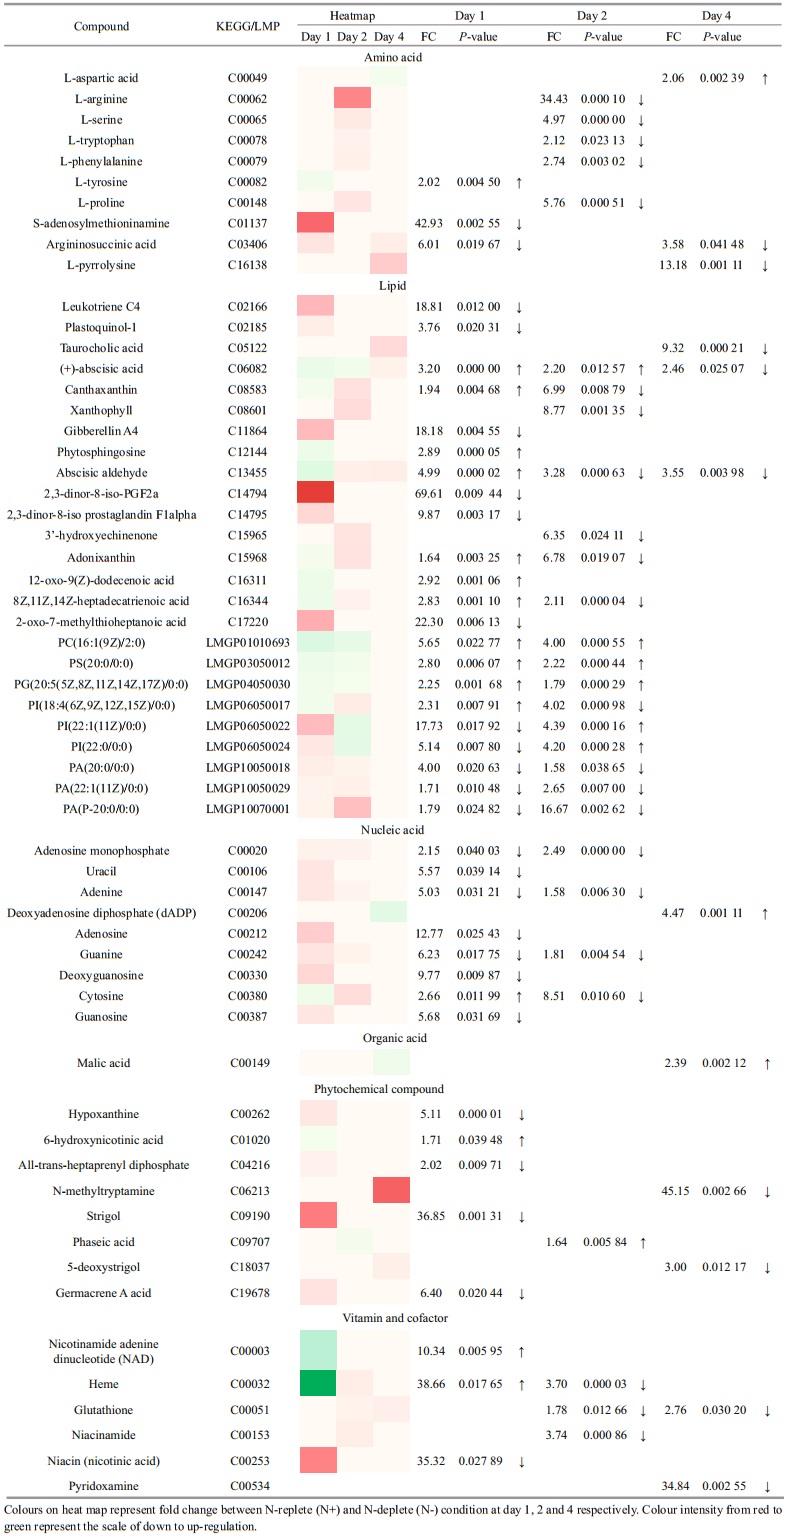
To assess the metabolic difference at various time points, PCA and OPLS-DA model were used to discriminate the two sample groups (N+ and N-) using the first two principal components. Distinct clustering was observed in the data of day 2 and day 4 (Fig. 4). The parameters of R2X, R2Y and Q2 revealed high discriminative and predictive stability of the model. From over a thousand features aligned in XCMS online, only 59 were selected and annotated using METLIN database based on statistical analysis (P < 0.05, fold change > 1.5) and their biological roles in Chlorella sp. Overall, the metabolites belonged to several classes, namely amino acids, lipids and fatty acids, nucleic acids, organic acid, phytochemical compounds, vitamins and cofactors. The heat map in Table 2 shows the fold change between N+ and Ncondition at day 1, 2 and 4. The annotated metabolites were classified using the KEGG BRITE mapping tool.

|
| Fig.4 PCA and OPLS-DA score plot of N-replete (N+) and N-deplete (N-) conditions a. day 1: R2X(cum)=0.668, Q2(cum)=0.502; day 2: R2X(cum)=0.601, Q2(cum)=0.352; day 4: R2X(cum)=0.776, Q2(cum)=0.636; b. OPLS-DA score plot displaying the degree of separation of the model. Day 1: R2X(cum)=0.732, R2Y(cum)=0.999, Q2(cum)=0.933; day 2: R2X(cum)=0.654, R2Y(cum)=0.999, Q2(cum)=0.937; day 4: R2X(cum)=0.81, R2Y(cum)=0.999, Q2(cum)=0.953. |
|
Protein and amino acid biosynthesis is highly affected by nitrogen deprivation. L-arginine was down-regulated for ~34-fold at day 2 in N- condition. S-adenosylmethioninamine, an intermediate in the polyamine biosynthesis pathway, was ~43-fold lower in N- condition. Argininosuccinic acid, an intermediate in urea cycle, was also down-regulated to channel nitrogen for other cellular functions. Phospholipids such as phosphostidylcholine (PC), phosphatidylglycerol (PG), phosphatidylinositol (PI), phosphatidic acid (PA) and phosphatidylserine (PS) were annotated in this study. PG increased 2.1 and 1.8-fold on day 1 and day 2 of nitrogen deprivation. Malic acid, an intermediate of tricarboxylic acid (TCA) cycle, increased for 2.39-fold at day 4.
KEGG compound identifiers of the annotated metabolites were analysed with the Pathway Analysis module in MetaboAnalyst to identify the most relevant pathways involved in nitrogen deprivation (Fig. 5). Purine metabolism was the most significant pathway, followed by carotenoid biosynthesis, nicotinate and nicotinamide metabolism, aminoacyltRNA biosynthesis, arginine and proline metabolism, and phenylalanine, tyrosine and tryptophan biosynthesis (raw P < 0.05, value obtained from enrichment analysis). The nucleic acids mapped to this pathway were hypoxanthine, adenosine monophosphate, adenosine, adenine, guanine, guanosine, dADP and deoxyguanosine. These compounds were downregulated in N-deplete condition at day 1 and 2 except dADP, which increased 4.47-fold at day 4. Carotenoid biosynthesis was the second most relevant pathway under nitrogen deprivation in Chlorella sp. Using the KEGG Mapper tool, abscisate, canthaxanthin, lutein, abscisic aldehyde, 3'-hydroxyechinenone and adonixanthin are intermediates of the carotenoid biosynthesis pathway of Chlorella variabilis. Metabolites mapped into the nicotinate and nicotinamide metabolism include L-aspartic acid, niacin and NAD.

|
| Fig.5 Significantly dysregulated and annotated metabolites analysed with Pathway Analysis Module in MetaboAnalyst 3.0 x-axis refers to the pathway impact values obtained from pathway topology analysis and y-axis displays the P-values generated from pathway over-representation analysis. Purine metabolism was the most relevant pathway in response to nitrogen deprivation, followed by carotenoid biosynthesis, nicotinate and nicotinamide metabolism and aminoacyl-tRNA biosynthesis (raw P < 0.01). |
This study provides an overview on the effects of nitrogen deprivation in Chlorella sp. Removal of nitrate in the growth media decreased growth rate, photosynthetic activity and changed biochemical profiles in the cells. A trend of desaturation in fatty acid profile was observed with the reduction of MUFA and PUFA and increment in SFA level, especially C16:0 and C18:0. General remodelling of metabolism began as early as day 1 after nitrogen deprivation. The metabolic profile study revealed that the annotated metabolites belonged to the following general pathway classes: purine metabolism, carotenoid biosynthesis, nicotinate and nicotinamide metabolism and amino acid metabolism.
Photosynthetic activity of microalgae is greatly influenced by nutrient availability. The decrease in photosynthetic efficiency (Fv/Fm) values was reported to be part of the acclimation process to nitrogen deprivation where lowered photosynthetic potential of PSII was involved in relocating available nitrogen to essential cellular functions and to balance photosynthetic electron flow (Salomon et al., 2013). It was also reported that nitrogen starvation reduced abundance of photosystem Ⅰ proteins, subunits of oxygen evolving complex of photosystem Ⅱ and the chloroplastic ATP synthase subunits, which subsequently impaired the photosynthetic efficiency in the microalgae (Wase et al., 2014). Under N-deplete condition, excessive electrons generated from photosynthesis result in over-reduction of the photosynthetic electron transport chain and production of cytotoxic reactive oxygen species. Pigments such as carotenoids and other secondary metabolites with antioxidant property were synthesized to protect the cells from oxidative damage. The lack of nitrogen in growth media reduced biosynthesis and promoted degradation of chlorophylls to provide nitrogenous resources for continuous survival (Msanne et al., 2012). The ratio of carotenoids to chlorophylls was also reported to correlate to the build-up of total fatty acids (TFA) percentage under nitrogen deprivation due to the predominant channelling of photosynthates to the biosynthesis of neutral lipids as a form of energy storage (Solovchenko et al., 2009). Impaired photosynthetic efficiency negatively impacted on carbon fixation and availability to form energy storage products (Li et al., 2015).
Total lipid content increased significantly on day 4 of nitrogen deprivation. During nutrient limitation, excess carbon resources are channelled to provide carbon resources in TAG or fatty acid biosynthesis as a survival strategy of algal cells under stress (Msanne et al., 2012). Upon onset of stress conditions, FAs are stored transiently as TAG and subsequently recycled to form plastidic lipids. In the event of severe stress conditions, TAG would be metabolized to sucrose as part of the adaptation mechanism. Cells enter into a cellular quiescence that is characterized by cessation of growth to conserve energy and nutrients (Allen et al., 2015). Limitation of nitrogen and phosphorus shifts the lipid metabolism from membrane (polar) lipid synthesis to neutral lipid storage (Juneja et al., 2013). Redistribution of major FA classes in Chlorella sp. over nitrogen deprivation was observed based on the results. The increase in proportion of SFA, presumed to be due to de novo fatty acid biosynthesis, accompanied by decrease in MUFA and PUFA suggested a trend of fatty acid saturation in the cells. The increase in fatty acid saturation is favourable as an energy sink because storage lipids in the form of TAGs are predominantly consisted of SFA (Sharma et al., 2012). In terms of application, this change is favourable as SFA are the preferred feedstock for biofuel production due to its oxidative stability (Stansell et al., 2012).
Expression levels of the metabolites related to the lipid and fatty acid biosynthesis pathway were also greatly influenced by the stress condition. Under various sub-optimal conditions, microalgal cells shifted carbon partitioning into the synthesis of starch and neutral lipids as the favourable energy storage products for cell survival and proliferation (Msanne et al., 2012). Phospholipids, the key components of cell membrane involved in microalgal cell-to-cell communication, were reported to be involved in stress response and photosynthesis (Lu et al., 2013). Phosphatidic acid, a central metabolite of cellular processes, plays an important role in TAG synthesis and also contributes as a substrate in the synthesis of PC (Hu et al., 2008). In this study, the level of PG was up-regulated at day 1 and 2 of nitrogen deprivation in the metabolic profile possibly to improve the incorporation of D1 proteins into the thylakoid membrane. Phosphatidylinositol, a lipid precursor of signalling molecules, was also up-regulated in Chlamydomonas nivalis in response to nitrogen deprivation (Lu et al., 2013). Phosphatidylglycerol, an eicosapentaenoic acid with five double bonds, is a common element in algal oil associated with chloroplast lipids (Martin et al., 2014). Overall, phospholipid content in microalgae were highly affected by nitrate levels in the culture. This finding is consistent with the observation in the nitrogenlimiting culture of Vischeria stellate (Gao et al., 2016).
Key metabolites containing nitrogen such as purines, pigments and various amino acids were mostly down-regulated in the N- condition to contribute and compensate nitrogen for protein synthesis (Park et al., 2015). In terms of the pathways involved, aminoacyl-tRNA biosynthesis, a major pathway reported in this study, was classified as a genetic information processing (translation) pathway. Arginine and proline metabolism, as well as phenylalanine, tyrosine and tryptophan biosynthesis were categorised under amino acid metabolism in KEGG. Purine metabolism is important for growth and development of plants as the precursors for nucleic acids, polysaccharides, phospholipids and secondary metabolites (Stasolla et al., 2003). Degradation of purine during N-deprivation in Chlamydomonas reinhardtii was proposed to be sourced from RNA breakdown to compensate the limiting nitrogen content required for protein synthesis (Park et al., 2015).
Malic acid, an intermediate of tricarboxylic acid (TCA) cycle, increased for 2.39-fold at day 4. It was reported that under N-deprivation, malate is transported into chloroplast for de novo fatty acid biosynthesis (Recht et al., 2014). Nitrogen deprivation was reported to increase expression of malic enzymes, which generates NADPH through NADP+ reduction upon conversion of malate to pyruvate. The pyruvate generated was transformed into acetyl-CoA, a precursor for subsequent lipid synthesis. Upregulation of malic enzyme results in significant lipid accumulation (Li et al., 2014). Algal cells were reported to use starch as a short-term carbon and energy storage product. In Haematococcus pluvialis cells exposed to nitrogen starvation, degradation of starch, increased activity of TCA cycle supply and carbon skeletons were redistributed to be utilized as precursors for fatty acid biosynthesis (Recht et al., 2014). Carotenoid biosynthesis was one of the significantly dysregulated pathways annotated in this study. This pathway is heavily involved in consuming electrons and thus contribute to cell protective mechanisms by scavenging free electrons or the damaging reactive oxygen species (Li et al., 2013). Among the metabolites involved, niacin (nicotinic acid) is a water-soluble vitamin while NAD is a coenzyme in biological systems. NAD was upregulated in 10.36-fold at day 1. This may be due to reduction of NADPH to NAD while providing electrons to fatty acid synthesis.
Overall, the changes in metabolic profile might be time-dependent as observed from the metabolic heatmap. Chlamydomonas reinhardtii, a model green alga, was reported to use different approaches in early and prolonged nitrogen deprivation. In early deprivation, chlorophyll biosynthesis was downregulated and the genes involved in pathways such as nitrogen and acetate assimilation, starch and sugar alcohol accumulation and remodelling of lipid membranes were increased. After prolonged nitrogen stress, genes directly involved in the TAG metabolism and intracellular lipid droplets were increased dramatically (Gargouri et al., 2015; Park et al., 2015). Differences in gene expression at different stages of nitrogen stress might be responsible to the changes in metabolic profile of Chlorella sp. at different time points.
5 CONCLUSIONThis study provides an overview on the effects of nitrogen deprivation in Chlorella sp. Removal of nitrate in the growth media decreased growth rate, photosynthetic activity and changed biochemical profiles in the cells. A trend of desaturation in fatty acid profile was observed with the reduction of MUFA and PUFA and increment in SFA level, especially C16:0 and C18:0. General remodelling of metabolism began as early as 24 h after nitrogen deprivation. The metabolic profile study reveal that the annotated metabolites belong to the following general pathway classes: purine metabolism, carotenoid biosynthesis, nicotinate and nicotinamide metabolism and amino acid metabolism. Taken together, findings of this study suggest that key processes involved are reshuffling of nitrogen from proteins and photosynthetic machinery, coupled with carbon repartitioning between carbohydrate and lipid molecules. It is hypothesised that Chlorella sp. redirect their photosynthetically fixed carbon toward lipids, while synchronously channelling their limiting nitrogen resources toward the nitrogen assimilation machinery (Levitan et al., 2015). For further studies, targeted metabolomics, combination of systems biology, bioinformatics and multiple gene targeting might be applied to reconstruct the key regulatory biomarkers in the response. This would provide more potential targets for metabolic engineering to improve biofuel production and productivity in Chlorella sp.
6 ACKNOWLEDGEMENTWe thank Assoc. Prof. Sanjay Swarup, Dr. Peter Benke and Dr. Shivshankar Umashankar at the Environmental Research Institute, National University of Singapore for their assistance in data analysis.
Allen J W, DiRusso C C, Black P N. 2015. Triacylglycerol synthesis during nitrogen stress involves the prokaryotic lipid synthesis pathway and acyl chain remodeling in the microalgae Coccomyxa subellipsoidea. Algal Res., 10: 110-120.
DOI:10.1016/j.algal.2015.04.019 |
Bligh E G, Dyer W J. 1959. A rapid method of total lipid extraction and purification. Can. J. Biochem. Physiol., 37(8): 911-917.
DOI:10.1139/o59-099 |
Chu W L, Phang S M, Goh S H. 1994. Studies on the production of useful chemicals, especially fatty acids in the marine diatom Nitzschia conspicua Grunow. Hydrobiologia, 285(1-3): 33-40.
DOI:10.1007/BF00005651 |
Dubois M, Gilles K A, Hamilton J K, Rebers P A, Smith F. 1956. Colorimetric method for determination of sugars and related substances. Anal. Chem., 28(3): 350-356.
DOI:10.1021/ac60111a017 |
Gao B Y, Yang J, Lei X Q, Xia S, Li A F, Zhang C W. 2016. Characterization of cell structural change, growth, lipid accumulation, and pigment profile of a novel oleaginous microalga, Vischeria stellata (Eustigmatophyceae), cultured with different initial nitrate supplies. J. Appl.Phycol., 28(2): 821-830.
DOI:10.1007/s10811-015-0626-1 |
Gao C F, Wang Y, Shen Y, Yan D, He X, Dai J B, Wu Q Y. 2014. Oil accumulation mechanisms of the oleaginous microalga Chlorella protothecoides revealed through its genome, transcriptomes, and proteomes. BMC Genomics, 15: 582.
DOI:10.1186/1471-2164-15-582 |
Gargouri M, Park J J, Holguin F O, Kim M J, Wang H X, Deshpande R R, Shachar-Hill Y, Hicks L M, Gang D R. 2015. Identification of regulatory network hubs that control lipid metabolism in Chlamydomonas reinhardtii. J. Exp. Bot., 66(15): 4551-4566.
DOI:10.1093/jxb/erv217 |
Gowda H, Ivanisevic J, Johnson C H, Kurczy M E, Benton H P, Rinehart D, Nguyen T, Ray J, Kuehl J, Arevalo B, Westenskow P D, Wang J H, Arkin A P, Deutschbauer A M, Patti G J, Siuzdak G. 2014. Interactive XCMS Online:simplifying advanced metabolomic data processing and subsequent statistical analyses. Anal. Chem., 86(14): 6931-6939.
DOI:10.1021/ac500734c |
Hu Q, Sommerfeld M, Jarvis E, Ghirardi M, Posewitz M, Seibert M, Darzins A. 2008. Microalgal triacylglycerols as feedstocks for biofuel production:perspectives and advances. Plant J., 54(4): 621-639.
DOI:10.1111/j.1365-313X.2008.03492.x |
Ito T, Tanaka M, Shinkawa H, Nakada T, Ano Y, Kurano N, Soga T, Tomita M. 2013. Metabolic and morphological changes of an oil accumulating trebouxiophycean alga in nitrogen-deficient conditions. Metabolomics, 9(S1): 178-187.
DOI:10.1007/s11306-012-0463-z |
Juneja A, Ceballos R M, Murthy G S. 2013. Effects of environmental factors and nutrient availability on the biochemical composition of algae for biofuels production:a review. Energies, 6(9): 4607-4638.
DOI:10.3390/en6094607 |
Levitan O, Dinamarca J, Zelzion E, Lun D S, Guerra L T, Kim M K, Kim J, Van Mooy B A S, Bhattacharya D, Falkowski P G. 2015. Remodeling of intermediate metabolism in the diatom Phaeodactylum tricornutum under nitrogen stress. Proc. Natl. Acad. Sci. U.S.A., 112(2): 412-417.
DOI:10.1073/pnas.1419818112 |
Li T T, Gargouri M, Feng J, Park J J, Gao D F, Miao C, Dong T, Gang D R, Chen SL. 2015. Regulation of starch and lipid accumulation in a microalga Chlorella sorokiniana. Bioresour. Technol., 180: 250-257.
DOI:10.1016/j.biortech.2015.01.005 |
Li Y Q, Han F X, Xu H, Mu J X, Chen D, Feng B, Zeng H Y. 2014. Potential lipid accumulation and growth characteristic of the green alga Chlorella with combination cultivation mode of nitrogen (N) and phosphorus (P). Bioresour. Technol., 174: 24-32.
DOI:10.1016/j.biortech.2014.09.142 |
Li Y T, Han D X, Yoon K, Zhu S N, Sommerfeld M, Hu Q. 2013. Molecular and cellular mechanisms for lipid synthesis and accumulation in microalgae: Biotechnological implications. In: Richmond A, Hu Q eds. Handbook of Microalgal Culture: Applied Phycology and Biotechnology. 2nd edn. John Wiley & Sons, Ltd, Oxford, UK. p.545-565. https://doi.org/10.1002/9781118567166.ch28.
|
Longworth J, Wu D Y, Huete-Ortega M, Wright P C, Vaidyanathan S. 2016. Proteome response of Phaeodactylum tricornutum, during lipid accumulation induced by nitrogen depletion. Algal Res., 18: 213-224.
DOI:10.1016/j.algal.2016.06.015 |
Lu N, Wei D, Chen F, Yang S T. 2013. Lipidomic profiling reveals lipid regulation in the snow alga Chlamydomonas nivalis in response to nitrate or phosphate deprivation. Process Biochem., 48(4): 605-613.
DOI:10.1016/j.procbio.2013.02.028 |
Martin G J O, Hill D R A, Olmstead I L D, Bergamin A, Shears M J, Dias D A, Kentish S E, Scales P J, Botté C Y, Callahan D L. 2014. Lipid profile remodeling in response to nitrogen deprivation in the microalgae Chlorella sp.(Trebouxiophyceae) and Nannochloropsis sp.(Eustigmatophyceae). PLoS One, 9(8): e103389.
DOI:10.1371/journal.pone.0103389 |
Millán-Oropeza A, Fernández-Linares L. 2017. Biomass and lipid production from Nannochloropsis oculata growth in raceway ponds operated in sequential batch mode under greenhouse conditions. Environ. Sci. Pollut. Res. Int., 24(33): 25618-25626.
DOI:10.1007/s11356-016-7013-6 |
Msanne J, Xu D, Konda A R, Casas-Mollano J A, Awada T, Cahoon E B, Cerutti H. 2012. Metabolic and gene expression changes triggered by nitrogen deprivation in the photoautotrophically grown microalgae Chlamydomonas reinhardtii and Coccomyxa sp. C-169. Phytochemistry, 75: 50-59.
DOI:10.1016/j.phytochem.2011.12.007 |
Ng F L, Phang S M, Periasamy V, Yunus K, Fisher A C. 2014. Evaluation of algal biofilms on indium tin oxide (ITO) for use in biophotovoltaic platforms based on photosynthetic performance. PLoS One, 9(5): e97643.
DOI:10.1371/journal.pone.0097643 |
Nichols H W, Bold H C. 1965. Trichosarcina polymorpha gen.et sp. nov. J. Phycol., 1(1): 34-38.
DOI:10.1111/j.1529-8817.1965.tb04552.x |
Park J J, Wang H X, Gargouri M, Deshpande R R, Skepper J N, Holguin F O, Juergens M T, Shachar-Hill Y, Hicks L M, Gang D R. 2015. The response of Chlamydomonas reinhardtii to nitrogen deprivation:a systems biology analysis. Plant J., 81(4): 611-624.
DOI:10.1111/tpj.12747 |
Recht L, Töpfer N, Batushansky A, Sikron N, Gibon Y, Fait A, Nikoloski Z, Boussiba S, Zarka A. 2014. Metabolite profiling and integrative modeling reveal metabolic constraints for carbon partitioning under nitrogen starvation in the green algae Haematococcus pluvialis. J.Biol. Chem., 289(44): 30387-30403.
DOI:10.1074/jbc.M114.555144 |
Salomon E, Bar-Eyal L, Sharon S, Keren N. 2013. Balancing photosynthetic electron flow is critical for cyanobacterial acclimation to nitrogen limitation. Biochim. Biophys.Acta, 1827(3): 340-347.
DOI:10.1016/j.bbabio.2012.11.010 |
Schmollinger S, Mühlhaus T, Boyle N R, Blaby I K, Casero D, Mettler T, Moseley J L, Kropat J, Sommer F, Strenkert D, Hemme D, Pellegrini M, Grossman A R, Stitt M, Schroda M, Merchant S S. 2014. Nitrogen-sparing mechanisms in Chlamydomonas affect the transcriptome, the proteome, and photosynthetic metabolism. Plant Cell, 26(4): 1410-1435.
DOI:10.1105/tpc.113.122523 |
Sharma K K, Schuhmann H, Schenk P M. 2012. High lipid induction in microalgae for biodiesel production. Energies, 5(5): 1532-1553.
DOI:10.3390/en5051532 |
Solovchenko A E, Khozin-Goldberg I, Cohen Z, Merzlyak M N. 2009. Carotenoid-to-chlorophyll ratio as a proxy for assay of total fatty acids and arachidonic acid content in the green microalga Parietochloris incisa. J. Appl.Phycol., 21(3): 361-366.
DOI:10.1007/s10811-008-9377-6 |
Stansell G R, Gray V M, Sym S D. 2012. Microalgal fatty acid composition:Implications for biodiesel quality. J. Appl.Phycol., 24(4): 791-801.
DOI:10.1007/s10811-011-9696-x |
Stasolla C, Katahira R, Thorpe T A, Ashihara H. 2003. Purine and pyrimidine nucleotide metabolism in higher plants. J.Plant Physiol., 160(11): 1271-1295.
DOI:10.1078/0176-1617-01169 |
Strickland J D H, Parsons T R. 1972. A Practical Handbook of Seawater Analysis. 2nd edn. Fisheries Research Board of Canada, Ottawa, Canada. 310p.
|
Wase N, Black P N, Stanley B A, DiRusso C C. 2014. Integrated quantitative analysis of nitrogen stress response in Chlamydomonas reinhardtii using metabolite and protein profiling. J. Proteome Res., 13(3): 1373-1396.
DOI:10.1021/pr400952z |
Worley B, Powers R. 2013. Multivariate analysis in metabolomics. Curr. Metabolomics, 1(1): 92-107.
DOI:10.2174/2213235X11301010092 |
Yang D W, Zhang Y T, Barupal D K, Fan X L, Gustafson R, Guo R B, Fiehn O. 2014. Metabolomics of photobiological hydrogen production induced by CCCP in Chlamydomonas reinhardtii. Int. J. Hydrogen Energy, 39(1): 150-158.
DOI:10.1016/j.ijhydene.2013.09.116 |
Yang Z K, Niu Y F, Ma Y H, Xue J, Zhang M H, Yang W D, Liu J S, Lu S H, Guan Y F, Li H Y. 2013. Molecular and cellular mechanisms of neutral lipid accumulation in diatom following nitrogen deprivation. Biotechnol.Biofuels, 6(1): 67.
DOI:10.1186/1754-6834-6-67 |