 2019, Vol. 37
Institute of Oceanology, Chinese Academy of Sciences
Article Information
- LI Caijuan, TENG Teng, SHEN Fanfan, GUO Jinqiang, CHEN Yining, ZHU Chuankun, LING Qufei
- Transcriptome characterization and SSR discovery in Squaliobarbus curriculus
- Journal of Oceanology and Limnology, 37(1): 235-244
- http://dx.doi.org/10.1007/s00343-019-7298-7
Article History
- Received Nov. 2, 2017
- accepted in principle Jan. 20, 2018
- accepted for publication Apr. 19, 2019


2 School of Life Science, Huaiyin Normal University, Huaian 223300, China
Squaliobarbus curriculus is a freshwater fish of high nutritional and economic value. With the exception of the Qinghai-Tibet Plateau and the Hexi Corridor, this species is widely distributed throughout the rivers and lakes of China (Li et al., 2010; Liu et al., 2012). Because it is vigorous and resistant to diseases, S. curriculus has been eyed as a potential candidate for aquaculture (Yang et al., 2013). Unfortunately, the natural habitat of S. curriculus is being destroyed, and the total catch of this species from the Zhujiang and Changjiang rivers has decreased sharply in recent decades as a result of overfishing and hydropower projects (Yi et al., 2010; Liu et al., 2012). Sampling of lakes such as Hongzehu Lake (the fourth largest freshwater lake in China, at 2 069 km2) have shown that S. curriculus is difficult to locate and may even be undergoing a decline in genetic diversity. Greater efforts to study the population genetics of S. curriculus and to protect its germplasm resources are thus needed. Information on the genetic structure of fish species is essential for optimizing fisheries management and stock improvement programs. One obstacle impeding genetic research on S. curriculus is the lack of effective genetic markers. Because they are locus-specific, codominant, multiallelic, and abundant in the genome, simple sequence repeats (SSRs or microsatellite markers) are molecular markers of great importance (O'Connell and Wright, 1997). SSRs have been widely used in population structure analyses (Qin et al., 2014) and in marker-assisted breeding of many organisms (Vandeputte et al., 2011; Kumar et al., 2015; Guo et al., 2017). However, the number of S. curriculus DNA and RNA sequences available in GenBank is limited and little research has focused on the SSR genetic diversity of S. curriculus populations. With the advent of next-generation sequencing technology (Metzker, 2010), sequencing has become progressively more efficient. Massive RNA sequencing (RNA-seq) provides a reliable, fast, and cost-effective approach for generating large quantities of expressed sequence tags (ESTs) in non-model species (Shiel et al., 2015; Zhang et al., 2017; Du et al., 2018). Unlike genomic SSR markers, EST-SSRs can be used to analyze the genetic structure of species such as S. curriculus and to help identify candidate functional genes at the same time. We therefore used Illumina RNA-seq to obtain deep insights into the transcriptome of S. curriculus while simultaneously developing a large number of efficient SSR molecular markers.
In this study, eight tissues of three S. curriculus individuals were subjected to RNA-seq, and thousands of SSRs were developed from the resulting transcript database. The large number of transcriptomic sequences and SSR markers generated in this study may provide a useful foundation for investigating S. curriculus population genetics and facilitate the protection of its germplasm resources. In addition, our results may further improve the identification and exploitation of functional genes in the future.
2 MATERIAL AND METHOD 2.1 Ethics statementAll experiments performed on animals in this study were in accordance with the ethical guidelines of Soochow University on the care and use of experimental animals.
2.2 SamplingTissues were collected from one 1-year-old and two 2-year-old S. curriculus individuals of unknown sex taken from a culture pond of Suzhou Shajiabang East Lake Modern Fishery Science and Technology Development Co., Ltd. Eight types of tissues (muscle, bone, gill, fin, intestine, brain, liver, and kidney) were obtained, frozen in liquid nitrogen, and stored in a freezer at -80℃.
2.3 RNA extraction, library preparation, and Illumina sequencingAfter pooling of tissues, total RNA was extracted with Trizol reagent according to the manufacturer's protocol (Life Technologies, Carlsbad, CA, USA). RNA integrity and concentration were determined using a NanoDrop ND-1000 spectrophotometer (Thermo Scientific, Wilmington, DE, USA) and an Agilent 2100 Bioanalyzer (Agilent Technologies, Santa Clara, CA, USA). mRNA was isolated from total RNA using an NEBNext Poly(A) mRNA Magnetic Isolation Module (NEB, E7490). A cDNA library was constructed using a NEBNext Ultra RNA Library Prep Kit for Illumina (NEB, E7530) and NEBNext Multiplex Oligos for Illumina (NEB, E7500) following the supplied instructions. Finally, the generated S. curriculus cDNA library was sequenced on an Illumina HiSeq 2500 sequencing platform with a read length of 2×125 bp.
2.4 Sequence cleaning and assemblyFollowing RNA-seq, initial raw reads were filtered through SeqPrep (https://github.com/jstjohn/SeqPrep) and Condetri_v2.0.pl (http://code.google.com/p/condetri/downloads/detail?name=condetri_v2.0.pl) software to remove low-quality reads (quality score < 25) and adapter sequences. The resulting clean reads, 89.79% of which had a quality score above 30 (i.e., base call accuracy > 99.9%), were assembled with Trinity software using default parameters (Grabherr et al., 2011).
2.5 Transcriptome functional annotationAll transcripts were compared against NCBI nonredundant protein (Nr) (Deng et al., 2006), Swiss-Prot protein (Swiss-Prot) (Apweiler et al., 2004), Gene Ontology (GO) (Ashburner et al., 2000), Clusters of Orthologous Groups (COG) (Tatusov et al., 2000), Eukaryotic Orthologous Groups (KOG) (Koonin et al., 2004), and Kyoto Encyclopedia of Genes and Genomes (KEGG) databases (Kanehisa et al., 2004) using BlastX software (E-value < 1×10⁻⁵) (Altschul et al., 1997).
2.6 Identification and validation of SSRsMicrosatellites with a 10-bp minimum repeat length, including di- to hexa-nucleotide motifs, were identified using MISA software. Primer 3.0 was then used to design amplification primers for all loci with suitable flanking sequences (Rozen and Skaletsky, 2000). Fifty of these SSR loci were randomly selected and screened for polymorphism in 32 individuals from Hongzehu Lake. Each 20-μL reaction mixture in the PCR analysis contained 150–200 ng of template DNA, 2× PCR Mix (CW2296, Shiji Kangwei, Beijing, China), and 0.4 μmol/L of each primer. The following PCR protocol was used: 94℃ for 3 min, followed by 25 cycles of 94℃ for 30 s, a specific annealing temperature for 40 s, and 72℃ for 30 s, with a final extension step of 72℃ for 5 min. Separation of alleles was performed by polyacrylamide gel electrophoresis on a 6% (w/v) gel (Sangon, Shanghai, China). Loci found to be polymorphic were used to genotype the 32 S. curriculus individuals. Popgene 32 software was used to calculate genetic diversity and number of alleles. The polymorphism information content (PIC) of each SSR marker was calculated as follows:
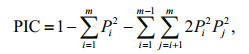
where Pi and Pj are the frequency of the ith and jth alleles of a given SSR marker and m means the total number of detected alleles for that marker (Botstein et al., 1980).
3 RESULT 3.1 Sequence assemblyAll sequence data were deposited in the NCBI Sequence Read Archive database under accession number SRP065291. After filtering of low-quality reads, the remaining 22 206 590 clean paired reads (5.60 Gb) were assembled into 204 027 transcripts (Additional file 1), 41.46% (84 589) of which were longer than 1 000 bp. The frequency distribution of transcript lengths is shown in Fig. 1. Overall, the transcripts covered a total of 297 318 695 bp, with an average sequence length of 1 457 bp. The mean length of all 108 706 unigenes was 727 bp.

|
| Fig.1 Size distribution of assembled transcripts from Squaliobarbus curriculus |
In total, 111 934 (54.86%) and 75 992 (37.25%) transcripts had significant matches in Nr and Swiss-Prot databases, respectively (Additional file 2). Most of the 111 934 S. curriculus transcripts, i.e., 75.50% (84 509), showed matches to Danio rerio, followed by Astyanax mexicanus (9 425) and Oncorhynchus mykiss (2 329) (Fig. 2).

|
| Fig.2 Number of Squaliobarbus curriculus transcripts with homologs in the indicated species in the Nr database |
A total of 60 450 transcripts were assigned to 61 GO terms in the three categories of biological process, cellular component, and molecular function (Fig. 3). The largest group in the biological process category was cellular process (55.62%), followed by metabolic process (48.71%), single-organism process (46.86%), and biological regulation (31.56%). Among all annotated transcripts, 60 were classified into five growth-related GO terms: growth (GO:0040007), growth hormone receptor signaling pathway (GO:0060396), growth hormone secretion (GO:0030252), growth plate cartilage chondrocyte proliferation (GO:0003419), and growth plate cartilage development (GO:0003417) (Additional file 3). Under molecular function, 57.11% of transcripts were assigned to binding, followed by catalytic activity (41.61%), transporter activity (6.35%), and molecular transducer activity (5.46%). Cell part (43.12%) and cell (43.06%) predominated in the cellular component category, followed by organelles (26.64%) and membrane (22.86%).

|
| Fig.3 Gene Ontology classification of annotated transcripts from Squaliobarbus curriculus |
A total of 34 830 of the 204 027 assembled transcripts were assigned to 24 COGs, including cellular structure, biochemistry metabolism, molecular processing, and signal transduction (Fig. 4). The cluster for general function (12 864; 36.93%) was the largest group, followed by replication, recombination, and repair (5 924; 17.00%), transcription (5 389; 15.47%), signal transduction mechanisms (5 271; 15.13%), post-translational modification, protein turnover, and chaperones (4 303; 12.35%), and amino acid transport and metabolism (2 104; 6.04%). Only 24 and 40 transcripts were assigned to nuclear structure and cell motility terms, respectively. No transcripts were assigned to extracellular structures.

|
| Fig.4 Clusters of Orthologous Groups (COG) classification of transcripts from Squaliobarbus curriculus |
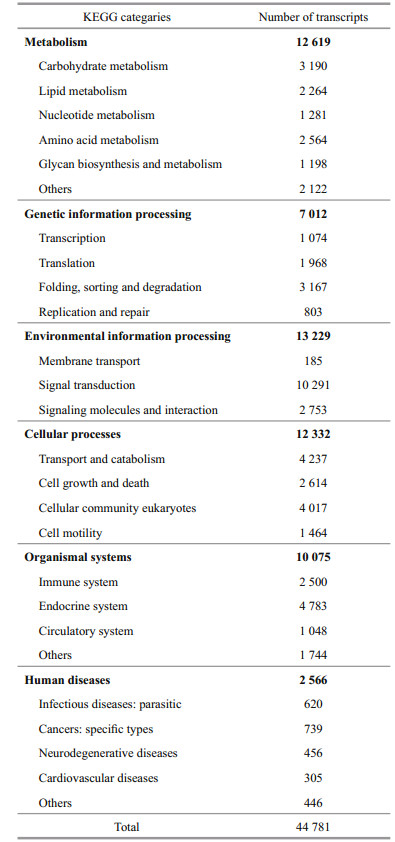
KEGG pathway analysis was performed on all transcripts for functional categorization and annotation. Ko numbers were assigned to 44 781 (21.95%) transcripts, which categorized them into different functional groups (Table 1). Of all these annotated transcripts, 12 619 (28.2%) were classified into the metabolism, including majority subgroups of carbohydrate metabolism (3 190), lipid metabolism (2 264), amino acid metabolism (2 564) and other eight subgroups. Transcripts assigned into the genetic information processing were 7 012, including transcription (1 074), translation (1 968), folding, sorting and degradation (3 167), and replication and repair (803). Environmental information processing accounted for 13 229 (29.5%), consisting of membrane transport (185), signal transduction (10 291), signaling molecules and interaction (2 753). Cellular processes, organismal systems, human diseases contained 12 332 (27.5%), 10 075 (22.5%), and 2 566 (5.7%) transcripts, respectively. In addition, all the 44 781 transcripts were mapped into 230 cellular metabolic or signaling pathways and the three biggest clusters were endocytosis (2 259), ubiquitin-mediated proteolysis (1 744), and the MAPK signaling pathway (1 719) (Additional file 4).
SSR characterization of transcripts longer than 1 000 bp identified 51 426 SSRs (perfect SSRs; 93.78%, 48 229). The frequency of SSRs in the S. curriculus transcriptome was 25.21%, with a distribution density of 5.78 per Kb. Among perfect SSRs, the most abundant repeat motifs were mononucleotides (49.93%), followed by di- (28.22%), tri- (14.36%), tetra- (1.20%), penta- (0.06%), and hexanucleotides (0.02%) (Fig. 5).

|
| Fig.5 Distribution of SSR types in the Squaliobarbus curriculus transcriptome p1–p6 represent perfect mononucleotide to hexanucleotide SSRs, respectively; c refers to compound SSRs; red and blue colomns represent SSR frequency and SSR number, respectively. |
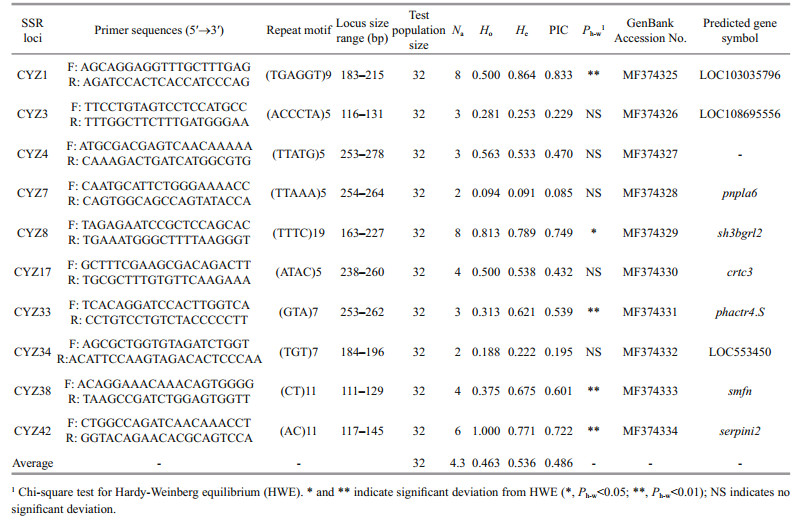
A total of 36 149 primer pairs were designed from 51 426 SSR-containing sequences, with 50 non-mononucleotide SSR primer pairs randomly selected for validation (Additional file 5). Of these 50 primer pairs, 25 (50%) yielded amplification products in 32 randomly chosen S. curriculus individuals. Further analysis revealed that 10 microsatellite loci (40%) were polymorphic, with the number of alleles per locus varying from 2 to 8 (mean of 4.3). The observed mean heterozygosity (Ho) was 0.462 5, and the expected heterozygosity (He) was 0.535 6. PIC values for the SSR markers ranged from 0.085 4 to 0.832 8, with an average value of 0.485 5 (Table 2).
|
To identify microsatellite markers for genetic diversity analysis of S. curriculus from Hongzehu Lake and to establish a relatively large transcriptome database for further research, we sequenced a pooled sample of eight tissues. Overall, 204 027 transcripts were acquired, a far greater number than that reported for fish species such as Sander lucioperca (56 746) and Paramisgurnus dabryanus (71 887) (Li et al., 2015; Han et al., 2016). The average length of all transcripts was 1 457 bp, similar to those of Sander lucioperca (1 474 bp) and Paramisgurnus dabryanus (1 465 bp) but longer than that of Pelodiscus sinensis (1 275 bp) (unpublished data). The long average length of sequences in the current study may be due to our large database (5.60 Gb), as a deeper sequence depth leads to better assembly of the database. Following the development of bioinformatic tools, de novo transcriptome assembly no longer suffers from the disadvantages of Illumina sequence assembly (Zhao, 2011); an ideal sequence length can thus be achieved. Given that long sequences have more potential for SSR marker identification (Zalapa et al., 2012), our results suggest that RNA-seq provides an efficacious, cost-effective option for SSR development.
4.2 Functional annotation, classification, and comparative analysisPrediction of open reading frames (ORFs) revealed that 55.05% (59 843) of the 108 706 unigenes in this study had an ORF longer than 200 bp, which is a greater proportion than that found in Paramisgurnus dabryanus (Li et al., 2015) and Megalobrama amblycephala (Gao et al., 2012b). Comparison with the Nr database indicated that 84 509 transcripts from the S. curriculus transcriptome (41.42%) had a homology match with D. rerio; this level is similar to proportions in Scophthalmus maximus (44.8%) (Pereiro et al., 2012) and Megalobrama amblycephala (40.5%) (Gao et al., 2012b), but lower than those in Paramisgurnus dabryanus (43 807; 60.98%) (Li et al., 2015) and common carp (27 693; 75.2%) (Ji et al., 2012). Nevertheless, 45.14% of the 204 027 transcripts exhibited no significant similarity with entries in the Nr database. This dissimilarity may be attributable to the presence of novel genes or may be due to untranslated regions (5′- and 3′-untranslated coding regions) and non-conserved areas of proteins. Many S. curriculus transcripts were additionally assigned to various GO categories and COG classifications. Among them, 44 781 transcripts (21.95%) were grouped into 230 cellular metabolic or signaling pathways. This number of pathways is similar to that observed for the Oviductus ranae transcriptome database (218) (Zhang et al., 2013), but less than that found in Sander lucioperca (322) and Bagarius yarrelli (242) (Han et al., 2016; Du et al., 2018). All of our annotations provide valuable information for investigating specific processes, functions, and pathways in S. curriculus. This study firstly performed transcriptome sequencing analysis of S. curriculus, the huge amounts of transcripts provides valuable sequence information for novel gene discovery of this species. Well-annotated and categorized transcripts could serve us important and valuable resources for gene identification and functional analysis of specific traits in S. curriculus. The 60 well-annotated growth associated transcripts found in this study (Additional file 3) may be beneficial for fast-growing strain selection of S. curriculus in the future.
4.3 SSR frequency and distribution in the S. curriculus transcriptomePolymorphic SSR markers play an important role in population genetics studies, genetic linkage map development, and trait-association analyses (Qin et al., 2014; Guo et al., 2017). In the present investigation, 51 426 perfect SSRs longer than 12 bp were identified from the S. curriculus transcriptome. This result corresponds to an average frequency of 0.25 SSR per transcript, a higher level than that reported in Phoca largha (0.024; Gao et al., 2012a), Paramisgurnus dabryanus (0.21; Li et al., 2015), and Pelodiscus sinensis (0.23; unpublished data). This higher frequency may be due to the longer average length of the sequences in our study, a consequence of the effective assembly of our dataset. The distribution density in our study, one SSR per 5.78 kb, was higher than that reported for fish species such as Paramisgurnus dabryanus (one SSR per 6.99 kb; Li et al., 2015), Phoca largha (one SSR per 9.65 kb; Gao et al., 2012a), and M. amblycephala (one SSR per 9.53 kb; Gao et al., 2012b), but lower than that for Bagarius yarrelli (one SSR per 2.07 kb; Du et al., 2018). SSR density may be influenced by a few factors, such as differences in SSR detection criteria or SSR detection software (Varshney et al., 2005; Wei et al., 2008), transcriptome structure (Toth et al., 2000) and sequencing data size.
4.4 Polymorphism of SSR markersHalf of the 50 tested S. curriculus SSR primer pairs yielded PCR products. The remaining primer sequences, which failed to produce amplicons, may have been specific for regions located across splice sites, chimeric, or of poor quality. In the present study, 40% of the generated amplicons were polymorphic, a lower rate than that observed in Paramisgurnus dabryanus (88.4%; Li et al., 2015). According to our analysis of SSR genetic diversity, the mean number of alleles and PIC per locus were 4.3 and 0.485 5, respectively; both of these values were lower than those estimated for Paramisgurnus dabryanus (6.6 and 0.626, respectively). This result indicates that the polymorphism rate of SSRs in the S. curriculus transcriptome is relatively low (PIC < 0.5). The mean expected heterozygosity (He) was 0.535 6, a value higher than that reported for freshwater fishes (0.46; Dewoody and Avise, 2000). This result suggests that the diversity of the S. curriculus population in Hongzehu Lake is higher than that of most freshwater fishes even though this species is difficult to capture. Overall, we identified 51 426 SSRs in our dataset, which may prove useful for future population genetic structure assessment, germplasm protection, and linkage map construction in S. curriculus.
5 CONCLUSIONIn this study, the Illumina platform was used for transcriptome sequencing of S. curriculus, an economically important fish species. Large quantities of candidate SSR markers were identified, 50 of which were verified and applied for genetic structure evaluation of the Hongzehu Lake S. curriculus population. Our findings provide deep insights into the transcriptome profile of S. curriculus and distribution of SSR markers. The candidate markers identified in our study should prove useful for population genetic studies of S. curriculus, while the large quantity of generated sequence data may facilitate functional gene discovery in the future.
6 DATA AVAILABILITY STATEMENTRaw sequence data that support the findings of this study have been deposited in the NCBI Sequence Read Archive database under accession number SRP065291. Full information on SSRs developed from this study are available from the corresponding author upon reasonable request.
Electronic supplementary materialSupplementary material (Additional files 1-5) is available in the online version of this article at https://doi.org/10.1007/s00343-019-7298-7.
Altschul S F, Madden T L, Schäffer A A, Zhang J H, Zhang Z, Miller W, Lipman D J. 1997. Gapped BLAST and PSIBLAST:a new generation of protein database search programs. Nucleic Acids Res., 25(17): 3 389-3 402.
DOI:10.1093/nar/25.17.3389 |
Apweiler R, Bairoch A, Wu C H, Barker W C, Boeckmann B, Ferro S, Gasteiger E, Huang H Z, Lopez R, Magrane M, Martin M J, Natale D A, O'Donovan C, Redaschi N, Yeh L S L. 2004. UniProt:the Universal Protein knowledgebase. Nucleic Acids Res., 32(S1): D115-D119.
|
Ashburner M, Ball C A, Blake J A, Botstein D, Butler H J, Cherry J M, Davis A P, Dolinski K, Dwight S S, Eppig J T, Harris M A, Hill D P, Issel-Tarver L, Kasarskis A, Lewis S, Matese J C, Richardson J E, Ringwald M, Rubin G M, Sherlock G. 2000. Gene ontology:tool for the unification of biology. Nat. Genet., 25(1): 25-29.
DOI:10.1038/75556 |
Botstein D, White R L, Skolnick M, Davis R W. 1980. Construction of a genetic linkage map in man using restriction fragment length polymorphisms. Am. J. Hum.Genet., 32(3): 314-331.
|
Deng Y Y, Li J Q, Wu S F, Zhu Y P, Chen Y W, He F C. 2006. Integrated Nr database in protein annotation system and its localization. Comput. Eng., 32(5): 71-74.
|
Dewoody J A, Avise J C. 2000. Microsatellite variation in marine, freshwater and anadromous fishes compared with other animals. J. Fish Biol., 56(3): 461-473.
DOI:10.1111/jfb.2000.56.issue-3 |
Du M, Li N, Niu B Z, Liu Y H, You D J, Jiang D F, Ruan C Q, Qin Z Q, Song T W, Wang W T. 2018. De novo transcriptome analysis of Bagarius yarrelli (Siluriformes:Sisoridae) and the search for potential SSR markers using RNA-seq. PLoS One, 13(2): e0190343.
DOI:10.1371/journal.pone.0190343 |
Gao X G, Han J B, Lu Z C, Li Y F, He C B. 2012a. Characterization of the spotted seal Phoca largha transcriptome using Illumina paired-end sequencing and development of SSR markers. Comp. Biochem. Physiol.Part D Genomics Proteomics, 7(3): 277-284.
DOI:10.1016/j.cbd.2012.05.001 |
Gao Z X, Luo W, Liu H, Zeng C, Liu X L, Yi S K, Wang W M. 2012b. Transcriptome analysis and SSR/SNP markers information of the blunt snout bream (Megalobrama amblycephala). PLoS One, 7(8): e42637.
DOI:10.1371/journal.pone.0042637 |
Grabherr M G, Haas B J, Yassour M, Levin J Z, Thompson D A, Amit I, Adiconis X, Fan L, Raychowdhury R, Zeng Q D, Chen Z H, Mauceli E, Hacohen N, Gnirke A, Rhind N, Di Palma F, Birren B W, Nusbaum C, Lindblad-Ton K, Friedman N, Regev A. 2011. Full-length transcriptome assembly from RNA-Seq data without a reference genome. Nat. Biotechnol., 29(7): 644-652.
DOI:10.1038/nbt.1883 |
Guo Y W, Wu Y Q, Anderson J A, Moss J Q, Zhu L, Fu J M. 2017. SSR marker development, linkage mapping, and QTL analysis for establishment rate in Common bermudagrass. Plant Genome, 10(1).
DOI:10.3835/plantgenome2016.07.0074 |
Han X F, Ling Q F, Li C J, Wang G C, Xu Z C, Lu G Q. 2016. Characterization of pikeperch (Sander lucioperca) transcriptome and development of SSR markers. Biochem.Syst. Ecol., 66: 188-195.
DOI:10.1016/j.bse.2016.04.001 |
Ji P F, Liu G M, Xu J, Wang X M, Li J T, Zhao Z X, Zhang X F, Zhang Y, Xu P, Sun X W. 2012. Characterization of common carp transcriptome:sequencing, De novo assembly, annotation and comparative genomics. PLoS One, 7(4): e35152.
DOI:10.1371/journal.pone.0035152 |
Kanehisa M, Goto S, Kawashima S, Okuno Y, Hattori M. 2004. The KEGG resource for deciphering the genome. Nucleic Acids Res., 32(S1): D277-D280.
|
Koonin E V, Fedorova N D, Jackson J D, Jacobs A R, Krylov D M, Makarova K S, Mazumder R, Mekhedov S L, Nikolskaya A N, Rao B S, Rogozin I B, Smirnov S, Sorokin A V, Sverdlov A V, Vasudevan S, Wolf Y I, Yin J J, Natale D A. 2004. A comprehensive evolutionary classification of proteins encoded in complete eukaryotic genomes. Genome Biol., 5(2): R7.
DOI:10.1186/gb-2004-5-2-r7 |
Kumar M, Choi J Y, Kumari N, Pareek A, Kim S R. 2015. Molecular breeding in Brassica for salt tolerance:importance of microsatellite (SSR) markers for molecular breeding in Brassica. Front. Plant Sci., 6: 688.
|
Li C J, Ling Q F, Ge C, Ye Z Q, Han X F. 2015. Transcriptome characterization and SSR discovery in large-scale loach Paramisgurnus dabryanus (Cobitidae, Cypriniformes). Gene, 557(2): 201-208.
|
Li J, Li X H, Jia X P, Li Y F, He M F, Tan X C, Wang C, Jiang W X. 2010. Evolvement and diversity of fish community in Xijiang River. J. Fish Sci. China, 17(2): 298-311.
(in Chinese with English abstract) |
Liu Q L, Xiao T Y, Liu M, Zhou W. 2012. Research progress of biology in Squaliobarbus curriculus. Fish. Sci., 31(11): 687-691.
(in Chinese with English abstract) |
Meng X H, Wang Q Y, InKwon J, Liu P, Kong J. 2009. Genetic differentiation in seven geographic populations of the fleshy shrimp Penaeus (Fenneropenaeus) chinensis based on microsatellite DNA. Aquaculture, 287(1-2): 46-51.
DOI:10.1016/j.aquaculture.2008.10.030 |
Metzker M L. 2010. Sequencing technologies-the next generation. Nat. Rev. Genet., 11(1): 31-46.
DOI:10.1038/nrg2626 |
O'Connell M, Wright J M. 1997. Microsatellite DNA in fishes. Rev. Fish Biol. Fish., 7(3): 331-363.
DOI:10.1023/A:1018443912945 |
Pereiro P, Balseiro P, Romero A, Dios S, Forn-Cuni G, Fuste B, Planas J V, Beltran S, Novoa B, Figueras A. 2012. High-throughput sequence analysis of turbot (Scophthalmus maximus) transcriptome using 454-pyrosequencing for the discovery of antiviral immune genes. PLoS One, 7(5): e35369.
DOI:10.1371/journal.pone.0035369 |
Qin Y, Sun D Q, Xu T J, Liu X Z, Sun Y N. 2014. Genetic diversity and population genetic structure of the Miiuy croaker, miichthys miiuy, in the East China Sea by microsatellite markers. Genet. Mol. Res., 13(4): 10 600-10 606.
DOI:10.4238/2014.December.18.1 |
Rozen S, Skaletsky H. 2000. Primer3 on the WWW for general users and for biologist programmers. In: Misener S, Krawetz S A eds. Bioinformatics Methods and Protocols.Humana Press, Totowa, NJ. p.365-386.
|
Shiel B P, Hall N E, Cooke I R, Robinson N A, Strugnell J M. 2015. De novo characterisation of the greenlip abalone transcriptome (Haliotis laevigata) with a focus on the heat shock protein 70 (HSP70) family. Mar. Biotechnol., 17(1): 23-32.
DOI:10.1007/s10126-014-9591-y |
Tatusov R L, Galperin M Y, Natale D A, Koonin E V. 2000. The COG database:a tool for genome-scale analysis of protein functions and evolution. Nucleic Acids Res., 28(1): 33-36.
DOI:10.1093/nar/28.1.33 |
Tóth G, Gáspári Z, Jurka J. 2000. Microsatellites in different eukaryotic genomes:survey and analysis. Genome Res., 10(7): 967-981.
DOI:10.1101/gr.10.7.967 |
Vandeputte M, Rossignol M N, Pincent C. 2011. From theory to practice:empirical evaluation of the assignment power of marker sets for pedigree analysis in fish breeding. Aquaculture, 314(1-4): 80-86.
DOI:10.1016/j.aquaculture.2011.01.043 |
Varshney R K, Graner A, Sorrells M E. 2005. Genic microsatellite markers in plants:features and applications. Trends Biotechnol., 23(1): 48-55.
DOI:10.1016/j.tibtech.2004.11.005 |
Wei L B, Zhang H Y, Zheng Y Z, Guo W Z, Zhang T Z. 2008. Developing EST-derived microsatellites in sesame(Sesamum indicum L.). Acta Agron. Sin., 34(12): 2 077-2 084.
DOI:10.1016/S1875-2780(09)60019-5 |
Yang H R, Liu L, Gong S Y, Zhao H H, Sun J J, Chen Y Z. 2013. Evaluation of genetic diversity by using mitochondrial DNA control region and cytochrome b gene for Squaliobarbus curriculus in Yangtze River and Pearl River. J. Huazhong Agric. Univ., 32(4): 84-91.
(in Chinese with English abstract) |
Yi Y J, Yang Z F, Zhang S H. 2010. Ecological influence of dam construction and river-lake connectivity on migration fish habitat in the Yangtze River basin, China. Proced.Environ. Sci., 2: 1 942-1 954.
DOI:10.1016/j.proenv.2010.10.207 |
Zalapa J E, Cuevas H, Zhu H Y, Steffan S, Senalik D, Zeldin E, McCown B, Harbut R, Simon P. 2012. Using Next-generation sequencing approaches to isolate simple sequence repeat (SSR) loci in the plant science. Am. J.Bot., 99(2): 193-208.
DOI:10.3732/ajb.1100394 |
Zhang C F, Tong C, Tian F, Zhao K. 2017. Integrated mRNA and microRNA transcriptome analyses reveal regulation of thermal acclimation in Gymnocypris przewalskii:a case study in Tibetan schizothoracine fish. PLoS One, 12(10): e0186433.
DOI:10.1371/journal.pone.0186433 |
Zhang M, Li Y T, Yao B J, Sun M Y, Wang Z W, Zhao Y. 2013. Transcriptome sequencing and de novo analysis for Oviductus ranae of Rana chensinensis using Illumina RNA-Seq technology. J. Genet. Genomics, 40(3): 137-140.
DOI:10.1016/j.jgg.2013.01.004 |
Zhao Q Y, Wang Y, Kong Y M, Luo D, Li X, Hao P. 2011. Optimizing de novo transcriptome assembly from short-read RNA-Seq data:a comparative study. BMC Bioinformatics, 12(S14): S2.
DOI:10.1186/1471-2105-12-S14-S2 |