 2019, Vol. 37
Institute of Oceanology, Chinese Academy of Sciences
Article Information
- LIU Zenghong, CHEN Xingrong, YU Jiancheng, XU Dongfeng, SUN Chaohui
- Kuroshio intrusion into the South China Sea with an anticyclonic eddy: evidence from underwater glider observation
- Journal of Oceanology and Limnology, 37(5): 1469-1480
- http://dx.doi.org/10.1007/s00343-019-8290-y
Article History
- Received Oct. 13, 2018
- accepted in principle Nov. 30, 2018
- accepted for publication Jan. 17, 2019


2 National Marine Environmental Forecasting Center, Ministry of Natural Resources, Beijing 100081, China;
3 State Key Laboratory of Robotics, Shenyang Institute of Automation, Chinese Academy of Sciences, Shenyang 110016, China
The South China Sea (SCS), which is the largest semi-enclosed marginal sea in the North Pacific Ocean, is connected to the Pacific Ocean via the Luzon Strait. Although the general upper-ocean circulation of the SCS, which is driven mainly by monsoon winds, exhibits a basin-scale cyclonic gyre in winter, it splits into a weakened cyclonic gyre and a strong anticyclonic gyre north and south of 12°N, respectively, in summer (Hwang and Chen, 2000; Wang et al., 2003; Su, 2004). Surface water of the Kuroshio Current, characterized by high temperature and salinity, intrudes into the SCS through the Luzon Strait throughout the year (Shaw, 1991; Qu, 2000; Qu et al., 2004; Hsin, 2015), which affects both the circulation and the characteristics of the water within the SCS.
The SCS has high mesoscale eddy activity, which plays an important role in the transport of both heat and salt (Li et al., 1998; Wang et al., 2003; Yuan et al., 2007; Chen et al., 2011a; Nan et al., 2011; Zu et al., 2013). Previous studies using hydrographic and satellite altimeter data have reported observing an anticyclonic eddy in the northern SCS (NSCS) (Li et al., 1998; Jia and Liu, 2004; Yuan et al., 2007; Wang et al., 2008a). Following two conductivitytemperature-depth (CTD) surveys in 1992 and 1994, Li et al. (1998) suggested the eddy was probably shed from the Kuroshio loop current. Following analysis of satellite altimeter data, Yuan et al. (2007) argued the anticyclonic eddy was generated to the northwest of Luzon, rather than being shed from the Kuroshio. Jia and Liu (2004) statistically analyzed the occurrence of eddy shedding from the Kuroshio bend in the Luzon Strait based on satellite altimeter data and numerical model output, and they found that the Kuroshio bend varied temporally and that it shed anticyclonic eddies periodically. Based on 17 years' altimeter data, Chen et al. (2011a) also found that most anticyclonic eddies in the NSCS were generated to the northwest of Luzon, whereas most cyclonic eddies originated to the west of Luzon. The mechanisms of eddy formation in the NSCS have also been discussed in previous studies. Eddies shed from the Kuroshio loop current are caused by frontal instability of the Kuroshio intrusion flow (Metzger and Hurlburt, 2001; Jia et al., 2005; Yuan et al., 2006; Wang et al., 2008b; Chen et al., 2011b), while eddies that originate locally are caused primarily by enhanced wind stress curl (Yuan et al., 2007; Wang et al., 2008b). In addition, some eddies propagate directly from the western Pacific Ocean through the Luzon Strait as Rossby waves (Sheu et al., 2010; Zheng et al., 2011). Eddies in the NSCS often propagate southwestward along the continental slope with translation speed of 5.0–9.0 cm/s, and their interaction with ambient waters results in a considerable change in the thermohaline structure (Chen et al., 2011a; Nan et al., 2011).
Although many studies have presented evidence of the activities of anticyclonic eddies in the NSCS, most have been based on satellite retrievals and incidental observations from drifters, moorings, autonomous profilers, and shipboard surveys. Consequently, the lack of high-resolution observations from within anticyclonic eddies has limited our understanding of their vertical structure.
In this study, high-resolution observations from underwater gliders were used to elucidate the vertical characteristics of an anticyclonic eddy that originated to the southwest of Taiwan, China in February 2015. The remainder of this paper is organized as follows. Detailed descriptions of the data used and the methodology adopted in the study are presented in Section 2. Analysis of the results based on the glider observations and satellite altimeter data is offered in Section 3. In Sections 4 and 5, a discussion and the conclusions are presented.
2 DATA AND METHODOLOGY 2.1 Sea-Wing underwater glider dataThis study obtained high-resolution temperature and salinity (T/S) data using Sea-Wing underwater gliders. The Sea-Wing underwater glider is developed by the Shenyang Institute of Automation, Chinese Academy of Sciences (Yu et al., 2011). It is autonomous, buoyancy-driven, and equipped with a CTD sensor. Each sampling cycle usually includes a diving and climbing profile that takes approximately 4 h and reaches a maximum profiling depth of 1 000 m (Shu et al., 2016, 2019). At the sea surface, the SeaWing glider acquires GPS position fixes and communicates with a base station via the Iridium satellite system. The observation path of Sea-Wing underwater glider is pre-set for observation task. When the underwater glider is on the sea surface, it calculates the moving direction of the next gliding cycle by comparing the deviation between the current position and the expected path. The underwater glider controls its gliding direction through the tail rudder device during the gliding movement and then realizes the tracking control of the observation path. During 4 April–1 June 2015, three Sea-Wing underwater gliders were deployed to the southwest of Taiwan, China in the NSCS (at around 21.35°N, 118.45°E) (Fig. 1). One glider (No. 1000J003) was deployed on 28 April and it completed 205 cycles by 1 June, which resulted in 410 high-resolution CTD profiles. Glider No. 1000J005 collected 276 profiles from 18 April–7 May. Glider No. 1000J006 was deployed at the same time and location as glider No. 1000J003, although it collected only 288 T/S profiles by 21 May.

|
| Fig.1 Sea level anomaly (SLA, unit: cm) distribution (color shading) in the northern South China Sea (NSCS) on 28 February 2015 Contours denote 200, 500, 1 000, 2 000, and 3 000 m isobaths. Solid lines indicate the three glider paths (colored crosses indicate launch positions of each glider). Argo data (gray dots) in the two dashed boxes were selected to produce climatological T/S relationship of the NSCS and the Kuroshio waters. |
The Archiving, Validation, and Interpretation of Satellite Oceanographic, multiple satellite-merged Sea Level Anomaly (SLA) data (http://www.aviso.oceanobs.com) were used to identify and track eddies in the SCS. The product merges observations from several satellite altimeters to obtain a product with 1/4°×1/4° spatial resolution and 1-d temporal resolution. The SLA is determined relative to the 20- year mean from January 1993–December 2012. The geostrophic currents are calculated from the absolute dynamic topography, which consists of the mean dynamic topography and the anomalies of the altimeter-derived sea level.
2.3 Argo dataArgo profile data were used to demonstrate a climatological T/S view of the NSCS and the northwestern Pacific Ocean. The global Argo program was initiated in 1998 and implemented from 2000 to collect T/S profiles over the global oceans (Riser et al., 2016). In the SCS, the first Argo deployment was in 2006. Overall, 1596 T/S profiles in the region 18.0°–21.5°N, 114°–120°E and 151 profiles in the region 18.0°–21.5°N, 121°–123°E, obtained from January 2006–June 2015, were selected to produce the T/S climatology of the NSCS and northwestern Pacific Ocean, respectively (Fig. 1). All Argo profiles are post-quality controlled by the China Argo Realtime Data Center (http://www.argo.org.cn/) before being made available to users.
2.4 Processing and quality control of glider dataCurrently, a Sea-Wing underwater glider applies a discrete CTD sampling scheme (sampling resolution: ~6 s) in both diving and climbing profiles. The salinity measurements often exhibit many hooks below the halocline, which probably reflect the sampling scheme (Fig. 2). To reduce the influence of these salinity hooks, bin-average smoothing was applied to all the T/S measurements. It can be seen from Fig. 2 that the smoothing removed the hooks while retaining the salinity characteristics of the entire water column. Similar to Argo profiling float data, only the climbing profiles from the gliders were utilized in our analysis. Another reason for using only the ascending part of the cycle is that the ascent velocity of a glider usually varies less with depth than the descent velocity, which results in better vertical resolution of a climbing profile, especially at shallow depths. Salinities observed from a diving profile are larger than that from its sequent climbing profile in most cases, especially around the subsurface salinity maximum. The reason is not so clear but could be related to the mismatch between the temperature probe and conductivity cell response time (called "thermal lag effect", Morison et al., 1994) or relatively high variability of the seawater observed by the glider even if the distance between two sequent diving is approximately 3–5 km.

|
| Fig.2 Typical salinity versus pressure (dbar) curves observed by sea-wing underwater glider in the northern South China Sea a. raw data; b. bin-averaged data. |
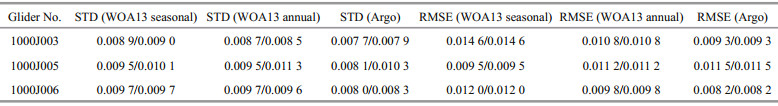
To verify the data quality, each T/S profile was compared against the WOA13 climatology and the historical nearby Argo dataset. The outliers and obviously erroneous profiles were removed. Consequently, 481 climbing T/S profiles collected by the three Sea-Wing underwater gliders were considered suitable for use in this study. Table 1 shows the standard deviations and root mean square errors of all the salinities at 900 m observed by the three gliders against the WOA13 climatology and the historical Argo profiles. It is clear that salinities at intermediate depth obtained from either diving profile or climbing profile are in good agreement with the WOA13 climatology and historical Argo, with the standard deviation of salinity difference about 0.008– 0.011, which almost equals the Argo's target salinity accuracy of 0.01 (Riser et al., 2016).
|
To remove high-frequency signals (e.g., internal waves and tides) and noise, a locally weighted quadratic regression, known as a loess filter (Cleveland and Devlin, 1988), was employed to produce maps of the vertical thermohaline structure.
3 RESULT 3.1 Evolution of the anticyclonic eddyFigure 3 shows the time evolutions of the SLA and sea surface geostrophic velocity during February–May 2015. When glider 1000J005 was deployed on 18 April at 21.22°N, 118.44°E, there was an anticyclonic eddy just west of the deployment, with a diameter of about 178 km and mean surface geostrophic velocity of ~0.24 m/s (Fig. 3d). This anticyclonic eddy originated off the southwest of Taiwan, China at the end of February 2015, where a loop current formed following the strengthening of the Kuroshio intrusion (Shu et al., 2016). The Kuroshio intrusion had weakened and the loop current had disappeared by 25 March, which led to the shedding of the anticyclonic eddy from the Kuroshio (Fig. 3c). The eddy then moved southwestward and it reached a position around 21.125°N, 117.875°E on 18 April. After 18 April, the anticyclonic eddy expanded and its diameter increased to 213 km by 28 April when gliders 1000J003 and 1000J006 were deployed. The eddy continued to travel southwestward, and its intensity and diameter both increased gradually. Its diameter was about 434 km on 1 June when the mission of glider 1000J003 was ended and the instrument was recovered.

|
| Fig.3 Time evolutions of the sea level anomaly (cm) and corresponding geostrophic current (m/s) from 28 February–31 May 2015 Glider paths are represented by colored lines (green: 1000J005; yellow: 1000J006; thick blue: 1000J003). AE represents anticyclonic eddy. |
Glider 1000J005 was deployed at the eastern periphery of the anticyclonic eddy on 18 April, and it traveled 685 km until 7 May. Its path differed from the other two gliders (Fig. 1), and it did not enter the core of the eddy during the entire deployment. Figure 4 shows the vertical section of temperature and salinity obtained by glider 1000J005. The monthly climatology (1980–2010) derived from the UK Met Office Hadley Centre EN4.2.1 objective analyses (Good et al., 2013) were used to remove the seasonal signal from the glider observations. A negative temperature anomaly is clearly visible below the mixed layer during 21–28 April with a maximum value exceeding 4℃ at around 60 dbar. Both the thermohaline and the density distributions indicate upwelling below the thermocline during this period attributable to cyclonic eddies east of the anticyclonic eddy, meanwhile, the impact of the eddy could reach to as deep as 500 dbar. The upwelling and the uplift of the isopycnal were invisible when the glider moved out of the cyclonic eddy after 28 April (Fig. 3e).
Around 18 April, when glider 1000J005 was deployed, a small area of higher salinity water (>34.7) was found at depths of 115–175 dbar (Fig. 4b). This higher salinity water could not be found along the glider path after 19 April, i.e., this higher salinity water was observed only by glider 1000J005 at the eastern periphery of the anticyclonic eddy (Fig. 3d).

|
| Fig.4 Sections of loess-filtered temperature (°C) (a), and salinity (b) observed by glider 1000J005 Color shading indicates anomaly from the EN4 climatology. Blue contours represent temperature and salinity, respectively, and black solid contours in (b) indicate potential density (kg/m3). |
Glider 1000J003 was deployed in a cyclonic eddy on 28 April and it entered the anticyclonic eddy from 12 May. It traveled 804 km between 28 April and 1 June. It can be seen in Fig. 5a that two extreme temperature anomalies were observed below the mixed layer. One was a negative temperature anomaly (in comparison with EN4.2.1 climatology) of as much as 4.2℃, which was observed during 28 April–13 May when the glider was located in a cyclonic eddy to the east of the anticyclonic eddy. The other was a positive temperature anomaly observed during 14–22 May with a maximum value of about 3.9℃ at the depth of ~100 dbar. This positive temperature anomaly spanned about 200 km. Below the mixed layer, the temperature contours indicate upwelling in the cyclonic eddy and downwelling in the anticyclonic eddy, and the impacts of these eddies could reach to the depth of at least 500 dbar. The vertical structure of the anticyclonic eddy is reflected well by its density contours, i.e., the isopycnal in the mixed layer exhibits a convex upward shape, whereas that below the top of the thermocline shows a concave downward shape (Fig. 5b). Within the anticyclonic eddy, the thermocline was less stratified below the mixed layer than that in the cyclonic eddy. A significant positive salinity anomaly was found in the anticyclonic eddy above 200 dbar, with a maximum anomaly of 0.58 in the mixed layer (Fig. 5b). This maximum salinity anomaly was larger than that reported by Shu et al. (2016) in the same eddy (>0.3), which was probably due to the usage of a monthly climatology rather than a mean value along the glider path while calculating salinity anomaly. In other words, the salinity anomaly given by this study may have included a long-term variation signal modulated by El Niño-Southern Oscillation and Pacific Decadal Oscillation (PDO) (Tsui and Wu, 2012; Nan et al., 2013, 2015; Shu et al., 2018). An anticyclonic eddy is usually associated with a thicker mixed layer, which could constrain the vertical mixing in the upper layer. Thus, the remarkable positive salinity anomaly was not induced by entrainment of higher salinity water from the subsurface into the mixed layer, but instead probably persisted within the anticyclonic eddy that originated from the Kuroshio intrusion. The higher salinity water (>34.7) was observed at depths of 50–175 dbar, which was rarely observed outside this anticyclonic eddy, except at the depths of 50–100 dbar during 28 April–2 May when glider 1000J003 was located in a cyclonic eddy (Fig. 5b).

|
| Fig.5 Same as Fig. 4 except for glider 1000J003 |
To verify that the higher salinity water found in the anticyclonic eddy did not originate within the NSCS, T/S diagrams were plotted using historical Argo data from within the two boxes shown in Fig. 1 and profile data obtained by glider 1000J003 during 28 April–13 May, 14–22 May, and 23 May–1 June (Fig. 6). Obviously, salinities in the upper layer (potential density:<25 σθ) observed by glider 1000J003 are all higher than the climatology derived from the Argo floats in the NSCS, whereas they are smaller than the Argo salinities in the area to the east of the Luzon Strait. The high salinity anomaly relative to the NSCS climatology is more significant in the anticyclonic eddy (14–22 May), indicating the higher salinity water did not originate within the NSCS but instead was brought from the Kuroshio loop current by the anticyclonic eddy. It is worth noting that the SCS experienced significant salinification of the nearsurface waters from late 2012 to 2017 (Zeng et al., 2018), which could explain why the salinities observed outside the anticyclonic eddy are also larger than the Argo NSCS climatology. Two Argo floats (WMO numbers: 5902165 and 5904563) were occasionally operating near the path of glider 1000J003 but outside the anticyclonic eddy (Fig. 7a). It is clear from Fig. 7b that the T/S relationship observed by the glider on 18 May, when it was operating within the anticyclonic eddy, is quite different from that of the Argo floats and the glider observations outside the eddy. The salinities of glider 1000J003 on 18 May were found much higher from the sea surface to the 24.5 σθ isopycnal. In other words, the high salinity water from the Kuroshio intrusion was well preserved by association with the moving anticyclonic eddy. On 14 June, when the anticyclonic eddy moved to around 18.9°N, 115.4°E, a CTD cast was conducted in this eddy (Fig. 7a). The CTD salinity shows a freshening trend above the 24.5 σθ isopycnal compared with that of the glider on 18 May (Fig. 7b). However, the CTD salinities are still higher than found in the surrounding water, which might provide further evidence that the high salinity water found within the anticyclonic eddy was not of local origin but derived from the Kuroshio intrusion.

|
| Fig.6 Mean T/S curves for the western Pacific Ocean (black) and northern South China Sea (NSCS; gray) derived from Argo data, and mean T/S curves observed by glider 1000J003 during 28 April–13 May (blue), 14–22 May (magenta), and 23 May–1 June (green) |

|
| Fig.7 Path of glider 1000J003, the position of shipboard conductivity-temperature-depth (CTD) cast (pink triangle) on 14 June, and positions of Argo profiles from two floats (black and gray circles) during 16 April–18 May (a); mean T/S curves derived from glider 1000J003, shipboard CTD, and two Argo floats; various colors in the path of the glider indicate different positions during the selected dates (b) Color shading in (a) indicates sea level anomaly (SLA, unit: cm) on 14 June 2015 when the CTD cast was conducted. |
Although glider 1000J006 was deployed on the same day and had a similar path as glider 1000J003, it moved much slower and it traveled only 481 km before its mission ended on 21 May at 19.4°N, 116.3°E. In other words, unlike glider 1000J003 that traversed the entire eddy, glider 1000J006 observed only a portion of the anticyclonic eddy (Fig. 3d). It also observed a negative temperature anomaly from the mixed layer to at least 500 dbar before 18 May when it was located within a cyclonic eddy (Fig. 8a). The isopycnal distribution within this cyclonic eddy indicates a reversal of the shape found in the anticyclonic eddy observed by glider 1000J003 (Fig. 8b). However, glider 1000J006 only observed a portion of the warm anomaly after it entered the anticyclonic eddy on 18 May. The positive salinity anomaly found by glider 1000J003 was also observed either in the cyclonic eddy or in the anticyclonic eddy (Fig. 8b). The high salinity water (>34.7) was found only in the cyclonic eddy, probably because glider 1000J006 did not cross the entire anticyclonic eddy during its mission. In Fig. 9, the averaged T/S observations from the three gliders on a centered position (19.426°N, 116.29°E) were selected where glider 1000J006 ended its mission and the other two gliders passed its ambient waters on different dates. The higher salinity water above the 24.5 σθ isopycnal was observed by glider 1000J003 and 1000J006 on 16–18 May and 20–21 May, respectively when they were located within the anticyclonic eddy. While glider 1000J005 did not observe this higher salinity water on 1 May when the anticyclonic eddy was still located to the north this centered position, therefore, the higher salinity signal at this place was brought from the anticyclonic eddy.

|
| Fig.8 Same as Fig. 4 except for glider 1000J006 |

|
| Fig.9 Mean T/S curves derived from the three gliders centered at 19.426°N and 116.290°E where gliders 1000J003 (16–18 May) and 1000J006 (20–21 May) were within the anticyclonic eddy, whereas glider 1000J005 (1 May) was outside of the eddy The thick black and thin gray curves indicate the mean T/S relationship derived from the Argo in the western Pacific Ocean and the northern South China Sea, respectively. |
Salinity is usually used to trace ocean water masses. It has been reported that decadal freshening has occurred within the NSCS or even the entire SCS from the 1990s to the 2000s (Nan et al., 2013, 2016; Zeng et al., 2016), which is considered closely related to the weakening of the Kuroshio intrusion. Recently, Zeng et al. (2018) reported a trend of salinification in the upper layer of the SCS from late 2012 when the phase of the PDO switched from negative to positive. They also reported widening and strengthening of the intrusion of Kuroshio water into the SCS in 2015 in comparison with 2012. Therefore, the positive salinity anomalies observed by the gliders in this study might be partly ascribable to this trend of salinification either inside or outside the anticyclonic eddy. However, we believe the positive signal in the anticyclonic eddy is attributable to Kuroshio water that has traveled with the eddy.
Shu et al. (2016) have reported the same anticyclonic eddy shedding from the Kuroshio based on the observations from glider 1000J003. Our analysis could serve as a further investigation of their results. The concurrent observations from the other gliders, shipboard CTD and Argo profiling floats were also adopted to verify our finding. The T/S anomaly from the glider was calculated by subtracting a monthly climatology rather than subtracting the average values along the glider path, which allowed us to obtain a long-term salinification signal in the upper layer of the SCS that have been revealed by Zeng et al. (2018).
It is worth noting that a glider may observe quite different sea water temperature and salinity during its diving and sequent climbing profiles when it enters a region with high variable water property even if it moves a not so far distance between two sequent cycles. As a result, it could be not suitable to make use of both diving and climbing profiles while analyzing the vertical thermohaline structure along a glider path. Furthermore, careful screening and comparison with climatology or high quality historical hydrographic dataset (e.g. GO-SHIP and Argo) are also necessary. It is recommended that an Argo equivalent salinity target accuracy of 0.01 should be applied to those underwater gliders who are operating in open oceans.
5 CONCLUSIONBased on high-resolution T/S profiles observed by three Sea-Wing gliders in the NSCS, the temperature and salinity variations within an anticyclonic eddy and in the ambient water were investigated. The anticyclonic eddy originated in the Kuroshio loop current southwest of Taiwan, China in February 2015, following which it traveled southwestward. The three gliders were deployed at the eastern periphery of the anticyclonic eddy or within a nearby cyclonic eddy. Glider 1000J003 observed a vertical T/S section across the anticyclonic eddy over a 9-d period, which provided details of the vertical structure of the eddy. In the anticyclonic eddy, downwelling from the base of the mixed layer to at least 500 m was evident from the temperature distribution. An area of high salinity water (>34.7) was found between 50 and 175 dbar, while a positive salinity anomaly relative to the local climatology (EN4.2.1) occupied the entire water column above 200 dbar with the maximum anomaly located within the mixed layer. An anticyclonic eddy is usually favorable for the preservation of water properties because of constrained vertical mixing; thus, this positive anomaly within the anticyclonic eddy probably originated from the Kuroshio intrusion via a loop current. Comparison of T/S diagrams based on historical Argo profiles, shipboard CTD cast, and in situ glider observations verified our findings. Unfortunately, gliders 1000J005 and 1000J006 either missed capturing or captured just a portion of the anticyclonic eddy.
6 DATA AVAILABILITY STATEMENTThis work benefited from numerous feely available datasets. The Sea-Wing underwater glider data were provided by the State Key Laboratory of Robotics, Shenyang Institute of Automation, Chinese Academy of Sciences; The Argo data were collected and made freely available by the International Argo Program and the national programs that contribute to it (http://www.argo.ucsd.edu, http://argo.jcommops.org). The Argo Program is part of the Global Ocean Observing System (http://doi.org/10.17882/42182). All the Argo T/S profiles have been post-quality controlled by the China Argo Real-time Data Center (http://www.argo.org.cn); The EN4.2.1 monthly datasets, produced by the UK Met Office Hadley Centre for Climate Change, are freely available at https://www.metoffice.gov.uk/hadobs/en4/; The shipboard CTD cast data used in our analysis are obtained by the R/V Nan Feng Hao on 14 June 2015.
Chen G X, Hou Y J, Chu X Q. 2011a. Mesoscale eddies in the South China Sea:mean properties, spatiotemporal variability, and impact on thermohaline structure. Journal of Geophysical Research, 116(C6): C06018.
DOI:10.1029/2010JC006716 |
Chen G X, Hu P, Hou Y J, Chu X Q. 2011b. Intrusion of the Kuroshio into the South China Sea, in September 2008. Journal of Oceanography, 67(4): 439-448.
DOI:10.1007/s10872-011-0047-y |
Cleveland W S, Devlin S J. 1988. Locally weighted regression:an approach to regression analysis by local fitting. Journal of the American Statistical Association, 83(403): 596-610.
DOI:10.1080/01621459.1988.10478639 |
Good S A, Martin M J, Rayner N A. 2013. EN4:quality controlled ocean temperature and salinity profiles and monthly objective analyses with uncertainty estimates. Journal of Geophysical Research, 118(12): 6 704-6 716.
DOI:10.1002/2013JC009067 |
Hsin Y C. 2015. Multidecadal variations of the surface Kuroshio between 1950s and 2000s and its impacts on surrounding waters. Journal of Geophysical Research, 120(3): 1 792-1 808.
DOI:10.1002/2014JC010582 |
Hwang C, Chen S A. 2000. Circulations and eddies over the South China Sea derived from TOPEX/Poseidon altimetry. Journal of Geophysical Research, 105(C10): 23 943-23 965.
DOI:10.1029/2000JC900092 |
Jia Y L, Liu Q Y, Liu W. 2005. Primary study of the mechanism of eddy shedding from the Kuroshio bend in Luzon Strait. Journal of Oceanography, 61(6): 1 017-1 027.
DOI:10.1007/s10872-006-0018-x |
Jia Y L, Liu Q Y. 2004. Eddy shedding from the Kuroshio bend at Luzon Strait. Journal of Oceanography, 60(6): 1 063-1 069.
DOI:10.1007/s10872-005-0014-6 |
Li L, Nowlin Jr W D, Su J L. 1998. Anticyclonic rings from the Kuroshio in the South China Sea. Deep Sea Research Part I:Oceanographic Research Papers, 45(9): 1 469-1 482.
DOI:10.1016/S0967-0637(98)00026-0 |
Metzger E J, Hurlburt H E. 2001. The nondeterministic nature of Kuroshio penetration and eddy shedding in the South China Sea. Journal of Physical Oceanography, 31(7): 1 712-1 732.
DOI:10.1175/1520-0485(2001)031<1712:TNNOKP>2.0.CO;2 |
Morison J, Andersen R, Larson N, D'Asaro E, Boyd T. 1994. The correction for thermal-lag effects in sea-bird CTD data. Journal of Atmospheric and Oceanic Technology, 11(4): 1 151-1 164.
DOI:10.1175/1520-0426(1994)011<1151:tcftle>2.0.co;2 |
Nan F, He Z G, Zhou H, Wang D X. 2011. Three long-lived anticyclonic eddies in the northern South China Sea. Journal of Geophysical Research, 116(C5): C05002.
DOI:10.1029/2010JC006790 |
Nan F, Xue H J, Chai F, Wang D X, Yu F, Shi M C, Guo P F, Xiu P. 2013. Weakening of the Kuroshio intrusion into the South China Sea over the past two decades. Journal of Climate, 26(20): 8 097-8 110.
DOI:10.1175/JCLI-D-12-00315.1 |
Nan F, Xue H J, Yu F. 2015. Kuroshio intrusion into the South China Sea:a review. Progress in Oceanography, 137: 314-333.
DOI:10.1016/j.pocean.2014.05.012 |
Nan F, Yu F, Xue H J, Zeng L L, Wang D X, Yang S L, Nguyen K C. 2016. Freshening of the upper ocean in the South China Sea since the early 1990s. Deep Sea Research Part I:Oceanographic Research Papers, 118: 20-29.
DOI:10.1016/j.dsr.2016.10.010 |
Qu T D, Kim Y Y, Yaremchuk M, Tozuka T, Ishida A, Yamagata T. 2004. Can Luzon Strait transport play a role in conveying the impact of ENSO to the South China Sea?. Journal of Climate, 17(18): 3 644-3 657.
DOI:10.1175/1520-0442(2004)017<3644:CLSTPA>2.0.CO;2 |
Qu T D. 2000. Upper-layer circulation in the South China Sea. Journal of Physical Oceanography, 30(6): 1 450-1 460.
DOI:10.1175/1520-0485(2000)030<1450:ULCITS>2.0.CO;2 |
Riser S C, Freeland H J, Roemmich D, Wijffels S, Troisi A, Belbéoch M Gilbert D, Xu J P, Pouliquen S, Thresher A, Le Traon P Y, Maze G, Klein B, Ravichandran M, Grant F, Poulain P M, Suga T, Lim B, Sterl A, Sutton P, Mork K A, Vélez-Belchí P J, Ansorge I, King B, Turton J, Baringer M, Jayne S R. 2016. Fifteen years of ocean observations with the global Argo array. Nature Climate Change, 6(2): 145-153.
DOI:10.1038/nclimate2872 |
Shaw P T. 1991. The seasonal variation of the intrusion of the Philippine Sea water into the South China Sea. Journal of Geophysical Research, 96(C1): 821-827.
DOI:10.1029/90JC02367 |
Sheu W J, Wu C R, Oey L Y. 2010. Blocking and westward passage of eddies in the Luzon Strait. Deep Sea Research Part Ⅱ:Topical Studies in Oceanography, 57(19-20): 1 783-1 791.
DOI:10.1016/j.dsr2.2010.04.004 |
Shu Y Q, Chen J, Li S, Wang Q, Yu J C, Wang D X. 2019. Field-observation for an anticyclonic mesoscale eddy consisted of twelve gliders and sixty-two expendable probes in the northern South China Sea during summer 2017. Science China Earth Sciences, 62(2): 451-458.
DOI:10.1007/s11430-018-9239-0 |
Shu Y Q, Wang Q, Zu T T. 2018. Progress on shelf and slope circulation in the northern South China Sea. Science China Earth Sciences, 61(5): 560-571.
DOI:10.1007/s11430-017-9152-y |
Shu Y Q, Xiu P, Xue H J, Yao J L, Yu J C. 2016. Gliderobserved anticyclonic eddy in northern South China Sea. Aquatic Ecosystem Health & Management, 19(3): 233-241.
DOI:10.1080/14634988.2016.1208028 |
Su J L. 2004. Overview of the South China Sea circulation and its influence on the coastal physical oceanography outside the Pearl River Estuary. Continental Shelf Research, 24(16): 1 745-1 760.
DOI:10.1016/j.csr.2004.06.005 |
Tsui I F, Wu C R. 2012. Variability analysis of Kuroshio intrusion through Luzon Strait using growing hierarchical self-organizing map. Ocean Dynamics, 62(8): 1 187-1 194.
DOI:10.1007/s10236-012-0558-0 |
Wang D X, Xu H Z, Lin J, Hu J Y. 2008a. Anticyclonic eddies in the northeastern South China Sea during winter 2003/2004. Journal of Oceanography, 64(6): 925-935.
DOI:10.1007/s10872-008-0076-3 |
Wang G H, Chen D K, Su J L. 2008b. Winter eddy genesis in the eastern South China Sea due to orographic wind jets. Journal of Physical Oceanography, 38(3): 726-732.
DOI:10.1175/2007JPO3868.1 |
Wang G H, Su J L, Chu P C. 2003. Mesoscale eddies in the South China Sea observed with altimeter data. Geophysical Research Letters, 30(21): 2 121.
DOI:10.1029/2003GL018532 |
Yu J C, Zhang A Q, Jin W M, Chen Q, Tian Y, Liu C J. 2011. Development and experiments of the Sea-Wing underwater glider. China Ocean Engineering, 25(4): 721-736.
DOI:10.1007/s13344-011-0058-x |
Yuan D L, Han W Q, Hu D X. 2006. Surface Kuroshio path in the Luzon Strait area derived from satellite remote sensing data. Journal of Geophysical Research, 111(C11): C11007.
DOI:10.1029/2005JC003412 |
Yuan D L, Han W Q, Hu D X. 2007. Anti-cyclonic eddies northwest of Luzon in summer-fall observed by satellite altimeters. Geophysical Research Letters, 34(13): L13610.
DOI:10.1029/2007GL029401 |
Zeng L L, Chassignet E P, Schmitt R W, Xu X B, Wang D X. 2018. Salinification in the South China Sea since late 2012:a reversal of the freshening since the 1990s. Geophysical Research Letters, 45(6): 2 744-2 751.
DOI:10.1002/2017GL076574 |
Zeng L L, Wang D X, Xiu P, Shu Y Q, Wang Q, Chen J. 2016. Decadal variation and trends in subsurface salinity from 1960 to 2012 in the northern South China Sea. Geophysical Research Letters, 43(23): 12 181-12 189.
DOI:10.1002/2016GL071439 |
Zheng Q A, Tai C K, Hu J Y, Lin H Y, Zhang R H, Su F C, Yang X F. 2011. Satellite altimeter observations of nonlinear Rossby eddy-Kuroshio interaction at the Luzon Strait. Journal of Oceanography, 67(4): 365-376.
DOI:10.1007/s10872-011-0035-2 |
Zu T T, Wang D X, Yan C X, Belkin I, Zhuang W, Chen J. 2013. Evolution of an anticyclonic eddy southwest of Taiwan. Ocean Dynamics, 63(5): 519-531.
DOI:10.1007/s10236-013-0612-6 |