 2019, Vol. 37
Institute of Oceanology, Chinese Academy of Sciences
Article Information
- LIN Wenqiang, ZHAI Fangguo, GU Yanzhen, LI Peiliang
- Decadal variations of the North Pacific Tropical Water at 137°E
- Journal of Oceanology and Limnology, 37(5): 1495-1509
- http://dx.doi.org/10.1007/s00343-019-8123-z
Article History
- Received Apr. 29, 2018
- accepted in principle Jun. 22, 2018
- accepted for publication Nov. 27, 2018


2 Institute of Physical Oceanography and Remote Sensing, Ocean College, Zhejiang University, Zhoushan 316021, China
The seawater potential temperature and salinity are the most important two fundamental parameters in physical oceanography. The salinity variations near the sea surface are mainly forced by the air-sea interactions, particularly the surface freshwater flux, and horizontal advection by ocean currents (e.g., Vinayachandran and Nanjundiah, 2009; Katsura et al., 2013; Li et al., 2013). Below the sea surface, the salinity variations are controlled by various physical processes in the ocean interior, such as ocean mixing, current advection, and so on. Therefore, the lowfrequency variations of the salinity reflect those in the regional or global climate, hydrological cycle, and ocean circulation (e.g., Wong et al., 1999; Curry et al., 2003; Boyer et al., 2005; Li et al., 2012). On the other hand, the variations of the seawater salinity may greatly influence those of the seawater density and thus the ocean circulation and climate. Therefore, the tempo-spatial variations on different temporal and spatial scales of the sea water salinity and associated dynamics have been extensively investigated based on in-situ observations and numerical modeling (e.g., Wong et al., 1999; Suga et al., 2000; Lukas, 2001; Bingham et al., 2002; Boyer et al., 2005; Delcroix et al., 2005; Ren and Riser, 2010; Yan et al., 2013; Nakano et al., 2015).
In the central North Pacific Ocean around the Tropic of Cancer, there is a salinity maximum in the surface layer due to extremely excess evaporation over precipitation (Fig. 1; e.g., Cannon, 1966; Tsuchiya, 1968). After subducting into the subsurface layer, this surface high salinity water forms the North Pacific Tropical Water (NPTW; Cannon, 1996; Qu et al., 1999; Suga et al., 2000), which is characterized by a salinity maximum on potential density surfaces around σθ=24.0 kg/m3 and advected westward by the North Equatorial Current (NEC) in the western Pacific Ocean (e.g., Qu et al., 1999; Suga et al., 2000; Li and Wang, 2012; Nakano et al., 2015; Nie et al., 2016). After arriving at the western boundary of the North Pacific Ocean, the NPTW is split into two parts due to the bifurcation of the NEC off the Philippine coast (e.g., Qu et al., 1999; Qu and Lukas, 2003; Li and Wang, 2012). One part is carried northward by the Kuroshio Current (KC) and subsequently circulates in the subtropical and subpolar gyres, while the other part is advected southward by the Mindanao Current (MC) and then enters the tropical gyre (e.g., Qu et al., 1998, 1999; Suga et al., 2000; Li and Wang, 2012). Via advection by the large-scale ocean circulation, the NPTW is a major source of salt in the North Pacific Ocean (e.g., Suga et al., 2000; Bingham et al., 2002). Therefore, it contributes much to the low-frequency variations of the ocean circulation and climate in the North Pacific Ocean and even the globe. Meanwhile, its variations also carry useful information whereby changes in the ocean circulation and climate can be detected and understood (e.g., Curry et al., 2003; Katsura et al., 2013).

|
| Fig.1 Climatological map of the mean mixed layer salinity (MLS) in the North Pacific Ocean derived from the EN4 data The contour interval is 0.1, the black dashed line denotes the 137°E meridian and the thick rectangle indicates the NPTW western formation region (20°–30°N; 152°E–172°W; Suga et al., 2000; Katsura et al., 2013). |
Using repeated hydrographic observations along meridians in the western tropical North Pacific Ocean, Suga et al. (2000) confirmed the origination of the NPTW, which is believed to be the zone with the highest sea surface salinity at 20°–30°N around the International Date Line. They further indicated that the NPTW north and south of about 15°N in the western Pacific Ocean is formed west and east of the International Date Line, respectively. However, Katsura et al. (2013) proved that the NPTW formed at the eastern formation site was dissipated quickly after subduction, and only that formed at the western formation site was advected westward by NEC.
In the literature, the temporal variations of the NPTW on multiple time scales in the western tropical Pacific Ocean, especially at 137°E, have been investigated by several authors. Based on repeated hydrographic observations along 137°E obtained by the Japan Meteorological Agency (JMA), Shuto (1996) examined interannual variations of the NPTW at 137°E for the period of 1967 to 1987. He pointed out that the interannual variations of the area of the NPTW at 137°E are highly correlated with those of the sea surface wind forcing southeast of Japan with a time lag of 0–2 years. The underlying mechanism is speculated to involve regional circulation anomalies induced by the sea surface wind forcing southeast of Japan. On the other hand, by analyzing the gridded Argo-profiling float data and various surface flux data, Katsura et al. (2013) suggested that the interannual NPTW variation in the western subtropical North Pacific Ocean should be related to the Pacific Decadal Oscillation (PDO; e.g., Mantua et al., 1997), which is at work via affecting the sea surface flux and eddy activities that control the seawater salinity in the formation region of NPTW.
The PDO related salinity anomalies over the entire northwestern Pacific subtropical gyre are subsequently confirmed by Nan et al. (2015). Using repeated observations along three sections in the western subtropical North Pacific Ocean and the East China Sea, Nan et al. (2015) noted that both the surface and subsurface salinity in the western subtropical North Pacific Ocean show significant quasi-decadal oscillation and a sustained freshening trend during 1987–2012. The surface salinity variations are controlled by the air-sea freshwater flux, which is closely related to the PDO (Nan et al., 2015). Nakano et al. (2015) further studied the decadal variation and long-term trend of the NPTW at 137°E using the repeated hydrographic observations. They argued that the decadal variation of the NPTW at 137°E results from the meridional excursion of its northern boundary, which is induced by the westward expansion of its formation region.
The above results imply that the decadal variations of the NPTW at 137°E are dominated by the PDO related sea surface forcing at its source region (e.g., Nakano et al., 2015; Nan et al., 2015). However, we should note that the hydrographic observations along 137°E adopted by Nan et al. (2015) only last from 1992 to 2012. On the other hand, there is no estimation of the respective contributions of various physical processes to decadal variations of the NPTW in the results of Nakano et al. (2015). Therefore, the characteristics of the decadal variations of the NPTW at 137°E in the western North Pacific Ocean remain to be studied in detail with long-term observations or other ocean products. Meanwhile, contributions of various processes shall be further quantified.
In this study, we would focus on the decadal variations of the NPTW at 137°E with the 50-year repeated hydrographic observations along the meridian in combination with other two globalgridded ocean products. We have two objectives. One objective is to reveal the spatial-temporal characteristics of the decadal NPTW variations. The other objective is to explore the underlying mechanisms. As shown by previous studies, the spreading of the NPTW in the subsurface layer in the western North Pacific Ocean is closely associated with the NEC-KC-MC current system (e.g., Qu et al., 1999; Li and Wang, 2012). On the decadal time scale, Zhai et al. (2013) indicated that at 137°E the salinity maximum of NPTW is highly correlated with the NEC transport with a linear correlation coefficient of about 0.87 above the 95% confidence level. As the decadal NEC transport variations are related to the cyclonic/anticyclonic gyre anomalies formed in the western North Pacific Ocean (e.g., Zhai et al., 2014), they speculated that the decadal salinity anomalies of NPTW are possibly generated locally by the anomalous advection induced by the gyre anomalies. Therefore, changes of the NPTW at 137°E due to local circulation anomalies and those at its source region are quantified in the present study. The data and method of analyses are described in Section 2, the results are presented in Section 3, and a brief summary is provided in Section 4.
2 DATA AND METHOD 2.1 DataIn the current study, we use the repeated hydrographic observations obtained by JMA along the 137°E meridian (e.g., Oka et al., 2018), which are downloaded from the JMA website (refers to Section 6). As part of the Cooperative Study of the Kuroshio, the hydrographic observations along the 137°E meridian were initiated in the winter of 1967 (e.g., Oka et al., 2018; references therein). In 1972, hydrographic observations were also conducted in the summer season. Since the early 1990s, the observations were obtained in the four seasons of the year. Before analysis, profiles of temperature and salinity are vertically interpolated into depth levels in interval of 10 dbar. Then the temperature and salinity of each cruise are meridionally linearly interpolated onto integer latitudes and smoothed with a Gaussian filter on a 150-km e-folding scale to remove the interference from transient processes, such as internal waves, eddies, and other small-scale motions (Qu et al., 1999; Zhai et al., 2013).
In addition, we use two global-gridded ocean products. The first one is the version 4 of the Met Office Hadley Centre "EN" series of data sets (EN4) (e.g., Good et al., 2013). In preparing the EN4, all available observed profiles of temperature and salinity are considered. The main data source for EN4 is the World Ocean Database (e.g., Boyer et al., 2009). Meanwhile, three other data compilations are included in preparing EN4. The first is the data compiled during the Arctic Synoptic Basin Wide Oceanography project, which were used with the aim of improving data coverage in the Arctic. The second is the data derived from the Global Temperature and Salinity Profile Program. The third is the Argo data for 2000 onward obtained from the Argo global data assembly centers. EN4 contains monthly objective analyses of quality controlled temperature and salinity of global ocean with a horizontal resolution of 1.0°×1.0° and 42 levels in the vertical. It spans from 1900 to the present. One can refer to Good et al. (2013) for more details of the observations and methods in preparing EN4. In the current study, the EN4 dataset within the period of 1950–2017 is analyzed.
The second ocean product is the European Center for Medium-Range Weather Forecasts (ECMWF) ocean analysis/reanalysis system 4 (ORAS4) (Balmaseda et al., 2013). It contains global monthly sea surface height (SSH), seawater temperature and salinity, and their zonal and meridional velocities. The ORAS4 used in this study has a regular 1° horizontal grid and spans a period of 60 years from January 1958 to December 2017. There are 42 vertical levels un-uniformly extending from 5 m to 5 350 m. For more details, one can refer to Balmaseda et al. (2013).
We shall note that the EN4 is a type of ocean objective analysis prepared with in-situ observations only (Good et al., 2013), while the ORAS4 is a type of ocean reanalysis produced by a global ocean data assimilation system (Balmaseda et al., 2013). Both may contain errors, especially in regions where insitu observations are sparse. However, these two datasets and their previous versions EN3 (Ingleby and Huddleston, 2007) and ORAS3 (Balmaseda et al., 2008) have been extensively used to study the lowfrequency variations of the regional and global circulation and climate (e.g., Zhai et al., 2013, 2014; Hu and Sprintall, 2016; Vergara et al., 2016; Guo et al., 2018). Therefore, we believe it would be helpful to use these two ocean products to study the dynamics responsible for the decadal variations of the NPTW at 137°E meridian. Furthermore, as the two ocean products are prepared by quite different methods, the similarities of the associated underlying mechanisms between them would make the results more credible.
2.2 Method 2.2.1 Extraction of decadal signalsTo focus on the decadal variations, the temperature and salinity obtained by JMA and correspondingly derived NEC transport at 137°E are firstly linearly interpolated to January (winter) and July (summer) during the years of interest. Then the total times series are low-pass filtered with a Lanczos filter to obtain signals with periods longer than 7 years (e.g., Zhai et al., 2013). For monthly variables in the two kinds of global gridded ocean products, monthly mean anomalies are obtained by subtracting the monthly climatology from the original monthly means. Then a low-pass Lanczos filter with a cutoff at 7 years is applied to the monthly mean anomalies. At last, the decadal anomaly can be obtained by subtracting the linear trend.
2.2.2 Calculation of geostrophic velocityIn the current study, the geostrophic velocities on isobaric surfaces are calculated for JMA observation and EN4 output. The geostrophic velocities on isobaric surfaces are calculated as
 (1a)
(1a) (1b)
(1b)where f is the Coriolis parameter, u and v are the zonal and meridional geostrophic velocities, respectively. Φa is the geopotential anomaly and defined as 
Along the 137°E meridian in the western North Pacific Ocean, there are two high salinity waters locating south of 5°N and north of 11°N, which correspond to the South Pacific Tropical Water (SPTW) and NPTW, respectively (Fig. 2a; e.g., Qu et al., 1999). Following previous studies (e.g., Shuto, 1996; Kaneko et al., 1998; Suga et al., 2000; Nakano et al., 2015), the NPTW in the current study is defined as the water mass with salinity larger than 34.9. The climatological mean NPTW basically spans from 11°N to 23.5°N in latitude, from 100 m to 200 m in depth and from σθ=23.0 kg/m3 to σθ=25.0 kg/m3 in vertical along 137°E (Fig. 2b). Its maximum salinity (Smax) is slightly larger than 35.0, generally appearing at 15.5°N, 150 m and on the σθ=23.8 kg/m3 isopycnal surface, consistent with previous studies (e.g., Suga et al., 2000). Both EN4 and ORAS4 show nearly the same results to the JMA observation (figure not shown).

|
| Fig.2 Climatological mean salinity distributions at 137°E from JMA observation a. depth-latitude section; b. potential density-latitude section. |
We then calculated the time series of the NPTW Smax and area along the 137°E meridian. The mean and standard deviation (STD) of the NPTW Smax are 35.05 and 0.067 in the JMA observation (Fig. 3a). The EN4 and ORAS4 both show similar results, which are 35.08 and 0.052 in EN4, and 35.14 and 0.053 in ORAS4, respectively. The simultaneous linear correlations of the JMA observation with EN4 and ORAS4 are about 0.81 and 0.64, respectively, both above the 95% confidence level. All the three ocean products indicate that the NPTW Smax exhibits significant quasi-decadal variations with a mean period of about 9 years (Nan et al., 2015). To clearly see that, the gray line in Fig. 3a shows the decadal NPTW Smax. During the period of interest, it shows the maxima around 1979, 1987, 1995, 2004, and 2012, and the minima around 1974, 1983, 1991, 1999, and 2008.

|
| Fig.3 Time series of the half-yearly observed NPTW Smax (blue line) (a) and NPTW area (blue line) (b) at 137°E obtained by JMA In (a) and (b), the blue and white points indicate values in winter and summer, respectively, and the gray lines indicate the decadal time series. |
On the other hand, the observed mean and STD of the NPTW area are 129.1 km2 and 61.8 km2, respectively. Similar to the Smax, the observed halfyearly NPTW area also shows remarkable quasidecadal variation (Fig. 3b). During the period of interest, it generally has maxima around 1980, 1995 2005 and 2012, while minima around 1974, 1991, 2000 and 2009. Suga et al. (2000) have carefully examined the abrupt change in the NPTW area in the late 1970s. In the early and middle 1970s, the NPTW area along 137°E is relatively small and even reaches zero in 1973. However, it drastically increases around 1977/1978. Suga et al. (2000) suggested that this abrupt increase in the NPTW area could be attributed to the mid-1970s regime shift of the North Pacific climate. As expected, the area of the NPTW shows high simultaneous linear correlation with its Smax. The correlation coefficients for half-yearly and decadal time series are about 0.62 and 0.68, respectively, both above the 95% confidence level. This indicates that the NPTW expands (shrinks) as its maximum salinity increases (decreases) at 137°E.
The NPTW area along the 137°E meridian calculated from the EN4 and ORAS4 agree reasonably well with the JMA observed one (figure not shown). The mean and STD of the NPTW area are 163.9 km2 and 62.2 km2 for EN4, and 160.9 km2 and 49.0 km2 for ORAS4, respectively. The simultaneous linear correlation coefficients of the observation with EN4 and ORAS4 are 0.71 and 0.62, respectively, both above the 95% confidence level.
To make the NPTW variations clearer, we calculated the composite salinity anomaly associated with the maxima and minima of decadal NPTW Smax (Fig. 4). First, the half-yearly observed salinity along the 137°E meridian is subtracted by the long term mean to get the salinity anomaly, which is a function of depth (z), latitude (y) and time (t) and would be denoted as S'(y, z, t). Note that the salinity anomalies S'(y, z, t) within one year around each of the decadal NPTW Smax maxima (minima) are averaged to obtain the associated composite salinity anomaly. As shown in Fig. 4a, when the decadal NPTW Smax is maximum, the composite pattern exhibits significantly positive salinity anomaly in potential density layers of NPTW, showing more details. The positive salinity anomaly has two maxima. The southern maximum of about 0.068 appears around 170 m, 13.5°N, about 2°N south of the climatological NPTW core, roughly consistent with the regressed salinity anomaly. On the other hand, the northern maximum of about 0.087 appears around 80 m, 21.5°N, about 6°N north of the climatological NPTW core. This may imply that the decadal NPTW Smax variation is mainly related to the southern salinity anomaly maximum. When the decadal NPTW Smax is minimum, the situation is reversed (Fig. 4b). The minimum negative salinity anomaly of about -0.102 appears around 120 m, 14°N, about 1.5°N south of the climatological NPTW core.

|
| Fig.4 Composite salinity anomaly associated with maxima of the NPTW Smax at 137°E (a); same as (a) but associated with minima of the NPTW Smax at 137°E (b) In all panels, the gray line indicates the climatological mean 34.9 isohaline line. |
In this part, we explore the possible mechanisms responsible for the decadal NPTW variation observed at 137°E in the northwestern tropical Pacific Ocean. As introduced in Section 1, the NPTW is advected westward by the NEC after subduction from its source region around the International Date Line. Therefore, the variations of the NPTW at 137°E in the northwestern tropical Pacific Ocean would be controlled by those of the large-scale circulation in the northwestern tropical Pacific Ocean and mixed layer salinity at its source region.
4.1 Circulation variationsWe would first examine the relationship between the decadal variations of the NPTW and NEC transport. As seen from Fig. 5a, the mean NEC is located between 7°N and 19°N at the sea surface and generally shifts northward with increasing depth (e.g., Qu and Lukas, 2003; Zhai et al., 2013). The NPTW is well located within the NEC region. Therefore, one can expect that variations of the NEC can largely affect those of the NPTW.

|
| Fig.5 The basic characteristics of the circulation at 137°E using the JMA observations a. climatological mean zonal geostrophic velocity (cm/s; color) and salinity (contour). The contour interval is 0.1 and the thick line indicates the 34.9 isohaline line; b. half-yearly (gray line) and decadal (black line) time series of the NEC transport. |
We then calculate the westward NEC volume transport through integrating the westward velocities vertically from the sea surface downward to σθ=26.7 kg/m3 isopycnal surface and meridionally from 7°N to 20°N (Fig. 5b; Zhai et al., 2013). The mean NEC transport during the observation period is about 48.9 Sv. The decadal NEC transport has maxima around 1981, 1995, and 2005, while minima around 1972, 1989, 2000, and 2010, respectively (Zhai et al., 2013). The interannual and decadal NEC transports are also calculated with EN4 and ORAS4. Both of them agree quite well with the JMA observation. The mean NEC transports in EN4 and ORAS4 are 47.7 Sv and 48.5 Sv, both comparable to the JMA observed mean transport. The simultaneous linear correlation coefficients of the observed decadal NEC transport with those derived from EN4 and ORAS4 are about 0.81 and 0.91, respectively, both of which are above the 95% confidence level. This strongly approves that the EN4 and ORAS4 reproduce quite well the observed NEC transport at 137°E.
We then compare variations of the NEC transport with those of the Smax and area of the NPTW at 137°E. As shown in Fig. 6, both the Smax and area of the NPTW are significantly positively correlated with the NEC transport. The half-yearly NEC transport shows simultaneous linear correlation coefficients of about 0.31 and 0.41 with the NPTW Smax and area, respectively. On the decadal timescale; however, the correlation coefficients are higher, which are about 0.53 and 0.85, respectively, both above the 95% confidence level. Decadal extrema of the NPTW Smax and area correspond very well to those of the NEC transport (Fig. 6b). We also note that there are very short time lags between maxima of the three variables. These may be reasonable considering the slow evolution of the circulation in the northwestern tropical Pacific Ocean on the decadal timescale. The good correlation strongly suggests that with the westward NEC transport strengthening/weakening, more/less NPTW would be carried westward.

|
| Fig.6 Time series of NPTW area (km2; blue line), Smax (black line) and NEC transport (Sv; orange line) at 137°E derived from JMA observation a. shows half-yearly time series; b. same as (a) but for decadal time series. |
With the help of ocean state estimates and ocean objective analyses, Zhai et al. (2013) demonstrated that the strengthening/weakening of the decadal NEC transport results from the cyclonic/anticyclonic gyre anomalies in the northwestern tropical Pacific Ocean. To understand how the circulation variations can affect the decadal NPTW variations at 137°E, we show in Fig. 7 the composite anomalies of the SSH and horizontal velocity associated with the decadal NEC transport maxima and minima, respectively (Fig. 5b). The composited circulation anomalies are the same as those derived by Zhai et al. (2013). During the maximum/minimum transport periods, there are cyclonic/anticyclonic gyre anomalies in the northwestern tropical Pacific Ocean. Then the westward/eastward velocity anomalies in the NEC region would transport more/less saline water westward across the 137°E meridian.

|
| Fig.7 Composite anomalies of the SSH (color; cm) and horizontal velocity (arrows; cm/s) averaged between σθ=23.5 kg/m3 and σθ=24.5 kg/m3 isopycnal surfaces associated with the decadal NEC transport (left) maxima and (right) minima: EN4 (a and b), ORAS4 (c and d) In each panel, the black dashed line denotes the 137°E meridian and the gray contours are the climatological mean salinity averaged between σθ=23.5 kg/m3 and σθ=24.5 kg/m3 isopycnal surfaces. Thick rectangles indicate the NPTW formation region. |
Besides the effect of the circulation changes in the northwestern tropical Pacific Ocean, we also investigate the possible influence of the MLS changes at the source region around the International Date Line on the decadal NPTW salinity variations at 137°E (e.g., Nan et al., 2015; Nakano et al., 2015). For that purpose, we calculate the time series of the area-averaged MLS maximum (MLSmax) in the source region of NPTW with EN4 and ORAS4. According to Suga et al. (2000) and Katsura et al. (2013), the NPTW source region is defined as the area of high salinity >35.0 around the western salinity maximum in the climatological map of the MLS in the North Pacific Ocean. The source regions in EN4 and ORAS4 are 20°–30°N, 152°E–172°W and 20°–30°N; 151°E– 178°W, respectively (Fig. 7) both similar to that in Argo observation (Katsura et al., 2013). Here, the MLSmax in each month is calculated as follows. First, we calculate the MLS maximum along the vertical direction at each grid point within the source region. Then, the MLSmax is obtained through averaging the MLS maxima at all grid points within the source region. The results are compared with the NPTW Smax at 137°E in Fig. 8. In EN4 and ORAS4, the time mean MLSmax are 35.14 and 35.16, respectively, about 0.06 and 0.03 larger than the mean Smax at 137°E. On the decadal time scale, it is significantly correlated with the NPTW Smax at 137°E with a lead of 10 months in EN4 (R=0.74 above the 95% confidence level) and 8 months in ORAS4 (R=0.92 above the 95% confidence level). The leading-time in EN4 and ORAS4 both agrees reasonably well with the advection period from the NPTW source region to the 137°E meridian by NEC as estimated by Suga et al. (2000), which is about 12 months. The leading-time in ORAS4, however, is slightly shorter than the observation. It is quite possibly because the assimilated westward NEC in ORAS4 is slightly stronger than the actual one, which should be further studied with direct current observations in the future.

|
| Fig.8 Decadal time series of the MLSmax in the source region (blue line) and NPTW Smax (orange line) at 137°E in EN4 (a) and in ORAS4 (b) |
The westward advection of the decadal anomaly of MLSmax by NEC can be clearly seen from the timelongitude plot (Fig. 9). To show that, we calculate at each longitude the decadal anomaly of the salinity maximum to the north of 10°N and between σθ=23.8 kg/m3 and σθ=24.2 kg/m3 isopycnals. As shown in Fig. 9, EN4 and ORAS4 give nearly the same results. There is significant westward advection of positive salinity anomalies around 1980 and in the early 2010s, while negative salinity anomalies around 1975, 2000, and late 2000s. However, not all NPTW Smax extrema at 137°E correspond to westward advection of salinity anomalies from the source region, such as the NPTW Smax maximum appearing around 1995.

|
| Fig.9 Time-longitude plot of the decadal anomaly of the salinity maximum to the north of 10°N and between σθ=23.8 kg/m3 and σθ=24.2 kg/m3 isopycnals in EN4 (a) and ORAS4 (b) |
In order to quantify the respective contributions of the circulation variations in the northwestern tropical Pacific Ocean and salinity variations in the source region, we examine the subsurface salinity budget at 137°E with ORAS4. Without any sinks and sources, the temporal evolution of the subsurface salinity S(x, y, z, t) is determined by the following advectiondiffusion equation (e.g., Fukumori et al., 2004):
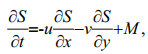 (2)
(2)where u and v are the zonal and meridional velocities, respectively. x, y, z, and t are longitude, latitude, depth and time, respectively. 
In Eq.2, the salinity and horizontal velocities can be expressed as the sum of their climatological means (S, u, and v) and anomalies (S′, u′, and v′), that is S=S+S′, u=u+u′, and v=v+v′. The overbar represents the time mean and prime denotes the anomaly. Similarly, the diffusion term M can also be expressed as the sum of its climatological mean and the anomaly M=M+M′. Therefore, Eq.2 can be rewritten as:
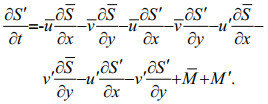 (3)
(3)Averaging Eq.3 over time results in
 (4)
(4)Subtracting Eq.4 from Eq.3, we can obtain the expression for ∂S′/∂t as
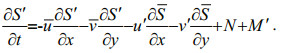 (5)
(5)On the right-hand side (RHS) of Eq.5, the first two terms indicate the advection of salinity anomaly by the mean current, denoting the contribution of salinity variation in the source region. The second two terms indicate the advection of mean salinity by the anomalous current, denoting the contribution of circulation variations in the northwestern tropical Pacific Ocean. 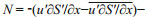
Figure 10 presents the monthly time series of various terms in Eq.5 except M' for the period of JMA observation (1967–2017) averaged over 11°–23°N and 100–200 m along the 137°E meridian, which corresponds well to the climatological NPTW region. The STD of the monthly ∂S′/∂t is about 0.242/month. Of terms on the RHS of Eq.5, only -u∂S′/∂x agrees quite well with ∂S′/∂t both in the magnitude and temporal phase. The correlation between them is high with R being 0.70 above the 95% confidence level. The other terms are all poorly correlated to ∂S′/∂t with R being 0.07 for -v∂S′/∂y, -0.09 for -u′∂S/∂x, 0.06 for -v′∂S/∂y, and 0.37 for N, respectively. Moreover, the STD of monthly -u∂S′/∂x is about 0.308/month, comparable with that of monthly ∂S′/∂t. The STDs of the other terms, however, are all much smaller, being 0.010/month for -v∂S′/∂y, 0.037/month for -u′∂S/∂x, 0.073/month for -v′∂S/∂y, and 0.083/month for N. Therefore, the advection of salinity anomaly by the mean current dominates the monthly ∂S′/∂t.

|
| Fig.10 Monthly time series of terms (/month) in Eq.5 except M' for the period of 1967–2017 averaged over 11°N–23°N and 100–200 m along the 137°E meridian with ORAS4 |
We then examine the situation on the decadal timescale. As the NPTW Smax varies with time in its location, it is difficult to directly conduct subsurface salinity budget to examine the dominant processes for the NPTW Smax. However, we note that the decadal salinity anomaly averaged over 11°–23°N and 100– 200 m along the 137°E meridian (S') agrees quite well with the decadal NPTW Smax anomaly (Fig. 11a). They are highly correlated with each other (R=0.89 above the 95% confidence level) and have comparable STDs, which are 0.024 and 0.031, respectively. Therefore, processes responsible for the decadal variation of the NPTW Smax are equivalent to those dominating the decadal variation of the above areaaveraged salinity anomaly S'.

|
| Fig.11 Decadal time series of the salinity anomaly (black line), ∂S′/∂t (/month; blue line) averaged over 11°–23°N and 100– 200 m along the 137°E meridian and the NPTW Smax (orange line) (a); same as Fig. 10 but for decadal time series (b) |
The STD of the decadal area-averaged ∂S′/∂t is about 0.010/month (Fig. 11b). Of terms on the RHS, the decadal -u∂S′/∂x, -u′∂S/∂x and -v′∂S/∂y have comparable STDs with decadal ∂S′/∂t, which are 0.042/month, 0.017/month and 0.010/month, respectively. The STDs of decadal -v∂S′/∂y and N are respectively 0.005/month and 0.007/month, much smaller than that of decadal ∂S′/∂t and thus being neglected. Correlation analysis indicates that the decadal ∂S′/∂t is moderately positively correlated with decadal -u∂S′/∂x (R=0.50 above the 95% confidence level), weakly negatively correlated with -u′∂S/∂x (R=-0.36) and poorly correlated with -v′∂S/∂t (R=0.27). Therefore, on the decadal time scale, it is also the advection of salinity anomaly by the mean current that controls the temporal evolution of the NPTW Smax at 137°E (Nan et al., 2015). Indeed, extrema of -u∂S′/∂x coincides reasonably well with those of ∂S′/∂t considering the long period of decadal variation. However, we also note that -u∂S′/∂x and ∂S′/∂t show completely opposite temporal phases in the early 1990s, implying during this period the former is not the dominant factor.
Representing the anomalous advection of mean salinity, the decadal -u′∂S/∂x correlates well with decadal NEC transport (R=0.50 above the 95% confidence level; Fig. 5b and Fig. 6b) and thus the circulation variations in the northwestern tropical Pacific Ocean. As seen from Fig. 11b, it also positively contributes to the appearance of part of the NPTW Smax extrema. For example, the decadal ∂S′/∂t is positive and negative before and after 1995, respectively. From 1990 to 1995 when the decadal ∂S′/∂t is positive, the decadal -u′∂S/∂x is also positive, while the decadal -u∂S′/∂x is negative. Therefore, it is the decadal -u′∂S/∂x that dominantly induces the NPTW Smax maximum around 1995. Meanwhile, the nonlinear term, which represents contributions of smaller-scale processes, such as mesoscale eddy activities (e.g., Nakano et al., 2015), is also at work, especially after 2000, when it agrees reasonably well with the decadal ∂S′/∂t.
It should be noted that the decadal subsurface salinity budget presented in Fig. 11b is not closed. There are three possible reasons. One is due to errors in ORAS4. The second one is that the terms displayed in Fig. 11b are simply the spatial average over a small area along the 137°E meridian instead of around a closed box region. The third one that the turbulent diffusion term is neglected. Therefore, the subsurface salinity budget should be further explored in the future with more in-situ observations.
4.4 Relation to Pacific Decadal OscillationAccording to Zhai et al. (2013), the decadal circulation variation in the northwestern tropical Pacific Ocean is dominated by the decadal wind forcing in the tropical western Pacific Ocean associated with the PDO via both local Ekman dynamics and baroclinic Rossby wave propagation. Moreover, the decadal MLS variation in the source region is also forced by PDO through changing the air-sea freshwater flux and wind-induced Ekman pumping (e.g., Nakano et al., 2015; Nan et al., 2015; Oka et al., 2017). On the other hand, Katsura et al. (2013) compared the variation of the salinity maximum value along 137°E and that of PDO index, showing the strongest correlation with the PDO index during 1992–2012. To examine the relation for a sufficiently long period, we demonstrate the decadal variabilities during 1967–2012. As shown in Fig. 12a, the simultaneous linear correlation of decadal Smax with PDO index is about 0.42, above the 95% confidence level. In addition, decadal salinity anomaly and NEC transport both correspond very well to the PDO index, with the correlation coefficients being about 0.67 and 0.62, respectively. These, associating with previous studies, strongly supports that the NPTW decadal variation is controlled by PDO.

|
| Fig.12 Decadal time series of Smax (black line) calculated from JMA observation and PDO index (orange line) obtained from http://jisao.washington.edu/pdo/ (a); decadal time series of salinity anomaly (black line) averaged over 11°–23°N and 100-200 m and NEC transport (blue line) derived from ORAS4 (b) For comparison, PDO index is also plotted in (b) as the orange line. |
In this paper, we investigate the decadal variation of the NPTW at 137°E using the repeated hydrographic observations along with two other global gridded ocean products, the EN4 and ORAS4. The NPTW at 137°E is defined as the water mass with salinity larger than 34.9, and basically spans from 11°N to 23.5°N in latitude and from σθ=23.0 kg/m3 to σθ=25.0 kg/m3 in vertical. All the three ocean products indicate that the maximum salinity (Smax) of NPTW experiences significant quasi-decadal variations, showing maxima around 1979, 1987, 1995, 2004, and 2012, while minima around 1974, 1983, 1991, 1999 and 2008 during the JMA observations period. The NPTW area also shows similar quasi-decadal variation, expanding/ shrinking as its maximum salinity increases/decreases at the 137°E section.
The decadal variation of the NPTW at 137°E is mainly induced by those of the large-scale circulation in the northwestern tropical Pacific Ocean and MLS at its source region. On one hand, both the Smax and area of the NPTW are significantly positively correlated with the NEC transport (R=0.53 and 0.85 above the 95% confidence level). Associated with the maximum/minimum of decadal NEC transport, there are cyclonic/anticyclonic gyre anomalies in the northwestern tropical Pacific Ocean, which results in more/less saline water being advected westward across the 137°E meridian (Fig. 7). On the other hand, the decadal variation of the NPTW at 137°E is also significantly correlated with that of the MLS at the source region with a time lag compared with the advection period from the source region to the 137°E meridian by NEC (Suga et al., 2000). This can be clearly seen from the time-longitude plot of the decadal anomaly of the salinity maximum north of 10°N and between σθ=23.8 kg/m3 and σθ=24.2 kg/m3 isopycnals. However, not all NPTW Smax extrema at 137°E correspond to the westward advection of salinity anomalies from the source region. The underlying processes at work are confirmed by a careful subsurface salinity budget analysis.
Besides, the subsurface salinity budget analysis suggests that the short-term processes, such as mesoscale eddy activities (e.g., Nakano et al., 2015), is also at work through nonlinear interactions, especially after 2000. It is worth noting that the effect of the three-dimensional turbulent diffusion is excluded from the current analysis due to lack of long-term high-resolution turbulence observations, which should be further quantified in the future.
6 DATA AVAILABILITY STATEMENTIn this study, the JMA observations, EN4 and ORAS4 are downloaded from http://www.data.jma.go.jp/gmd/kaiyou/db/vessel_obs/data-report/html/ship/ship_e.php, https://www.metoffice.gov.uk/hadobs/en4/index.html, and https://www.ecmwf.int/en/forecasts/datasets/archive-datasets/browse-reanalysis-datasets, respectively. All the three databases are public and free.
7 ACKNOWLEDGEMENTThe repeated hydrographic observations along 137°E is provided by Japan Meteorological Agency.
Balmaseda M A, Mogensen K, Weaver A T. 2013. Evaluation of the ECMWF ocean reanalysis system ORAS4. Quarterly Journal of the Royal Meteorological Society, 139(674): 1 132-1 161.
DOI:10.1002/qj.2063 |
Balmaseda M A, Vidard A, Anderson D L T. 2008. The ECMWF ocean analysis system:ORA-S3. Monthly Weather Review, 136(8): 3 018-3 034.
DOI:10.1175/2008MWR2433.1 |
Bingham F M, Suga T, Hanawa K. 2002. Origin of waters observed along 137°E. Journal of Geophysical Research:Oceans, 107(C7): 3 073.
DOI:10.1029/2000JC000722 |
Boyer T P, Antonov J I, Baranova O K, Garcia H E, Johnson D R, Locarnini R A, Mishonov A V, O'Brien T D, Seidov D, Smolyar I V, Zweng M M. 2009. World ocean database 2009. In: Levitus S ed. NOAA Atlas NESDIS 66. Springer, Washington, D.C. 216p.
|
Boyer T P, Levitus S, Antonov J I, Locarnini R A, Garcia H E. 2005. Linear trends in salinity for the World Ocean, 1955-1998. Geophysical Research Letters, 32(1): L01604.
DOI:10.1029/2004GL021791 |
Cannon G A. 1966. Tropical waters in the western Pacific Ocean, August-September 1957. Deep Sea Research and Oceanographic Abstracts, 13(6): 1 139-1 148.
DOI:10.1016/0011-7471(66)90705-4 |
Curry R, Dickson B, Yashayaev I. 2003. A change in the freshwater balance of the Atlantic Ocean over the past four decades. Nature, 426(6968): 826-829.
DOI:10.1038/nature02206 |
Delcroix T, McPhaden M J, Dessier A, Gouriou Y. 2005. Time and space scales for sea surface salinity in the tropical oceans. Deep Sea Research Part I:Oceanographic Research Papers, 52(5): 787-813.
DOI:10.1016/j.dsr.2004.11.012 |
Fukumori I, Lee T, Cheng B, Menemenlis D. 2004. The origin, pathway, and destination of Niño-3 water estimated by a simulated passive tracer and its adjoint. Journal of Physical Oceanography, 34(3): 582-604.
DOI:10.1175/2515.1 |
Good S A, Martin M J, Rayner N A. 2013. EN4:quality controlled ocean temperature and salinity profiles and monthly objective analyses with uncertainty estimates. Journal of Geophysical Research:Oceans, 118(12): 6 704-6 716.
DOI:10.1002/2013JC009067 |
Guinehut S, Coatanoan C, Dhomps A L, Le Traon P Y, Larnicol G. 2009. On the use of satellite altimeter data in Argo quality control. Journal of Atmospheric and Oceanic Technology, 26(2): 395-402.
DOI:10.1175/2008JTECHO648.1 |
Guo Y Q, Lin X P, Wei M, Liu C, Men G. 2018. Decadal variability of North Pacific eastern subtropical mode water. Journal of Geophysical Research:Oceans, 123(9): 6 189-6 206.
DOI:10.1029/2018JC013890 |
Hu S J, Sprintall J. 2016. Interannual variability of the Indonesian Throughflow:the salinity effect. Journal of Geophysical Research:Oceans, 121(4): 2 596-2 615.
DOI:10.1002/2015JC011495 |
Ingleby B, Huddleston M. 2007. Quality control of ocean temperature and salinity profiles-historical and real-time data. Journal of Marine Systems, 65(1-4): 158-175.
DOI:10.1016/j.jmarsys.2005.11.019 |
Kaneko I, Takatsuki Y, Kamiya H, Kawae S. 1998. Water property and current distributions along the WHP-P9 section (137°-142°E) in the western North Pacific. Journal of Geophysical Research:Oceans, 103(C6): 12 959-12 984.
DOI:10.1029/97JC03761 |
Katsura S, Oka E, Qiu B, Schneider N. 2013. Formation and subduction of North Pacific tropical water and their interannual variability. Journal of Physical Oceanography, 43(11): 2 400-2 415.
DOI:10.1175/JPO-D-13-031.1 |
Li Y L, Wang F, Han W Q. 2013. Interannual sea surface salinity variations observed in the tropical North Pacific Ocean. Geophysical Research Letters, 40(10): 2 194-2 199.
DOI:10.1002/grl.50429 |
Li Y L, Wang F, Zhai F G. 2012. Interannual variations of subsurface spiciness in the Philippine Sea:observations and mechanism. Journal of Physical Oceanography, 42(6): 1 022-1 038.
DOI:10.1175/JPO-D-12-06.1 |
Li Y L, Wang F. 2012. Spreading and salinity change of North Pacific tropical water in the Philippine Sea. Journal of Oceanography, 68(3): 439-452.
DOI:10.1007/s10872-012-0110-3 |
Lukas R. 2001. Freshening of the upper thermocline in the North Pacific subtropical gyre associated with decadal changes of rainfall. Geophysical Research Letters, 28(18): 3 485-3 488.
DOI:10.1029/2001GL013116 |
Mantua N J, Hare S R, Zhang Y, Wallace J M, Francis R C. 1997. A Pacific interdecadal climate oscillation with impacts on salmon production. Bulletin of the American Meteorological Society, 78(6): 1 069-1 079.
DOI:10.1175/1520-0477(1997)078<1069:APICOW>2.0.CO;2 |
Nakano T, Kitamura T, Sugimoto S, Suga T, Kamachi M. 2015. Long-term variations of North Pacific Tropical Water along the 137°E repeat hydrographic section. Journal of Oceanography, 71(3): 229-238.
DOI:10.1007/s10872-015-0279-3 |
Nan F, Yu F, Xue H J, Wang R, Si G C. 2015. Ocean salinity changes in the northwest Pacific subtropical gyre:the quasi-decadal oscillation and the freshening trend. Journal of Geophysical Research:Oceans, 120(3): 2 179-2 192.
DOI:10.1002/2014JC010536 |
Nie X W, Gao S, Wang F, Qu T D. 2016. Subduction of North Pacific Tropical Water and its equatorward pathways as shown by a simulated passive tracer. Journal of Geophysical Research:Oceans, 121(12): 8 770-8 786.
DOI:10.1002/2016JC012305 |
Oka E, Ishii M, Nakano T, Suga T, Kouketsu S, Miyamoto M, Nakano H, Qiu B, Sugimoto S, Takatani Y. 2018. Fifty years of the 137°E repeat hydrographic section in the western North Pacific Ocean. Journal of Oceanography, 74(2): 115-145.
DOI:10.1007/s10872-017-0461-x |
Oka E, Katsura S, Inoue H, Kojima A, Kitamoto M, Nakano T, Suga T. 2017. Long-term change and variation of salinity in the western North Pacific subtropical gyre revealed by 50-year long observations along 137°E. Journal of Oceanography, 73(4): 479-490.
DOI:10.1007/s10872-017-0416-2 |
Qu T D, Lukas R. 2003. The bifurcation of the North Equatorial Current in the Pacific. Journal of Physical Oceanography, 33(1): 5-18.
DOI:10.1175/1520-0485(2003)033<0005:TBOTNE>2.0.CO;2 |
Qu T D, Mitsudera H, Yamagata T. 1998. On the western boundary currents in the Philippine Sea. Journal of Geophysical Research:Oceans, 103(C4): 7 537-7 548.
DOI:10.1029/98JC00263 |
Qu T D, Mitsudera H, Yamagata T. 1999. A climatology of the circulation and water mass distribution near the Philippine coast. Journal of Physical Oceanography, 29(7): 1 488-1 505.
DOI:10.1175/1520-0485(1999)029<1488:ACOTCA>2.0.CO;2 |
Ren L, Riser S C. 2010. Observations of decadal time scale salinity changes in the subtropical thermocline of the North Pacific Ocean. Deep Sea Research Part Ⅱ:Topical Studies in Oceanography, 57(13-14): 1 161-1 170.
DOI:10.1016/j.dsr2.2009.12.005 |
Shuto K. 1996. Internnual variations of water temperature and salinity along the 137°E meridian. Journal of Oceanography, 52(5): 575-595.
DOI:10.1007/BF02238322 |
Smith D M, Cusack S, Colman A W, Folland C K, Harris G R, Murphy J M. 2007. Improved surface temperature prediction for the coming decade from a global climate model. Science, 317(5839): 796-799.
DOI:10.1126/science.1139540 |
Suga T, Kato A, Hanawa K. 2000. North Pacific Tropical Water:its climatology and temporal changes associated with the climate regime shift in the 1970s. Progress in Oceanography, 47(2-4): 223-256.
DOI:10.1016/S0079-6611(00)00037-9 |
Tsuchiya M. 1968. Upper waters of the intertropical Pacific Ocean. In: Reid J L Jr ed. The Johns Hopkins Oceanographic Studies. The Johns Hopkins Press, Baltimore. 50p, https://doi.org/10.4319/lo.1969.14.4.0650c.
|
Vergara O, Dewitte B, Ramos M, Pizarro O. 2017. Vertical energy flux at E NSO time scales in the subthermocline of the Southeastern Pacific. Journal of Geophysical Research:Oceans, 122(7): 6 011-6 038.
DOI:10.1002/2016JC012614 |
Vinayachandran P N, Nanjundiah R S. 2009. Indian Ocean sea surface salinity variations in a coupled model. Climate Dynamics, 33(2-3): 245-263.
DOI:10.1007/s00382-008-0511-6 |
Wong A P S, Bindoff N L, Church J A. 1999. Large-scale freshening of intermediate waters in the Pacific and Indian Oceans. Nature, 400(6743): 440-443.
DOI:10.1038/22733 |
Yan Y F, Chassignet E P, Qi Y Q, Dewar W K. 2013. Freshening of subsurface waters in the Northwest Pacific Subtropical Gyre:observations and dynamics. Journal of Physical Oceanography, 43(12): 2 733-2 751.
DOI:10.1175/JPO-D-13-03.1 |
Zhai F G, Hu D X, Qu T D. 2013. Decadal variations of the North Equatorial Current in the Pacific at 137°E. Journal of Geophysical Research:Oceans, 118(10): 4 989-5 006.
DOI:10.1002/jgrc.20391 |
Zhai F G, Wang Q Y, Wang F J, Hu D X. 2014. Decadal variations of Pacific North Equatorial Current bifurcation from multiple ocean products. Journal of Geophysical Research:Oceans, 119(2): 1 237-1 256.
DOI:10.1002/2013JC009692 |