 2019, Vol. 37
Institute of Oceanology, Chinese Academy of Sciences
Article Information
- WANG Xin'an, MA Aijun, HUANG Zhihui, SUN Zhibin, CUI Wenxiao, QU Jiangbo, YU Hong
- Estimation of genetic parameters for upper thermal tolerances and growth-related traits in turbot Scophthalmus maximus
- Journal of Oceanology and Limnology, 37(5): 1736-1745
- http://dx.doi.org/10.1007/s00343-019-7267-1
Article History
- Received Oct. 15, 2017
- accepted in principle Apr. 10, 2018
- accepted for publication Dec. 15, 2018


2 Laboratory for Marine Biology and Biotechnology, Qingdao National Laboratory for Marine Science and Technology, Qingdao 266071, China;
3 Yantai Tianyuan Aquatic Limited Corporation, Yantai 264006, China
Turbot (Scophthalmus maximus L.) is one of the most economically important aquaculture flatfish species globally. This species is widely distributed in the Mediterranean, the Black Sea, and Sea Baltic Sea (Zhang et al., 2014; Wang et al., 2015; Wang and Ma, 2016; Ma et al., 2018). In recent years, there have been great advances in turbot culture in China; however, some issues, including temperature tolerance, are restricting the development of the industry. Water temperature is one of the most important environmental factors influencing fish growth (Campinho et al., 2004; Larsson and Berglund, 2005; Imsland et al., 2007; Árnason et al., 2009; Huang et al., 2014). Turbot is a kind of cold-water fish with rigorous temperature requirements, and so is especially susceptible to temperature stress (Zhang et al., 2014; Ma et al., 2018). Suitable water temperatures for turbot range from 16 to 24℃ (Xu et al., 2015; Ma et al., 2018). Under good water quality conditions, adult turbot can tolerate temperatures of 25–26℃, but not for extended periods. The high and low growth temperature ranges were 21–22℃ and 7–8℃, respectively (Ma et al., 2012). Purdom et al. (1972) showed that the maximum temperature for turbot growth is 18.9℃. Survival rates of juvenile turbot cultured for 20 days in 4–20℃, 22–24℃, 26℃, and 28℃ in 20 days were 100%, 80%, 40%, and 0%, respectively (Gao et al., 2006). Temperature essentially affects physiological, and biochemical life history processes of a fish (Beitinger et al., 2000). Abnormally high temperatures would result in a stress response in fish, causing reduced disease resistance, growth rate, and reproductive activity (Dominguez et al., 2004). Natural water temperatures in turbot culture areas of North China where turbot are usually higher than 26℃ throughout the whole summer (May to September) (Zhang et al., 2014; Ma et al., 2018). As optimal growth temperatures are around 16℃, these high temperatures are unsuitable for rearing turbot. To overcome this issue, the current cooling method is generally used with seawater pumped from deep wells. This method is effective but also has obvious disadvantages. The extraction of groundwater requires large amounts of energy and can cause a large-scale decrease in the water table and subsequent water shortages (Ma et al., 2018). The culture cycle of turbot on the South China coast is usually from midNovember to the following April, representing a short culture cycle. Extending the cycle will greatly improve the efficiency of the culture process. Thus, the genetic improvement of the upper thermal tolerance of turbot is extremely important in promoting the sustainable and stable development of the industry.
Establishing the genetic variation of economically important traits is a prerequisite for a successful commercial selective breeding program (Taylor et al., 2009). Hence, estimation of genetic parameters for improved traits is an important and essential element of fish breeding programs (Fu et al., 2015; Sun et al., 2015; Liu et al., 2016; Ma et al., 2018). Heritability, genetic correlation, and repetition rate are major genetic parameters describing the heredity of quantitative traits in quantitative genetic analysis and can elucidate the proportion of variation of quantitative traits and of co-variation between two traits attributing to genetic effects by estimating variance components. Therefore, these three genetic parameters play a very important role in evaluating breeding value, predicting response to selection and determining properly breeding plans (Sun et al., 2015; Ma et al., 2018). The accurate estimation of these parameters is related directly to the efficiency of the breeding program.
The characteristics assessed, as a selection trait, must adequately predict the objective trait and be cost effective to measure (Taylor et al., 2009). In many aquaculture breeding programs, the selection trait for temperature resistance is generally measured as survival or upper thermal tolerance (UTT; calculated as cumulative thermal exposure in degree hours) under a controlled thermal challenge (Johns, 1981; Thomas et al., 2000; Perry et al., 2003, 2005; Encomio and Chu, 2005; Nakajima et al., 2009; Liu et al., 2011; Pess et al., 2011; Ma et al., 2012; Zhang et al., 2014). The economic importance of UTTs in aquaculture species has given rise to some experiments estimating genetic parameters with the aim of genetic improvement, but these studies were mainly focused on the genetic evaluation of UTT as a selection trait of temperature resistance (Perry et al., 2005; Liu et al., 2011; Zhang et al., 2014). Less attention has, to date, been paid to estimating genetic parameters of survival under thermal challenge, although survival has been considered as an evaluation index of temperature resistance in some works of literature (Johns, 1981; Thomas et al., 2000; Perry et al., 2003; Encomio and Chu, 2005; Nakajima et al., 2009; Pess et al., 2011; Ma et al., 2012). Statistical models for survival data analysis can be classified as longitudinal and crosssectional models, such as the proportional hazard frailty model and the threshold model (Yáñez et al., 2013). There are differences between the two types of models, in terms of how to use available information (Ødegård et al., 2011). Cross-sectional models are the simplest models for analyzing challenge test data and have been shown to produce accurate predictions of breeding values (Ødegård et al., 2006, 2007), especially for balanced data with a large sample size in similar environments (Ødegård et al., 2011). Thus, cross-sectional models can be defined as models evaluating temperature resistance measured as a single record at a fixed time point.
The ultimate goal of the breeding program, regardless of any improved traits, is to achieve greater economic benefits. There is little value to thermotolerance selection without considering growth rate, and a fast growth rate should be included in the breeding goal of the genetic improvement of thermotolerance. A selective breeding program for fast growth and thermotolerance in turbot was carried out at the Yellow Sea Fisheries Research Institute, Chinese Academy of Fishery Sciences in 2007. The current study evaluates the heritability of upper thermal tolerance in turbot using survival data obtained from a thermal challenge and body weight. Genetic correlations between the two traits were carried out by full- and half-sib family analysis using three kinds of cross-sectional models (cross-sectional linear model, cross-sectional threshold probit model, and cross-sectional threshold logit model) and the animal model. The main objective of this study was to provide an insight into the selection using the genetic parameters of the two traits.
2 MATERIAL AND METHOD 2.1 Production of families and rearingThe data used were obtained from a breeding program initiated in 2007 by the Yellow Sea Fisheries Research Institute, Qingdao, China. Four turbot stocks were imported from France, England, Norway, and Denmark between June 2002 and September 2003. Genetic background analyses of the four stocks were used to establish base populations for selective breeding. 170 brood stocks, comprising 68 males and 102 females were obtained. These brood stocks (G0 generation) were individually tagged with PIT-Tags (Passive Integrated Transponder, Biosonic, Seattle, USA) in December 2006. In April 2007, 56 F1 fullsib families were constructed successfully using nested mating designs with two females mated to one male by Tianyuan Aquatic Limited Corporation, Yantai, Shandong, China. At the early rearing stage, the families were reared in separate tanks until tagging. When the families reached three months of age, 250–300 individuals were randomly selected from each family for tagging using VIE (Visible Implant Elastomer) (to distinguish different families) and then stocked communally. When all tagged individuals with VIE were communally reared up to nine months of age, they were individually tagged with PIT (to distinguish individuals and families). In April 2008, when the families were 12 months of age, 32 high survival families (100 animals per family) were selected to test upper thermal tolerance. To ensure similar rearing conditions for all families at different stages of rearing, measures were taken to standardize both the stocking density and the environmental conditions. The standard operating procedures followed those recommended by Wang et al. (2010).
2.2 Challenge test and data collectionIn April 2008, 3 200 individuals from 32 families (100 animals per family) were used to test upper thermal tolerance. Individuals from each family were reared in separate tanks for ten days at 13℃ before exposure to an acute thermal challenge. Some individuals did not survive the ten days of temporary culture and only five families had 100% survival rates at the beginning of the experiment. Over the entire experimental period, the temperature at which fish were subjected to chronic thermal shock increased by 14℃ (1℃/12 h up to 25℃ and 1℃/24 h from 25℃ to 27℃), after which the temperature was maintained at 27℃ until the end of the experiment. The experiment was stopped when 50% of all individuals were recorded to have lost their activity. The time to LOA (loss of activity) was determined according to the reaction of test fish when the water was agitated for ten seconds. The experiment lasted for approximately 145 h in total. During the experimental process, automatic thermostat control, aerated cultures, and stagnant water were applied to culture the experimental fish. Fish activity was observed every hour and individuals exhibiting LOA were removed in a timely fashion. During the thermotolerance test, normal feeding, water exchange, and bottom clearing were carried out once a day.
Trait definition of challenge test survival is used according to the method of Yáñez et al. (2013).
1. Test-period survival (TPS), which was scored as 0 if the fish lost activity in the experimental period and 1 if the fish were active until the end of the experiment. This trait was analyzed using a CSL model (cross-sectional linear model) and a THRp model (binary threshold (probit) model), to account for the binary nature of the trait.
2. Test-day survival (TDS), in which the survival time (unit, day) was transformed into binary survival records. There was one record for every day the fish kept in the challenge test and the number of records per fish equals the number of days until LOA (A starting point was determined based on the test-day of the first LOA). For each day, an observation was scored as 0 if the fish were active on the actual testday and 1 if the fish were not active on the actual-test day (Yáñez et al., 2013). This trait was analyzed using a THRl model with a logit link function (survival score model), to account for the binary nature of the trait.
The body weight of fish was also measured using an electronic balance with a precision of 0.01 g.
2.3 Data analysis 2.3.1 Estimation of genetic parameters for survival dataGenetic parameters for survival date were estimated using three kinds of cross-sectional models (univariate sire-dam models), i.e., cross-sectional linear model (CSL), cross-sectional threshold probit model (THRp) and cross-sectional threshold logit model (THRl), in order to take the binary nature of the trait into account. CSL and THRl were used to analyze the test-period survival, and THRp was used to analyze the test-day survival. The three cross-sectional models can be written as:
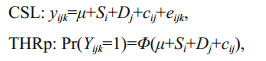
where yijk is 0 if the fish lost activity in the test period and 1 if the fish maintained activity until the end of the experiment; μ is the population mean; Si is the random genetic effect of the sire i; Dj is the random genetic effect of the dam j; cij is full-sib family random effect; eijk is the random residual; and Φ() is the standard cumulative normal distribution function:

where yijk is 0 if the fish retained activity on the actual test-day and 1 if the fish lost activity on the actual-test day. The other parameters are as defined above.
For the three models, sire and dam effects assumed ~N (0, AσSD2) where AσSD2 =σS2=σD2 and A is the additive genetic relationship matrix among the animals (including parents). Residuals assumed ~ N (0, INe2) for estimation of heritability, the residual variance on the scale for THRp was set to 1 and was set to π2/3~3.3 for the THRl model (Yáñez et al., 2013).
For the three cross-sectional models (CSL, THRp, and THRl) narrow sense heritability was calculated as:

where σS2, σD2, σc2, and σe2, and are the sire variance component, dam variance component, full-sib family variance component, and residual variance component, respectively.
2.3.2 Model comparisonAs the cross-sectional models estimating genetic parameters of survival used two kinds of different trait definitions, the accuracy of selection (rτ) was used to compare the models. The accuracy of selection was determined through the correlation between the estimated breeding values (EBVs) of full-sib families for two random data subsets using the variance components estimated from the entire dataset. The accuracy of selection is closely related to the Pearson correlation coefficient between the EBVs of full-sib families (rEBV) predicted using different data subsets. According to selection index theory, it has been proven that rEBV≈rτ2 when there is a similar amount of information per family in the two data sets and there is an unbiased prediction of breeding values (Gitterle et al., 2006; Yáñez et al., 2013). Hence, the estimated rEBV can be used for evaluating models according to their accuracy of selection (Gitterle et al., 2006; Yáñez et al., 2013). Furthermore, rank correlations of EBVs of full-sib families from each model were calculated to determine the agreement between the genetic predictions of the different methods.
2.3.3 Estimation of genetic parameters for body weightThe genetic parameters for body weight were estimated using an animal model. The model can be written as:

where μ is the mean value of population, yij is the measured values of body weight, ai is the random additive effect of an individual and is distributed ~N (0, A σa2) where A is the numerator relationship matrix, fj is the full-sib family as a random effect and eij is the residual random effect (between fish within families).
For the animal model, the narrow sense heritability was calculated as the proportion of additive genetic variance to total variance as follows:
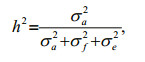
where σa2, σf2, and σe2, are additive variance components, the full-sib family variance component, and the residual variance component, respectively.
The heritability and breeding values of the two traits were estimated using the software package ASReml version 3.0 (Gilmour et al., 2009). In order to determine the agreement among genetic predictions of three cross-sectional models, the rank correlation (Pearson and Spearman) coefficient among the fullsib family survival EBVs from each model were calculated using the software package ASReml version 3.0 (Gilmour et al., 2009). The phenotypic and genetic correlations between the two traits were calculated based on phenotype and breeding values by using SPSS 13.0 (SPSS Inc., Chicago, IL, USA, 2001). The t test was used to test the significance level of each estimate from zero. Before analysis, all data were checked for outliers using box plots.
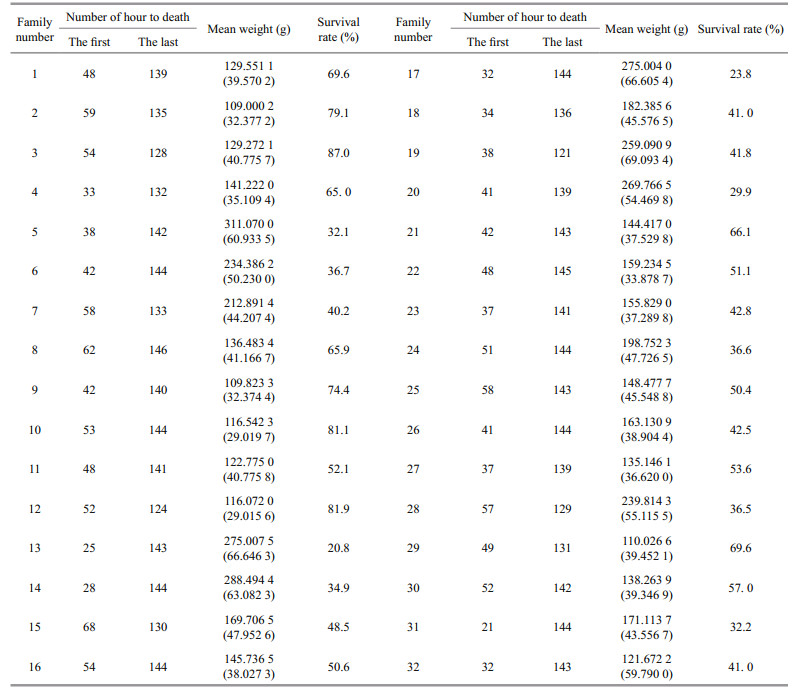
3 RESULT 3.1 Survival summarySurvival rates for turbot families in the experimental temperature tolerance test are shown in Table 1. The survival rates of 32 families ranged from 20.8% to 87.0%. The survival rate of family 13 was the lowest (20.8%), while family 3 exhibited the highest survival rate (87.0%). There was substantial genetic variation in temperature tolerance among families.
|
Heritability values for family survival data under high temperature stress were 0.247 9±0.108 3, 0.288 3±0.161 2, and 0.106 9±0.045 2, from the CSL, THRp, and THRl models, respectively. The standard error values obtained for these heritabilities were 0.108 3, 0.161 2, and 0.045 2 from the CSL, THRp, and THRl models, respectively (Table 2).

|
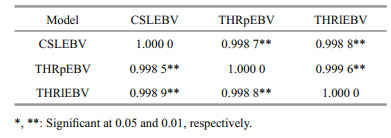
The Pearson and Spearman correlation coefficients from the full-sib family EBVs based on the three models were shown in Table 3. All correlations were positive and high (higher than 0.998 5). Pearson correlation coefficients between THRlEBV and THRpEBV, THRlEBV and CSLEBV, and THRpEBV and CSLEBV were 0.999 6, 0.998 8, and 0.998 7, respectively. The highest correlation was obtained between THRlEBV and THRpEBV. The other two correlation coefficients were only 0.000 8 and 0.000 1, respectively. Spearman correlation coefficients between THRlEBV and THRpEBV, TTHRlEBV and CSLEBV, and THRpEBV and CSLEBV were 0.998 8, 0.998 9, and 0.998 5. The highest correlation was achieved between TTHRlEBV and CSLEBV, while the other two correlation coefficients were only 0.000 1 and 0.000 3. These results indicated that an almost identical ranking of families is generated regardless of which model is used.
|
The Pearson correlation coefficients and the accuracy of selection among full-sib family EBVs from two data subsets are presented in Table 4. Among the three models tested, the highest correlation and accuracy of selection between the two random data subsets were achieved with the THRl model (rEBV=0.638 1, rτ=0.784 4), the lowest correlation and accuracy of selection values were obtained with the CSL model (rEBV=0.598 8, rτ=0.773 8). The THRp model had moderate correlation and accuracy of selection values (rEBV=0.601 2, rτ=0.775 4). Accuracies of selection were very similar between the CSL and THRp models (rτ=0.773 8 and 0.775 4 for CSL and THRp).

|
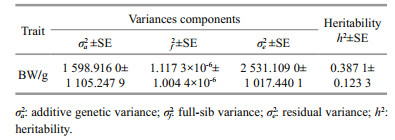
Heritability of body weight under high temperature stress using the animal model was 0.387 1±0.123 3 and the standard error was 0.123 3. The standard error of heritability (0.123 3) was significantly lower than the corresponding heritability (Table 5).
|
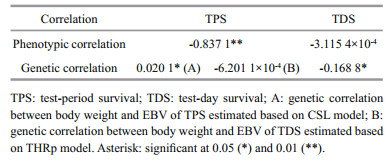
Genetic and phenotypic correlations (Pearson correlation) between body weight and survival data under high temperature stress were calculated (Table 6). The phenotypic correlations between body weight and test-period survival and between body weight and test-day survival were -0.837 1 and -3.115 4×10⁻⁴, respectively. The genetic correlations between body weight and EBVs from the CSL, THRp, and THRl models were 0.020 1, -6.201 1×10⁻⁴, and -0.168 8, respectively. A low positive correlation (0.020 1) was obtained between body weight and CSLEBV, while the correlation coefficients between body weight and THRpEBV and between body weight and THRlEBV were negative (-6.201 1×10⁻⁴ and -0.168 8).
|
In the current study, a total of 3 200 individuals from 32 families were subjected to a thermal challenge to estimate genetic parameters of survival (test-period survival and test-day survival) using the restricted likelihood method based on CSL, THRp and THRl models. The CSL and THRp models were used for analysis of test-period survival, and the THRl model was applied to test-day survival. The estimated heritabilities obtained from the three models were 0.247 9±0.108 3, 0.288 3±0.161 2, and 0.106 9± 0.045 2, respectively. The differences between the estimated heritabilities are attributed mainly to differences in trait definition and analysis. The estimated heritability obtained from the THRl model was significantly lower than the estimated heritability values obtained from the CSL and THRp models. It is likely that this is due to the division of data into several days across the test period. The full-sib family EBV estimates from the three models were very high and gave an almost identical ranking of families. These results are in keeping with the findings of Ødegård et al. (2006), Gitterle et al. (2006), and Yáñez et al. (2013). The accuracy of selection using the CSL model was almost identical to that obtained using the THRp model, whereas the accuracy of selection from the THRl model was slightly higher than those of the CSL and THRp models were. In addition, the standard error from the THRl model was significantly lower than the corresponding heritability in comparison with the CSL and THRp models. Therefore, the THRl model could be considered as the optimal model to estimate heritability from survival data based on both accuracy of selection and standard error.
The results from the current study and those reported by other authors show that there are significant differences between current heritabilities for survival data and heritabilities for UTT in both rainbow trout and turbot. These differences are mainly due to different evaluation indexes used for temperature resistance. The heritabilities of survival data, in the present study, are higher than the UTT values reported by both Zhang et al. (2014) and Liu et al. (2011). It is speculated that these intraspecific differences are primarily due to the number of samples contributing to the estimates, different developmental periods of samples, different source populations, and different statistical methods or models, in addition to different evaluation indexes. The heritabilities of current survival data obtained in the current study were significantly lower than the reported UTT for rainbow trout. It is likely that this discrepancy is due to differences between species, in addition to differences in evaluation indexes and the aforementioned factors of intraspecific differences that affect the genetic estimation of turbot. Heritability for body weight in turbot, under high temperature stress, was 0.387 1±0.123 3 and presented a high heritability. The phenotypic correlations between body weight and test survival, in addition to body weight and test-day survival, were -0.837 1 and -0.667 1, respectively. The genetic correlations between body weight and EBVs from the CSL, THRp, and THRl models were 0.020 1, -6.201 1×10⁻⁴ and -3.115 4×10⁻⁴, respectively. Although the phenotypic correlations between body weight and survival data were negative (-0.837 1 and -0.667 1) and the genetic correlations between body weight and CSLEBV had a low positive value (0.020 1). The conclusions about genetic and phenotypic correlations between upper thermal tolerance and body weight obtained from the current study are, on the whole, consistent with the conclusions of Perry et al. (2005), Liu et al. (2011) and Zhang et al. (2014), although the evaluation indicator for heat tolerance was different. There was a low positive correlation or negative correlation between thermotolerance and body weight regardless of the evaluation indicator used. Heritable traits usually include morphological, behavioral, physiological and life-history traits. For most morphological/production traits, phenotypic and genetic correlations tend to be highly positive (Perry et al., 2005). However, associations between morphological and physiological traits are generally more variable (Perry et al., 2005; Liu et al., 2011; Zhang et al., 2014). The results of the current study further confirmed this conclusion.
The magnitude of heritability can be categorized as low (0.050 0–0.150 0), medium (0.200 0–0.400 0), high (0.450 0–0.600 0), and very high (> 0.650 0) (Xu et al., 2015). In the present study, the three estimated heritabilities from the CSL, THRp and THRl models were 0.247 9±0.108 3, 0.288 3±0.161 2, and 0.106 9±0.045 2, respectively. According to the classification levels of Xu et al. (2015), the three heritabilities could be defined as a medium, medium and low, respectively. Selection methods are very flexible for the genetic improvement of traits with moderate heritability, while selection for traits with low heritability needs to be carefully considerate. Family selection is preferred when common environmental effects are low (Rye et al., 1990; Wang et al., 2010). Family selection is a feasible method for genetic improvement of survival under high temperature stress. The magnitude of correlation coefficients was classified as low (0.000 0–0.400 0), medium (0.450 0–0.550 0) and high (0.600 0–1.000 0) without considering the sign (Xu et al., 2015). In the current study, the phenotypic correlations between body weight and survival data were -0.837 1 and -0.667 1, respectively, and the genetic correlations between body weight and survival EBVs obtained from the CSL, THRp, and THRl models were 0.020 1, -6.201 1×10⁻⁴, and -3.115 4×10⁻⁴, respectively. The phenotypic correlations were negative and high in magnitude but negative/positive and low for the genetic correlations. Negative genetic correlation between traits might cause offsets in genetic gain. Thus, it is impossible to achieve better breeding results simultaneously for survival under high temperature stress and body weight gain in a selection program. In view of the negative/positive and low genetic correlations between the two traits, strategies to achieve simultaneous improvement need more investigation. Initial cultivation of two new strains followed by hybridization may be worth considering, while another potential strategy may be to try introducing heat tolerant genes from other species using clustered regularly interspaced short palindromic repeats (CRISPR). From the point of view of breeding, the estimated genetic parameters gave the basic information to determine the ideal selection plan to be adopted in the breeding program in order to allow the response to selection. Significant advances, which will improve turbot culture efficiency, are possible using the results of the current study.
5 CONCLUSIONThe heritability values of the survival data from the CSL, THRp, and THRl models could be defined as medium and low levels of heritability. Family selection is a feasible method for genetic improvement of survival under high temperature stress. The phenotypic correlations between body weight and survival were negative and high in magnitude, and the genetic correlations between body weight and survival EBVs from the CSL, THRp and THRl models were negative/positive and low. It is impossible to achieve better breeding results for survival under high temperature stress while simultaneously improving body weight in a selection program. Given the negative/positive and low genetic correlations between the two traits, a breeding method of first cultivating two new strains, followed by hybridization of the two strains may be worth considering. Another potential strategy might be to try introducing heat tolerant genes from other species using CRISPR.
6 DATA AVAILABILITY STATEMENTThe raw data required to reproduce these findings cannot be shared at this time as the data also forms part of an ongoing study.
7 ACKNOWLEDGMENTThe authors are grateful to Yantai Tianyuan Aquatic Limited Corporation, Yantai, China for providing the fish and culture facilities.
Árnason T, Björnsson B, Steinarsson A, Oddgeirsson M. 2009. Effects of temperature and body weight on growth rate and feed conversion ratio in turbot (Scophthalmus maximus). Aquaculture, 295(3-4): 218-225.
DOI:10.1016/j.aquaculture.2009.07.004 |
Beitinger T L, Bennett W A, McCauley R W. 2000. Temperature tolerances of North American freshwater fishes exposed to dynamic changes in temperature. Environmental Biology of Fishes, 58(3): 237-275.
DOI:10.1023/A:1007676325825 |
Campinho M A, Moutou K A, Power D M. 2004. Temperature sensitivity of skeletal ontogeny in Oreochromis mossambicus. Journal of Fish Biology, 65(4): 1 003-1 025.
DOI:10.1111/j.0022-1112.2004.00505.x |
Dominguez M, Takemura A, Tsuchiya M, Nakamura S. 2004. Impact of different environmental factors on the circulating immunoglobulin levels in the Nile tilapia, Oreochromis niloticus. Aquaculture, 241(1-4): 491-500.
DOI:10.1016/j.aquaculture.2004.06.027 |
Encomio V G, Chu F L E. 2005. Seasonal variation of heat shock protein 70 in eastern oysters (Crassostrea virginica) infected with Perkinsus marinus (Dermo). Journal of Shellfish Research, 24(1): 167-175.
DOI:10.2983/0730-8000(2005)24[167:SVOHSP]2.0.CO; 2 |
Fu J J, Shen Y B, Xu X Y, Liu C C, Li J L. 2015. Genetic parameter estimates and genotype by environment interaction analyses for early growth traits in grass carp (Ctenopharyngodon idella). Aquaculture International, 23(6): 1 427-1 441.
DOI:10.1007/s10499-015-9894-7 |
Gao C R, Wang Y G, Ma A J, Zhu J X, Liu X F, Lei J L. 2006. The effects of temperature on growth, survival rate and proteases activities of juvenile turbot (Scophthalmus maximus). Marine Fisheries Research, 27(6): 33-36.
(in Chinese with English abstract) |
Gilmour A R, Gogel B J, Cullis B R, Thompson R.2009.ASReml User Guide Release 3.0.VSN International, Hemel Hempstead, UK.
|
Gitterle T, Ødegård J, Gjerde B, Rye M, Salte R. 2006. Genetic parameters and accuracy of selection for resistance to White Spot Syndrome Virus (WSSV) in Penaeus (Litopenaeus) vannamei using different statistical models. Aquaculture, 251(2-4): 210-218.
DOI:10.1016/j.aquaculture.2005.06.008 |
Huang Z H, Ma A J, Wang X A, Lei J L. 2014. The interaction of temperature, salinity and body weight on growth rate and feed conversion rate in turbot (Scophthalmus maximus). Aquaculture, 432: 237-242.
DOI:10.1016/j.aquaculture.2014.04.013 |
Imsland A K, Schram E, Roth B, Schelvis-Smit R, Kloet K. 2007. Improving growth in juvenile turbot (Scophthalmus maximus Rafinesque) by rearing fish in switched temperature regimes. Aquaculture International, 15(5): 403-407.
DOI:10.1007/s10499-007-9099-9 |
Johns D M. 1981. Physiological studies on Cancer irroratus larvae.Ⅰ.Effects of temperature and salinity on survival, development rate and size. Marine Ecology Progress Series, 5: 75-83.
DOI:10.3354/meps005075 |
Larsson S, Berglund I. 2005. The effect of temperature on the energetic growth efficiency of Arctic charr (Salvelinus alpinus L.) from four Swedish populations. Journal of Thermal Biology, 30(1): 29-36.
DOI:10.1016/j.jtherbio.2004.06.001 |
Liu B S, Zhang T S, Kong J, Wang Q Y, Luan S, Cao B X. 2011. Estimation of genetic parameters for growth and upper thermal tolerance traits in turbot Scophthalmus maximus. Journal of Fisheries of China, 35(11): 1 601-1 606.
(in Chinese with English abstract) |
Liu F, Li Y Z, Wang X X, Liu X F, Xing H F, Wu Y H, Xiu W S, Shao C W, Chen S L. 2016. Estimation of genetic parameters for disease-resistance traits in Cynoglossus semilaevis (Günther, 1873). Journal of Applied Ichthyology, 32(4): 643-651.
DOI:10.1111/jai.13067 |
Ma A J, Huang Z H, Wang X A, Guo L, Lei J L, Yang Z, Qu J B. 2012. The selective breeding of thermal tolerance family and appraisal of performance in turbot Scophthalmus maximus. Oceanologia et Limnologia Sinica, 43(4): 797-804.
(in Chinese with English abstract) |
Ma A J, Wang X A, Huang Z H, Liu Z F, Cui W X, Qu J B. 2018. Estimation of genetic parameters for upper thermal tolerance and growth-related traits in turbot Scophthalmus maximus using the Bayesian method based on Gibbs sampling. Acta Oceanologica Sinica, 37(6): 40-46.
DOI:10.1007/s13131-018-1185-5 |
Nakajima M, Fujisawa K, Taniguchi N. 2009. Estimation of the mode of inheritance of thermal tolerance in the guppy Poecilia reticulata. Fisheries Science, 75(3): 683-687.
DOI:10.1007/s12562-009-0089-x |
Ødegård J, Baranski M, Gjerde B, Gjedrem T. 2011. Methodology for genetic evaluation of disease resistance in aquaculture species: challenges and future prospects. Aquaculture Research, 42(S1): 103-114.
DOI:10.1111/j.1365-2109.2010.02669.x |
Ødegård J, Olesen I, Gjerde B, Klemetsdal G. 2006. Evaluation of statistical models for genetic analysis of challenge test data on furunculosis resistance in Atlantic salmon (Salmo salar): prediction of field survival. Aquaculture, 259(1-4): 116-123.
DOI:10.1016/j.aquaculture.2006.05.034 |
Ødegård J, Olesen I, Gjerde B, Klemetsdal G. 2007. Evaluation of statistical models for genetic analysis of challenge-test data on ISA resistance in Atlantic salmon (Salmo salar): prediction of progeny survival. Aquaculture, 266(1-4): 70-76.
DOI:10.1016/j.aquaculture.2007.02.012 |
Perry G M L, Ferguson M M, Danzmann R G. 2003. Effects of genetic sex and genomic background on epistasis in rainbow trout (Oncorhynchus mykiss). Genetica, 119(1): 35-50.
DOI:10.1023/A:1024493013926 |
Perry G M L, Martyniuk C M, Ferguson M M, Danzmann R G. 2005. Genetic parameters for upper thermal tolerance and growth-related traits in rainbow trout (Oncorhynchus mykiss). Aquaculture, 250(1-2): 120-128.
DOI:10.1016/j.aquaculture.2005.04.042 |
Pess G R, Kiffney P M, Liermann M C, Bennett T R, Anderson J H, Quinn T P. 2011. The Influences of body size, habitat quality, and competition on the movement and survival of juvenile Coho Salmon during the early stages of stream recolonization. Transactions of the American Fisheries Society, 140(4): 883-897.
DOI:10.1080/00028487.2011.587752 |
Purdom C E, Jones A, Lincoln R F. 1972. Cultivation trials with turbot (Scophthalmus maximus). Aquaculture, 1: 213-230.
DOI:10.1016/0044-8486(72)90021-X |
Rye M, Lillevik K M, Gjerde B. 1990. Survival in early life of Atlantic salmon and rainbow trout: estimates of heritabilities and genetic correlations. Aquaculture, 89(3-4): 209-216.
DOI:10.1016/0044-8486(90)90126-8 |
Sun M M, Huang J H, Jiang S G, Yang Q B, Zhou F L, Zhu C Y, Yang L S, Su T F. 2015. Estimates of heritability and genetic correlations for growth-related traits in the tiger prawn Penaeus monodon. Aquaculture Research, 46(6): 1 363-1 368.
DOI:10.1111/are.12290 |
Taylor R S, Kube P D, Muller W J, Elliott N G. 2009. Genetic variation of gross gill pathology and survival of Atlantic salmon (Salmo salar L.) during natural amoebic gill disease challenge. Aquaculture, 294(3-4): 172-179.
DOI:10.1016/j.aquaculture.2009.06.007 |
Thomas C W, Crear B J, Hart P R. 2000. The effect of temperature on survival, growth, feeding and metabolic activity of the southern rock lobster, Jasus edwardsii. Aquaculture, 185(1-2): 73-84.
DOI:10.1016/S0044-8486(99)00341-5 |
Wang X A, Ma A J, Huang Z H, Zhou Z. 2010. Heritability and genetic correlation of survival in turbot (Scophthalmus maximus). Chinese Journal of Oceanology and Limnology, 28(6): 1 200-1 205.
DOI:10.1007/s00343-010-9014-5 |
Wang X A, Ma A J, Ma D Y. 2015. Developmental quantitative genetic analysis of body weights and morphological traits in the turbot, Scophthalmus maximus. Acta Oceanologica Sinica, 34(2): 55-62.
DOI:10.1007/s13131-015-0618-7 |
Wang X A, Ma A J. 2016. Comparison of four nonlinear growth models for effective exploration of growth characteristics of turbot Scophthalmus maximus fish strain. African Journal of Biotechnology, 15(40): 2 251-2 258.
DOI:10.5897/AJB2016.15490 |
Xu L Y, Wang W J, Kong J, Luan S, Hu Y L, Ma Y. 2015. Estimates of heritability and correlation for growth traits of Turbot (Scophthalmus maximus L.) under low temperature conditions. Acta Oceanologica Sinica, 34(2): 63-67.
DOI:10.1007/s13131-015-0616-9 |
Yáñez J M, Bangera R, Lhorente J P, Oyarzún M, Neira R. 2013. Quantitative genetic variation of resistance against Piscirickettsia salmonis in Atlantic salmon (Salmo salar). Aquaculture, 414-415: 155-159.
DOI:10.1016/j.aquaculture.2013.08.009 |
Zhang T S, Kong J, Liu B S, Wang QY, Cao BX, Luan S, Wang WJ. 2014. Genetic parameter estimation for juvenile growth and upper thermal tolerance in turbot (Scophthalmus maximus Linnaeus). Acta Oceanologica Sinica, 33(8): 106-110.
DOI:10.1007/s13131-014-0460-3 |