 2020, Vol. 38
Institute of Oceanology, Chinese Academy of Sciences
Article Information
- ZHANG Lei, CAI Yanan, JIANG Miao, DAI Jing, GUO Xiyao, LI Wei, LI Yuehong
- The levels of microbial diversity in different water layers of saline Chagan Lake, China
- Journal of Oceanology and Limnology, 38(2): 395-407
- http://dx.doi.org/10.1007/s00343-019-9027-7
Article History
- Received Jan. 30, 2019
- accepted in principle Apr. 8, 2019
- accepted for publication Jun. 19, 2019


2 Biomarker Technologies Co. Ltd., Beijing 100000, China;
3 Department of Clinical Laboratory, China-Japan Union Hospital, Changchun 130000, China
Microbial diversity in aquatic environments plays a significant role and has been a hot topic in recent years. Smith (2007) compared 70 models to explore the relationship between microbial diversity and productivity and found similar changes in microbial ecology and the general science of ecology. Microbial diversity in the environment is the manifestation of life, which is important for the study of evolutionary biology. Previously, many studies have dedicated to developing molecular methods for detecting the diversity of biological microorganisms (Pessi et al., 2016; Venter et al., 2016; Liu et al., 2017), of which some used 16S rRNA gene clone libraries to describe the biodiversity of microbial mats. In aquaculture, microbial diversity has been used to indicate the aquatic environments and productivity. Aquaculture activities significantly affect bacterial function (Kandel et al., 2014; Kobiyama et al., 2018). Therefore, it is very important to analyze microbial diversity to well understand the aquatic environments.
Coman et al. (2013) used the metabarcoding method to sequence and compare 16S rRNA genes on the MiSeq platform (Illumina USA) from DNA and RNA transcripts (cDNA), and explore microbial diversity and physicochemical factors. Physical and chemical factors are important indices to the water quality and nutrient status in aquaculture (Valdebenito et al., 2015), and thus to assess the degree of water pollution/quality in terms of environmental safety (Maloney et al., 2018). Most previous studies focuse on the links between the physical-chemical factors of water environment and the microbial composition/ abundance (Chiriac et al., 2017). However, the interrelationship between these important ecological factors and microbial diversity remain poorly studied.
Unlike those that more thoroughly researched marine and freshwater environments, the microbial ecology of saline lakes is poorly understood. Interest in saline lakes microbiology focused on the separation and characterization of individual microorganisms with potential industrial applications. In this study, we analyzed environmental factors and microbial composition in the Chagan Lake, a typical saline lake in NE China.
Chagan Lake (Fig. 1) is a well-known saline lake in China (salinity range 16 to 52.0 mg/L, pH range 7.35 to 9.40) (Zhu et al., 2012). The lake is distinguished from other lakes by its unique culture. In recent years, fishery has been well developed in the lake, and has become famous for the winter hunting performance on ice in the lake. Saline and alkaline lakes are model systems for studying microbial diversity (Mwirichia et al., 2011). High concentration of carbonate permanganate and high pH are the hallmarks of these lakes (Zhang et al., 2017). Saline lakes are also an unusual environment because of their high concentrations of dissolved organic carbon (COD), dissolved inorganic phosphorus, and bacterial remains. In this study, we studied the microbial diversity of the lake by analyzing the microbial structure of different lake depths and the changes in physical and chemical factors, and provided a theoretical basis for the future development of the saline water.

|
| Fig.1 Location map of Chagan lake in China The area of Chagan Lake is about 480 km2. The maximum water storage is 415 million cubic meters, and the average water depth is 4 m. |
Collecting samples at different locations in the east of the lake, in the middle of the lake and in the west of the lake (124°16'53"E/45°32'52"N, 124°19'18"E/45°31'51"N, 124°18'01"E/45°16'46"N, 124°14'10"E/45°15'29"N, 124°19'06"E/45°11'32"N, and 124°22'37"E/45°13'53"N). Depths of 0.5, 2, and 4 m from the horizontal plane were defined as the high, middle, and low water column, respectively. A submersible pump was used to continuously pump lake water from a given depth (high, middle, and low water column) in a large bucket to facilitate measurement and sampling. The working time of the submersible pump collecting water samples was 60 s but the working time of the measurement was 180s. The following parameters were measured: dissolved oxygen (DO), pH temperature, conductivity, and salinity. Water samples from each location were collected directly into a 1 000-mL sterile vial. There were 18 sampling points in this study (each coordinate point was divided into 3 heights) and 3 replicates were collected from each sampling point. Samples were immediately stored at 4℃. The water samples were used for cations, anions, dissolved, total organic carbon, total P, and total N analyses. Filtered unacidified samples were collected for the analysis of major anions.
2.2 Water sample processing and total DNA extractionThe 1 000 mL water sample was filtered through a 0.22-μm membrane filter and the filter membrane was used for the subsequent DNA extraction as per Paul et al. (2015). The filter was stored in a sterile centrifuge tube, frozen quickly in liquid nitrogen for 3–5 min, and stored immediately at -80℃.
The membrane was then cut out and placed in sterile water to dissolve and microcentrifuged after which precipitate was collected. Total bacterial DNA was obtained from samples using the Power Soil DNA Isolation Kit (MO BIO Laboratories) as per the manufacturer's instructions.
2.3 Preparation of Gene Amplicon LibrariesThe V3–V4 region of the bacterial 16S rRNA gene was amplified with the common primer pair (forward primer 5'-ACTCCTACGGGAGGCAGCA-3'; reverse primer 5'-GGACTACHVGGGTWTCTAAT-3'). PCR amplification was performed in a total volume of 50 μL that contained 10 μL buffer, 0.2 μL Q5 high fidelity DNA polymerase, 10 μL high GC enhancer, 1 μL dNTP, 10 μmol/L of each primer, and 60 ng template DNA. Thermal cycling conditions were: an initial denaturation at 95℃ for 5 min followed by 15 cycles at 95℃ for 1 min 50℃ for 1 min, and 72℃ for 1 min with a final extension at 72℃ for 7 min.
Sixty microliters of Ampure XP magnetic beads were added to the PCR product, left at room temperature for 5 min, and then placed on a magnetic stand. After 5 min, the supernatant was removed, and 200 μL 80% ethanol was utilized to wash the beads. The supernatant was discarded after 30 s at room temperature and the process was repeated. The beads were once again placed on a magnetic stand for 3 min and then resuspended in 37 μL ddH2O and incubated for 2 min at room temperature. Finally, they were dried on a magnetic stand for 2 min and 35 μL of the supernatant was pipetted into a new PCR tube.
A second round of PCR was carried out in a 40 μL reaction containing 20 μL 2×Phusion High-Fidelity master mix, 8 μL ddH2O, 10 μmol/L of each primer, and 10 μL target PCR purification product from the previous step. The PCR amplification was performed with an initial incubation step at 98℃ for 30 s followed by 10 cycles at 98℃ for 10 s, 65℃ for 30 s, and 72℃ for 30 s with a final extension at 72℃ for 5 min. Finally, all PCR products were quantified by Quant-iT™ DsDNA HS Reagent and pooled together. High-throughput sequencing analysis of bacterial rRNA genes was performed on the purified pooled sample using the Illumina Hiseq 2500 platform (2×250 paired ends).
2.4 Data analysisA small fragment library was constructed on the Illumina HiSeq sequencing platform for sequencing using the paired-end method. According to the relationship between paired-end reads and overlap, the double-ended sequence data obtained by HiSeq sequencing are spliced into a sequence of tags and the quality of reads and the effect of merge are quality-controlled and filtered. The reads of each sample were spliced using FLASH v1.2.7 software and the resulting spliced sequence is the raw tags. Trimmomatic v0.33 software was used to filter the spliced raw tags to get high quality tags (clean tags). The chimera sequences were identified and removed using UCHIME v4.2 software to obtain the effective tags. Taxonomy was assigned using the default classifier in QIIME (Greengenes) against the updated Greengenes database at a 97% similarity threshold.
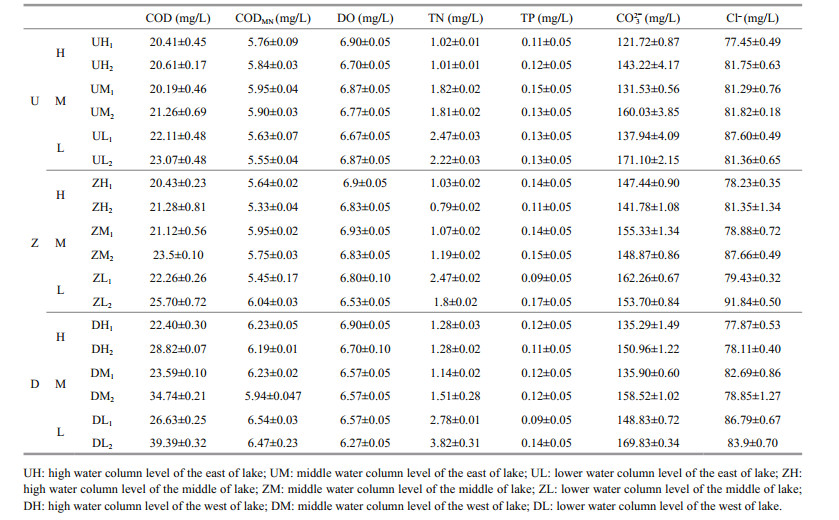
3 RESULT 3.1 Water chemistry of Chagan LakePhysicochemical parameters of water samples were analyzed to understand the physicochemical conditions in these microbial habitats. All samples featured physicochemical parameters typical of a saline lake particularly with respect to pH, salinity, DO, COD, total nitrogen (TN), total phosphorus (TP), CO32-, and chloride (Cl-) content (Table 1).
Fifty-four samples were taken from the east, the middle and the west of Chagan Lake. The samples were sequenced by constructing a small fragment library using the paired-end method on the Illumina HiSeq sequencing platform. The sequence data were classified into operational taxonomic units (OTUs) that were then used for analysis of species composition and abundance. Alpha- and beta-diversity indices were calculated to analyze the differences among samples.
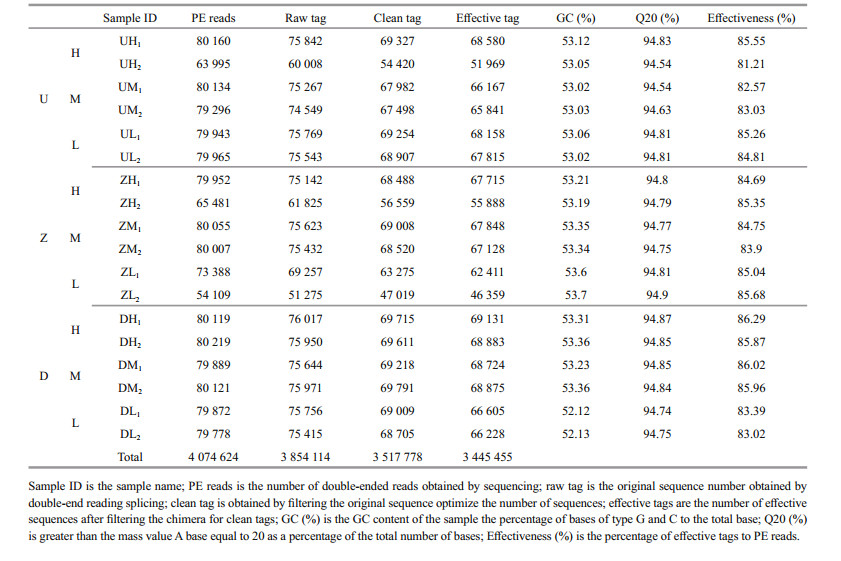
A total of 3 854 114 raw reads corresponding to the exact barcode sequences were generated from the 54 samples. After filtering and optimization, 3 517 778 tags were obtained, and after removing the potential chimera tags, 3 445 455 effective sequences were obtained (Table 2). The GC content and average sample length of the 16S rRNA gene sequencing results as well as the number of Q20 and effective sequence tags are shown in Table 2.
The diversity indices represent richness and balance and have multiple representations: Chao1, Ace, Shannon, and Simpson. Rarefaction values of > 99% indicate that this sequencing presented an adequate representation of the microorganisms in the sample. Chao1 and Ace indices indicate that the richness of species samples in the middle of lake was the highest (P > 0.05). When the high middle and low water columns were compared, the low water column had the highest abundance of species in the whole water environment. Shannon and Simpson indices show that the middle of lake had the highest species diversity ranging from 5.037 4 to 5.362 7, while the west of lake had the lowest ranging from 4.528 2 to 4.707 3, and there were significant differences among the three groups (P < 0.05).
3.3 General characteristics of samplesThe OTU is a classification operational unit for facilitating human analysis to define OTUs in a degree of similarity > 97% between any two sequences, and each OTU corresponds to a representative sequence. Using the UCLUST (Edgar, 2010) in QIIME (version 1.8.0) software to cluster tags at a similarity level of 97% for getting the number of OTUs for each sample. A Venn graph (Chen and Boutros, 2011) was used to show the consistency of OTUs between any two samples.
In the sample of the eastern part of the lake, there were 755 shared OTUs in the high, middle, and low water column levels, and the number of unique OTUs in the low water column level was significantly higher than in the high and middle water column levels (Fig. 2a). Of the two samples in the middle of lake, there were 879 shared OTUs in the high, middle and lower water column levels, and there were 181 OTUs in the low water column level, significantly higher than in the high and middle water column levels (Fig. 2b). In the west of lake samples, differences in microbial diversity among high, middle, and lower water column levels were more pronounced, and the number of unique OTUs in the low water column levels was significantly higher than that in the high and middle water column levels (Fig. 2c). At the same height of the water layer, the microbial species at different sites were also highly diverse. There are 938 shared OTUs at high water levels, and the number of OTUs in the eastern part of the lake is significantly higher than that in the middle of the lake and the western part of the lake (Fig. 2d). In the middle water column level, the microbial diversity in the east, middle and west of the lake was also significant, with 199 unique OTUs in the east (Fig. 2e). In the low water column level (Fig. 2f), the number of unique OTUs in the middle and the west of the lake was also significantly lower than in the eastern part of the lake.

|
| Fig.2 The Venn diagram demonstrating unique and shared OTUs among all the water samples of the Chagan Lake Different samples are shown in different colors. The number of overlapping parts is the number of OTUs shared between two samples. |
Comparing the representative sequence of the OTU with the microbial reference database, the species classification information corresponding to each OTU could be obtained, and then the composition of each sample community could be calculated at each taxonomy level (phylum, class, order, family, genus, and species). A total of 48 bacterial phyla were found in Chagan Lake water samples. The ten most abundant phyla contributed up to 98% of the total bacterial diversity. In terms of the relative abundance, Proteobacteria (35.48%) was the most important phylum, followed by Actinobacteria (21.08%), Bacteroidetes (19.39%), and Cyanobacteria (14.41%). Planctomycetes, Gemmatimonadetes, Verrucomicrobia, Acidobacteria, Saccharibacteria, and Chlorobi made up a relatively small portion of the total diversity. The microbial composition of each sample had some differences at the genus level. Proteobacterium and Acidimicrobium were the most dominant categories in all samples. The Pair-group Method With Arithmetic Mean (PGMA) clustering tree combined with the histogram is shown in Fig. 3. To maximize the view, only the top ten species in the abundance level are displayed. Figure 4 is the heatmap of species abundance for each group of samples at phylum level, recording significant differences in the number of bacteria at phylum level. The corresponding value of the heatmap is the Z-value achieved by normalizing the relative abundance of each species.

|
| Fig.3 The sample clustering tree based on the β-diversity, the histogram of species abundance among samples at genus level, and the top 10 species in species abundance The species diversity, abundance similarity, and dominant species of each sample are compared depending on the proportion of each color block. Each color represents one species, and the length indicates the relative abundance. |

|
| Fig.4 The heatmap showing the sample information (in the horizontal direction), the species information (in the vertical direction), the species cluster tree (left), and the sample cluster tree (top) |
According to the set biomarker screening criteria (LDA score > 4) to find the eligible biomarker (Wang et al., 2012), we compared the significance of difference between any two groups at each taxonomic level. Fifteen groups of bacterial were enriched in the middle water column level of the west of lake, namely, Cyanobacteria, Actinobacteria, Frankiales, Sporichthyaceae, HgcI clade, FamilyI, SubsectionIII, Planktothrix, Saprospiraceae, and uncultured. The bacteria enriched in the high water column of the middle of lake were Sphingobacteriia, Sphingobacteriales, Bacteroidetes Incertae sedis, Deltaproteobacteria, Methylophilales, Methylophilaceae, Chloroplast, and uncultured. The Betaproteobacteria, Alphaproteobacteria, Burkholderiales, Comamonadaceae, Sphingomonadales, Sphingomonadaceae, Novosphingobium, and uncultured were enriched in the low water column level of the east of the lake. A total of 59 different species were examined and shown in Fig. 5a. This article lists only the three groups with the highest abundance. Figure 5b is the Line Discriminant Analysis Effect Size (LEfSe) analysis of evolutionary branching plots with an LDA value greater than 4, which could show the relative content of species with significant differences among groups of different samples; and the figure shows that the DM group and the ZH group had the most diverse species.

|
|
Fig.5
The LEfSe statistic chart comparison
a. LDA SCORE(log 10); b. LEfSe. The circle from the interior to the outside of the evolutionary branch diagram represents the classification level from the gate to the species.Each small circle at a different classification level represents a classification at that level, and the diameter of the small circle is proportional to the relative abundance. The principle of coloring is to color uniformly the species that are not significantly different from yellow, and other differential species were colored according to the highest abundance of the species. The different colors represent different groups, and the nodes of different colors represent the microbial community that plays an important role in the group represented by this color. |
The histogram of analysis of variance (ANOVA) at the genus level, and that of ANOVA at the species level are shown in Fig. 6. The species with significant differences among samples at the genus level were Blfdil19, Roseomonas, Limnohabitans, and CL500-3. At the species level Flavobacterium, CL500-3, Methylophilaceae, and Chloroplast were the four most distinct bacteria.

|
| Fig.6 Analysis of variance a. genus level; b. species level. Columns of different colors represent different samples. *: significant difference (P < 0.05); **: extremely significant difference (P < 0.01). |
This molecular survey provides new insights into structure and composition of indigenous microbial communities within the saline Chagan Lake ecosystem. Physicochemical analyses of water samples demonstrated that Chagan Lake has comparable characteristics to other hypersaline lake ecosystem, based primarily on physicochemical factors such as pH, salinity, COD, concentrations of CO23- and Cl- that influencing the microbial community in water environment (Wani et al., 2006; Jiang and Shen, 2007; Joshi et al., 2008; Valdespino-Castillo et al., 2014). Despite such extreme alkaline and saline conditions in this lake, abundant microbial communities are always found. As shown in Fig. 3, the DL group is closer to ZM group in the clustering tree, while the other two samples in the west of lake are more closely related to DM and DH groups. In the ZM and DL groups, the Flavobacterium content was relatively high, while it was relatively small in the DH and DM groups, so perhaps the difference in Flavobacterium content determined that the DL group of the same locus is more similar to the ZM group in the clustering tree. It can be seen that the abundance of Synechococcus in the samples in the eastern and western parts of the lake is higher, while the content of Synechococcus in the middle of lake was low. It might be due to that the content of Synechococcus leads to the clustering of the samples in the eastern and western parts of the lake in the phylogenetic tree.
Our results are consistent with previous studies, showing that Proteobacteria and CFB bacteria are commonly observed in water and sediments from other soda lakes. The plankton, fish, and shrimp, which are rich in a lake environment, can produce ample metabolic waste. A series of chemical reactions occur during the long-term accumulation of lake sediments and particularly in a saline-alkali environment and some pathogenic bacteria might be enriched during this process.
A large number of such bacteria have been previously reported in various alkaline lakes (Jiang et al., 2006; Roske et al., 2012). Along with Proteobacteria, the presence of other Candidate divisions (namely Comamonadaceae), unclassified, and uncultured in Chagan Lake might indicate a significant role of these groups in this lake ecosystem. Proteobacteria was the most abundant among all and their abundance decreased in deeper water column.
Macrogenomics studies have emphasized the importance of microbial communities in nutrient cycling and biochemical degradation in aquatic ecosystems (Wobus et al., 2003; Khandeparker et al., 2017). Culture-based studies of specific microorganisms often conclude that the concentration of sediment in aquatic environments is higher than that of aquatic microorganisms. Perkins et al. (2014) showed that sediments contain more nutrients than water columns, whereas the bottom water is the closest to the sediments of the water, so the nutrients in water sediments might be affected by bottom water. Sediments have the most abundant and unique OTUs and might contain many human pathogens (Abia et al., 2015). The results of this study show that the low water column level contained the most unique and abundant OTUs among other levels of water column, indicating that sediment are continuously contaminated in bottom water by feed leftover and other contaminants (Jia et al., 2015). Thus, the bottom water can be used to indicate the quality of sediment. In practice, the collection and inspection of the water body is easier than that of sediment. It is simpler and more effective to infer the quality of the water sediment by checking the bottom water but the sediment.
In this study, the OTUs and the sequence data were consistent and showed changes in microbial community with depth. It is apparent that the geochemical gradients in Chagan Lake water samples contribute to the overall microbial structure of the lake. There were higher bacterial diversity/OTUs in Chagan Lake low water column than that of the high water column, thus bearing a clear influence on the activities of the indigenous microbial communities of the lake ecosystem. Data in Table 2 show that the sequencing coverage was sufficient and the data was statistically supported.
The mean values of genes level and species level diversity of the samples were significantly different (Fig. 6). In the case of the same species abundance, the better the uniformity of each species in community, the greater the diversity of the community. As the middle of the lake site had the highest abundance of distinct species, the number of indicator species distributed in various levels in the water was the largest too, among which Betaproteobacteria, Alphaproteobacteria, and Cyanobacteria were the main members in the class level. Many studies have shown that the abundance of Cyanobacteria is associated with the salinity of lakes (Al-Thukair et al., 2007; Wu et al., 2009; Abed et al., 2012). However, in a recent study by Korlević et al. (2016), the salinity content was significantly correlated with the abundance of Cyanobacteria in the aquatic environment, but the correlation is weakly positive.
At the phylum level, the abundance of Alphaproteobacteria and Betaproteobacteria at different sites was significantly different. Proteobacteria is the richest and largest bacterial phylum among all samples, but they show different trends at different water levels. TheAlphaproteobacteria and Betaproteobacteria in freshwater and saline water environments have been widely reported (Berry et al., 2006; Hahn, 2006; Roske et al., 2012), in which pH and nutrients have been interpreted relative to their abundance (Newton et al., 2011). In contrast, differential bacteria in the middle of the lake water were mainly Acidimicrobiia and Gammaproteobacteria (at the class level), and the middle of the lake water featured the highest bacterial diversity among all the lake waters, which is different from recent reports of microbial diversity in a river network (Besemer et al., 2013). We believe that the unique microbial diversity in the middle of the lake water is related to its high primary productivity and clean water sources. For example, Chloroflexaceae, Subsection I, and Burkholderiales are markedly enriched in the middle of the lake environment. In addition, many plankton, such as Chlorophyta and Bacillariophyta, are also enriched in there. Therefore, the middle of the lake water environment is highly productive, and played an important role in maintaining nutrient concentration in the environment and good water quality.
5 CONCLUSIONAbove all, the number of microorganisms in multiple sites is significantly different due to various relevant factors in recent reports (Casamayor et al., 2000; Sogin et al., 2006). Differently, we used high-throughput sequencing method to compare microbial species in very detail. The highest diversity was found in the middle sites of the lake and the lowest diversity in the west of the lake, which was dominated by Cyanobacteria and Bacteroidetes and was related to physicochemical factors.
Meanwhile, there are significant differences in the types and contents of microorganisms in different locations of Chagan Lake, which demands for more studies in the future. Additional to physical and chemical factors, other factors, such as cultured species, and seasonal or climate changes shall be considered.
6 DATA AVAILABILITY STATEMENTThe data that support the findings of this study are available from the corresponding author upon reasonable request.
Abed R M M, Ramette A, Hübner V, De Deckker P, De Beer D. 2012. Microbial diversity of eolian dust sources from saline lake sediments and biological soil crusts in arid Southern Australia. FEMS Microbiology Ecology, 80(2): 294-304.
|
Abia A L K, Ubomba-Jaswa E, Momba M N B. 2015. Impact of seasonal variation on Escherichia coli concentrations in the riverbed sediments in the Apies River, South Africa. Science of the Total Environment, 537: 462-469.
DOI:10.1016/j.scitotenv.2015.07.132 |
Al-Thukair A A, Abed R M M, Mohamed L. 2007. Microbial community of cyanobacteria mats in the intertidal zone of oil-polluted coast of Saudi Arabia. Marine Pollution Bulletin, 54(2): 173-179.
|
Berry D, Xi C W, Raskin L. 2006. Microbial ecology of drinking water distribution systems. Current Opinion in Biotechnology, 17(3): 297-302.
DOI:10.1016/j.copbio.2006.05.007 |
Besemer K, Singer G, Quince C, Bertuzzo E, Sloan W, Battin T J. 2013. Headwaters are critical reservoirs of microbial diversity for fluvial networks. Proceedings of the Royal Society B: Biological Sciences, 280(1771): 20131760.
DOI:10.1098/rspb.2013.1760 |
Casamayor E O, Schäfer H, Bañeras L, Pedrós-Alió C, Muyzer G. 2000. Identification of and spatio-temporal differences between microbial assemblages from two neighboring sulfurous lakes: comparison by microscopy and denaturing gradient gel electrophoresis. Applied and Environmental Microbiology, 66(2): 499-508.
DOI:10.1128/AEM.66.2.499-508.2000 |
Chen H B, Boutros P C. 2011. VennDiagram: a package for the generation of highly-customizable Venn and Euler diagrams in R. BMC Bioinformatics, 12: 35.
DOI:10.1186/1471-2105-12-35 |
Chiriac C M, Szekeres E, Rudi K, Baricz A, Hegedus A, Dragoş N, Coman C. 2017. Differences in temperature and water chemistry shape distinct diversity patterns in thermophilic microbial communities. Applied and Environmental Microbiology, 83(21): e01363-17.
|
Coman C, Drugă B, Hegedus A, Sicora C, Dragos N. 2013. Archaeal and bacterial diversity in two hot spring microbial mats from a geothermal region in Romania. Extremophiles, 17(3): 523-534.
DOI:10.1007/s00792-013-0537-5 |
Edgar R C. 2010. Search and clustering orders of magnitude faster than BLAST. Bioinformatics, 26(19): 2 460-2 461.
DOI:10.1093/bioinformatics/btq461 |
Hahn M W. 2006. The microbial diversity of inland waters. Current Opinion in Biotechnology, 17(3): 256-261.
DOI:10.1016/j.copbio.2006.05.006 |
Jia B Y, Tang Y, Tian L Y, Franz L, Alewell C, Huang J H. 2015. Impact of fish farming on phosphorus in reservoir sediments. Scientific Reports, 5: 16 617.
DOI:10.1038/srep16617 |
Jiang H C, Dong H L, Zhang G X, Yu B S, Chapman L R, Fields M W. 2006. Microbial diversity in water and sediment of Lake Chaka, an athalassohaline lake in northwestern China. Applied and Environmental Microbiology, 72(6): 3 832-3 845.
DOI:10.1128/AEM.02869-05 |
Jiang J G, Shen Y F. 2007. Development of the microbial communities in Lake Donghu in relation to water quality. Environmental Monitoring and Assessment, 127(1-3): 227-236.
DOI:10.1007/s10661-006-9275-9 |
Joshi A A, Kanekar P P, Kelkar A S, Shouche Y S, Vani A A, Borgave S B, Sarnaik S S. 2008. Cultivable bacterial diversity of alkaline Lonar Lake, India. Microbial Ecology, 55(2): 163-172.
|
Kandel P P, Pasternak Z, Van Rijn J, Nahum O, Jurkevitch E. 2014. Abundance, diversity and seasonal dynamics of predatory bacteria in aquaculture zero discharge systems. FEMS Microbiology Ecology, 89(1): 149-161.
|
Khandeparker L, Kuchi N, Kale D, Anil A C. 2017. Microbial community structure of surface sediments from a tropical estuarine environment using next generation sequencing. Ecological Indicators, 74: 172-181.
DOI:10.1016/j.ecolind.2016.11.023 |
Kobiyama A, Ikeo K, Reza M S, Rashid J, Yamada Y, Ikeda Y, Ikeda D, Mizusawa N, Sato S, Ogata T, Jimbo M, Kudo T, Kaga S, Watanabe S, Naiki K, Kaga Y, Mineta K, Bajic V, Gojobori T, Watabe S. 2018. Metagenome-based diversity analyses suggest a strong locality signal for bacterial communities associated with oyster aquaculture farms in Ofunato Bay. Gene, (665): 149-154.
|
Korlević M, Šupraha L, Ljubešić Z, Henderiks J, Ciglenečki I, Dautović J, Orlić S. 2016. Bacterial diversity across a highly stratified ecosystem: A salt-wedge Mediterranean estuary. Systematic and Applied Microbiology, 39(6): 398-408.
DOI:10.1016/j.syapm.2016.06.006 |
Liu T F, Jia T Z, Chen J N, Liu X Y, Zhao M J, Liu P P. 2017. Analysis of microbial diversity in Shenqu with different fermentation times by PCR-DGGE. Brazilian Journal of Microbiology, 48(2): 246-250.
DOI:10.1016/j.bjm.2017.01.002 |
Maloney E M, Liber K, Headley J V, Peru K M, Morrissey C A. 2018. Neonicotinoid insecticide mixtures: Evaluation of laboratory-based toxicity predictions under semi-controlled field conditions. Environmental Pollution, 243: 1 727-1 739.
DOI:10.1016/j.envpol.2018.09.008 |
Mwirichia R, Cousin S, Muigai A W, Boga H I, Stackebrandt E. 2011. Bacterial diversity in the haloalkaline Lake Elmenteita, Kenya. Current Microbiology, 62(1): 209-221.
DOI:10.1007/s00284-010-9692-4 |
Newton R J, Jones S E, Eiler A, McMahon K D, Bertilsson S. 2011. A guide to the natural history of freshwater lake bacteria. Microbiology and Molecular Biology Reviews, 75(1): 14-49.
|
Paul D, Kumbhare S V, Mhatre S S, Chowdhury S P, Shetty S A, Marathe N P, Bhute S, Shouche Y S. 2015. Exploration of microbial diversity and community structure of Lonar Lake: the only hypersaline meteorite crater lake within basalt rock. Frontiers in Microbiology, 6: 1 553.
|
Perkins T L, Clements K, Baas J H, Jago C F, Jones D L, Malham S K, McDonald J E. 2014. Sediment composition influences spatial variation in the abundance of human pathogen indicator bacteria within an estuarine environment. PLoS One, 9(11): e112951.
DOI:10.1371/journal.pone.0112951 |
Pessi I S, Maalouf P D C, Laughinghouse IV H D, Baurain D, Wilmotte A. 2016. On the use of high-throughput sequencing for the study of cyanobacterial diversity in Antarctic aquatic mats. Journal of Phycology, 52(3): 356-368.
DOI:10.1111/jpy.12399 |
Roske K, Sachse R, Scheerer C, Röske I. 2012. Microbial diversity and composition of the sediment in the drinking water reservoir Saidenbach (Saxonia, Germany). Systematic and Applied Microbiology, 35(1): 35-44.
DOI:10.1016/j.syapm.2011.09.002 |
Smith V H. 2007. Microbial diversity-productivity relationships in aquatic ecosystems. FEMS Microbiology Ecology, 62(2): 181-186.
DOI:10.1111/j.1574-6941.2007.00381.x |
Sogin M L, Morrison H G, Huber J A, Welch D M, Huse S M, Neal P R, Arrieta J M, Herndl G J. 2006. Microbial diversity in the deep sea and the underexplored "rare biosphere". Proceedings of the National Academy of Sciences of the United States of America, 103(32): 12 115-12 120.
DOI:10.1073/pnas.0605127103 |
Valdebenito I I, Gallegos P C, Effer B R. 2015. Gamete quality in fish: evaluation parameters and determining factors. Zygote, 23(2): 177-197.
DOI:10.1017/S0967199413000506 |
Valdespino-Castillo P M, Alcantara-Hernandez R J, Alcocer J, Merino-Ibarra M, Macek M, Falcón L I. 2014. Alkaline phosphatases in microbialites and bacterioplankton from Alchichica soda lake, Mexico. FEMS Microbiology Ecology, 90(2): 504-519.
|
Venter Z S, Jacobs K, Hawkins H J. 2016. The impact of crop rotation on soil microbial diversity: A meta-analysis. Pedobiologia, 59(4): 215-223.
DOI:10.1016/j.pedobi.2016.04.001 |
Wang Y, Sheng H F, He Y, Wu J Y, Jiang Y X, Tam N F, Zhou H W. 2012. Comparison of the levels of bacterial diversity in freshwater, intertidal wetland, and marine sediments by using millions of Illumina tags. Applied and Environmental Microbiology, 78(23): 8 264-8 271.
DOI:10.1128/AEM.01821-12 |
Wani A A, Surakasi V P, Siddharth J, Raghavan R G, Patole M S, Ranade D, Shouche Y S. 2006. Molecular analyses of microbial diversity associated with the Lonar soda lake in India: an impact crater in a basalt area. Research in Microbiology, 157(10): 928-937.
DOI:10.1016/j.resmic.2006.08.005 |
Wobus A, Bleul C, Maassen S, Scheerer C, Schuppler M, Jacobs E, Röske I. 2003. Microbial diversity and functional characterization of sediments from reservoirs of different trophic state. FEMS Microbiology Ecology, 46(3): 331-347.
DOI:10.1016/S0168-6496(03)00249-6 |
Wu Q L, Chatzinotas A, Wang J J, Boenigk J. 2009. Genetic diversity of eukaryotic plankton assemblages in Eastern Tibetan Lakes differing by their salinity and altitude. Microbial Ecology, 58(3): 569-581.
DOI:10.1007/s00248-009-9526-8 |
Zhang L, Hipsey M R, Zhang G X, Busch B, Li H Y. 2017. Simulation of multiple water source ecological replenishment for Chagan Lake based on coupled hydrodynamic and water quality models. Water Science and Technology: Water Supply, 17(6): 1 774-1 784.
DOI:10.2166/ws.2017.079 |
Zhu L L, Yan B X, Wang L X, Pan X F. 2012. Mercury concentration in the muscle of seven fish species from Chagan Lake, Northeast China. Environmental Monitoring and Assessment, 184(3): 1 299-1 310.
DOI:10.1007/s10661-011-2041-7 |