 2020, Vol. 38
Institute of Oceanology, Chinese Academy of Sciences
Article Information
- LIU Xiaodan, GAO Xiaojian, CHEN Nan, ZHANG Yingying, LI Xixi, ZHANG Yue, ZHANG Xiaojun
- Transcriptional responses to starvation of pathogenic Vibrio harveyi strain DY1
- Journal of Oceanology and Limnology, 38(2): 579-587
- http://dx.doi.org/10.1007/s00343-019-8350-3
Article History
- Received Jan. 4, 2019
- accepted in principle Apr. 28, 2019
- accepted for publication Jul. 16, 2019


Vibrio harveyi is a facultatively anaerobic, bioluminescent, and Gram-negative rod-shaped bacterium (Johnson and Shunk, 1936). Bacterial infection causes serious vibriosis in marine fish and invertebrates (Austin and Zhang, 2006), particularly in juvenile populations (Pujalte et al., 2003), leading to massive deaths and major economic losses in aquaculture. V. harveyi has been isolated from multiple sources including common snook (Centropomus undecimalis) in USA (Kraxberger-Beatty et al., 1990), silvery black porgy (Acanthopagrus cuvieri) and cultured brown spotted grouper (Epinepelus tauvina) in Kuwait (Saeed, 1995), and sunfish (Mola mola) in Spain (Hispano et al., 1997). V. harveyi-associated diseases are major constraint on the production of marine invertebrates, particularly in South America and Asia. V. harveyi infections have also been reported in common dentex (Dentex dentex L.) (Company et al., 1999), salmonids (Salmo salar L.) (Zhang and Austin, 2000), seahorse (Hippocampus kuda) (Alcaide et al., 2010), farmed sole (Solea senegalensis) (Zorrilla et al., 2003), summer flounder (Paralichthys dentatus) (Gauger et al., 2006), and gilthead sea bream (Sparus aurata) (Haldar et al., 2010). In addition, V. harveyi has been isolated from several crustacean larvae, including black tiger prawn (Penaeus monodon) (Lavilla-Pitogo et al., 1990), kuruma prawns (Penaeus japonicas) (Liu et al., 1996), rock lobster (Jasus verreauxi) (Diggles et al., 2000), and oysters (Ortigosa et al., 1994). Infected animals became inappetent and developed inflammation and necrotic subdermal cysts in various species of fishes, such as crustaceans and mollusks (Austin, 2010).
Bacteria could enter viable but non-culturable (VBNC) or normal dormant state by a variety of environmental stresses (Wolf and Oliver, 1992; Biosca et al., 1996; Jiang and Chai, 1996). Moreover, nutrient deficiency is the most common environmental stress in natural ecosystems for microorganisms. It is reported that some species could survive for a long time in response to starvation condition such as V. harveyi, V. cholerae, V. fischeri, V. anguillarum, V. campbellii, V. mimicus, V. proteolyticus, V. vulnificus (Jiang and Chai, 1996; McDougald et al., 1998). Like other bacterial species, V. harveyi may be chronically exposed to nutrient-poor waters and its ability to survive in water for extended periods of time is an adaptive strategy against stress. Imaging showed that starved cells alter their morphology from rod to spherule cells (Novitsky and Morita, 1976; Sun et al., 2016). Starved cells will adjust their gene expression to adapt to environmental stress, with potential changes to transcriptional regulators, heat shock proteins, virulence regulators, and genes related to metabolism. However, little is known about gene expression profiles under starvation stress.
Hence, we obtained whole transcriptomic profiles of V. harveyi DY1 strain under starvation stress by high-throughput sequencing and determined the gene expression changes compared to non-starved cells. This is the first comprehensive transcriptomic analysis of starvation effects in pathogenic V. harveyi, and the results greatly strengthen our understanding of the molecular pathogenic and transmission mechanisms of V. harveyi strain DY1.
2 MATERIAL AND METHOD 2.1 Bacterial strainThe V. harveyi DY1 strain was first isolated from cultured megalopa of swimming crab (Portunus trituberculatus) in 2011 by Zhang et al. (2014) in Jiangsu, China. DY1 strain was recovered from -80℃ as glycerol stocks and incubated with LB broth (Hopebio Qingdao, China) at 28℃ overnight with shaking.
2.2 Starvation stress and cell enumerationOvernight cultures were diluted (1:100) with fresh LB broth and grown to the mid-log phase at 28℃. Cultures were collected by centrifugation at 12 000×g for 10 min. The pellets were washed twice with sterile artificial seawater to rinse nutrients off and suspended in the starvation regimes. Then the cells in triplicate were placed in Erlenmeyer flasks containing 100 mL sterile artificial seawater to give a final concentration of 108 CFU/mL. Cells were incubated in the dark at 25℃ and monitored for a period of four weeks according to the previous method. Cells in starvation regimes were sampled at 1, 7, 14, 21, and 28 days and counted by plate count method (Sun et al., 2016). The cell number was counted and converted to base-10 logarithms to fit normal distribution model.
2.3 Morphology analysisThe morphology changes of V. harveyi DY1 strain after four weeks of starvation was observed by SEM as previously described (Arias et al., 2012). The nonstarved and starved cells were centrifuged at 10 000×g for 10 min at 4℃. The pellets were washed with PBS, and fixed with glutaraldehyde (0.25 g/L). A graded ethanol series was used to dehydrate the samples, then coated with gold palladium alloy in an Electron Microscopy Science (EMS 550X), and examined by Zeiss EVO 50 (Zeiss, Germany).
2.4 Library construction and Illumina sequencingCells starved for four weeks and the non-starved cells were subjected to total RNA isolation and cDNA preparations. Three independent trials were performed for sequencing. Total RNA was extracted from cells using the EasyPure RNA kit (TransGen Biotech, Beijing, China). rRNA was removed after total RNA was collected from prokaryocyte. Fragmentation buffer was added for splitting mRNA to short fragments. Taking these short fragments as templates, random hexamer-primer were used to synthesize the first-strand cDNA and the second-strand cDNA was synthesized using buffer, RNase H, dNTPs, DNA polymerase I. Short fragments were purified with QiaQuick PCR extraction kit and resolved with elution buffer for end reparation and adding poly (A). After that, the short fragments were connected with sequencing adapters and the UNG enzyme was used to degrade the second-strand cDNA, and the product was purified by MiniElute PCR purification kit before PCR amplification. At last, the library was sequenced using Illumina HiSeq2000. Images generated by sequencers were converted by base calling into nucleotide sequences, which were called raw data or raw reads and are stored in FASTQ format. Raw reads produced from sequencing machines contain dirty reads that contain adapters, unknown or low quality bases. After removing reads with adaptors and low quality reads, clean reads were obtained. The clean reads were mapped to reference genome and genes sequences respectively using SOAP2 (Li et al., 2009).
2.5 Gene annotation and difference analysisAfter data filtering, we compared the clean reads with the reference genome and sequence which has been deposited at DDBJ/EMBL/GenBank under the accession numbers CP009467.2 and CP009468.1. Gene coverage is the percentage of a gene covered by reads. This value equals to ratio of the number of bases in a gene covered by unique mapping reads to number of total bases in that gene. The threshold of the P-value in multiple tests was determined by setting FDR (false discovery rate) at 0.000 1. The FPKM (fragments per kb per Million reads) method was applied to calculate gene expression (Mortazavi et al., 2008). To screen the DEGs in DY1 cells potentially related to starvation stress, statistical and analysis of gene expression was applied using fold change > 2 and P≤0.001 as standards.
2.6 Functional annotation and GO/KEGG enrichment analysisFor gene ontology analysis, the alignment results were parsed for assigning GO terms by using Blast2GO software. Gene sequences of V. harveyi DY1 strain were aligned against Gene Ontology database. The calculated P-value went through Bonferroni Correction, taking corrected P≤0.05 as a threshold. GO terms fulfilling this condition are defined as significantly enriched GO terms in DEGs.
KEGG pathway enrichment analysis identifies significantly enriched metabolic pathways or signal transduction pathways in DEGs comparing with the whole genome background. The calculating formula is the same as that in GO analysis.
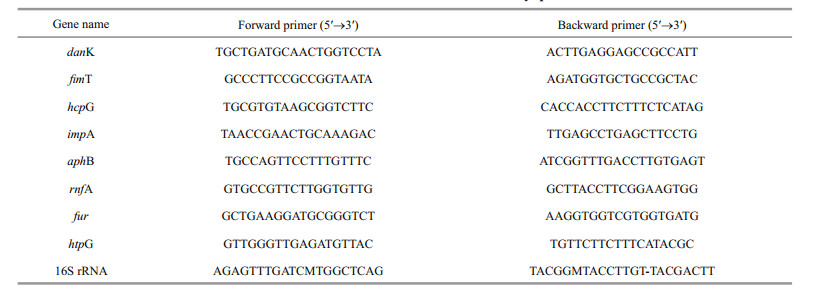
2.7 Quantitative real-time PCR analysisRNA were extracted using an EasyPure RNA kit (TransGen Biotech, Beijing, China) and reversetranscribed by TransScript One-Step gDNA Removal and cDNA Synthesis Supermix (TransGen Biotech, Beijing, China) according to the manufacturer's instructions. The cDNA was synthesized using anchored oligo (dT) 18 primer and incubated for 15 min at 42℃. Real-time PCR was performed with 10 μL SYBR® SuperMix, 1 μL diluted cDNA, 0.4 μL of forward primer, 0.4 μL of reverse primer and 8.2 μL of nuclease-free water. Reactions were incubated at 95℃ for 10 min, followed by 40 cycles of 95℃ for 10 s, 60℃ for 30 s. Each sample was run in triplicate for analysis. The relative gene expression were calculated using 2-ΔΔCt method and16S rRNA gene was chosen as an internal control for normalization. Specific primers were designed according to the corresponding sequences of V. harveyi (Table 1).
The data are presented as the mean±SD (n=3). One-Way Analysis of variance (one-way ANOVA) was used to evaluate the differential expression by SPSS (20.0).
3 RESULT 3.1 Morphology analysisVibrio harveyi was found decreased in size and changed in shape from a rod to a sphere after four weeks of starvation shown in SEM. There was also a significant decrease in size of cells after starvation compared to the initial population (Fig. 1).

|
| Fig.1 SEM micrographs of V. harveyi a. control group; b. starved group. Scale bar=1 μm. |
In this study, RNA-Sequencing was used to study the adaptation of V. harveyi under four-week starvation using Illumina HisSeqTM 2000 system. After filtering the raw data, 14 422 512 and 8 662 506 clean reads were obtained in control and starvation stress group (Table 2). Proportions of clean reads mapped back to genome and genes can provide an overall assessment of the sequencing. The reads were aligned to V. harveyi reference genome using the SOAPaligner/soap2 software and mismatches no more than 5 bases were allowed in the alignment. There were 12 375 624 (85.81%) and 6 846 716 (79.04%) clean reads were mapped to reference genome in control and starvation stress group (Table 2). There were 5 605 402 (38.87%) and 3 477 390 (40.14%) reads and ratio of perfect matches in total mapped reads in the control and starvation stress group (Table 2). There were 5 337 genes annotated in the transcriptome analysis. V. harveyi strain DY1 revealed 4 679 and 4 661 annotated genes before and after starvation stress, respectively.

|
A total of 666 differentially expressed genes (DEGs) were identified in the samples from the fourweek starved group compared to the samples from the untreated group, including 411 down-regulated genes and 255 up-regulated genes (Fig. 2). Thus, about 14.2% of the total number of genes showed significantly altered expression levels after starvation stress for four weeks. The up-regulated DEGs included 20 genes with more than 10-fold expression change between the starved group and the untreated group. Similarly, of the down-regulated DEGs, there were four genes with more than 10-fold expression change.

|
| Fig.2 The number of DEGs in control and starvation stress groups The DEGs are the genes that exhibited differential expression. Comparison of the expression levels of genes in the starved group to the expression levels of genes in the samples from the untreated group revealed 255 up-regulated genes and 411 down-regulated genes. |
GO analyses were performed to classify gene functions of V. harveyi under starvation stress. GO analysis of DEGs in V. harveyi after starvation revealed that in the biological process catalogue, the most abundant category of the differentially expressed genes control metabolism. There were 136 upregulated genes assigned metabolic process, such as hydroxyethylthiazole kinase and peptidase. There were 170 downregulated genes assigned metabolic process including hemolysin, oxidoreductase, 6-phosphogluconate dehydrogenase, et al. In cellular component, the top three categories were cell (55 upregulated, 88 down regulated), cell part (53 upregulated, 86 down regulated) and membrane process (51 upregulated, 64 down regulated). In the molecular function catalogue, the most abundant terms of the differential expression gene were catalytic activity, followed by binding and transporter activity process, primarily including cell division protein ZapB, flagellar motor switch protein FliM, sulfur transfer protein TusE and transcriptional regulator (Fig. 3).

|
| Fig.3 GO analysis of differential expression genes between the initial and the four-week starved V. harveyi The x-axis is gene functional classification of GO including three parts: biological process, cellular component, and molecular function, y-axis is the number of genes. |
Expression of some genes plays a significant role in protection against environmental stress. KEGG enrichment analysis was used to identify the most enriched pathways in V. harveyi after starvation stress. In KEGG enrichment, the DEGs were assigned into 120 pathways. The most abundant pathways were metabolic pathways, microbial metabolism in diverse environments and Biosynthesis of secondary metabolites. Flagellar assembly pathway and Butirosin and neomycin biosynthesis pathway were the most representative pathways related to starvation stress (Fig. 4). Moreover, ABC transporters pathway, flagellar assembly pathway, fatty acid metabolism pathway, fatty acid degradation pathway, biosynthesis of antibiotics pathway and beta-Lactam resistance pathway also involved many differentially expressed genes.

|
| Fig.4 KEGG pathway enrichment analysis of the DEGs between the initial and the four-week starved V. harveyi The x-axis is the number of genes mapped to the pathways and y-axis is KEGG pathway classification. |
To validate the sequencing results, eight differentially expressed genes (danK, fimT, hcp, impA, aphB, rnfA, fur, htpG) of V. harveyi were randomly selected for qRT-PCR. Among these genes, four genes (danK, fimT, impA, aphB) are up-regulated genes and the other four (hcp, rnfA, fur, htpG) are down-regulated genes. The cell samples that subjected for qRT-PCR are the same as those used for transcriptome sequencing. The expression profile of these DEGs are similar to those obtained in sequencing results (Fig. 5).

|
| Fig.5 Verification of the differentially expressed genes of V. harveyi before and after starvation stress by RNASeq and qRT-PCR danK: molecular chaperone DnaK; fimT: fimbrial biogenesis protein FimT; impA: type VI secretion system protein ImpA; aphB: LysR family transcriptional regulator, transcriptional activator AphB; rnfA: electron transport complex protein RnfA; fur: ferric uptake regulator; hcp: type VI secretion system secreted protein Hcp; htpG: molecular chaperone HtpG. |
High mortality rates in the early stages of the marine fish and invertebrates caused by V. harveyi is one of the most important reasons for economic losses during the production period. However, the survival strategies of V. harveyi in the aquatic environment are not well understood. Microorganisms must adapt to environmental stress to grow and survive (Poindexter, 1981; Kjellerberg et al., 1983; Kunttu et al., 2009). Previous studies showed that the most widespread environmental stress for microbes in a natural environment is a lack of nutrients (Wai et al., 1999; Vatsos et al., 2003; Suzina et al., 2004; Montánchez et al., 2014; Kaberdin et al., 2015; Parada et al., 2016; Montánchez et al., 2019). To study the physiological response and the long-term survival mechanism upon starvation stress is urgent and important.
In this study, we compared the size of the starved cells with cells from the control group, and observed that the starved cells were obviously shorter (Fig. 1). This implied that V. harveyi likely triggered specific regulatory mechanisms to adjust its shape and size. This result was previously reported (Sun et al., 2016). Parada et al. (2016) found that morphological change was not directly related to the entry of cells into the VBNC state, although they observed a gradual decrease in the size of V. harveyi cells during incubation. Montánchez et al. (2014) found that incubation in cold seawater for 12 h did not cause any significant morphological changes in V. harveyi, suggesting that V. harveyi likely elicits specific adaptation mechanisms maintaining its culturability under stress conditions.
The reads were mapped to the reference genome. The gene coverage was above 70% for both groups. The RNA-seq data can be used to assess the variation in expression of virulence-related and metabolismrelated factors in V. harveyi, which suggest the strategies used by these bacteria to survive under starvation conditions. There were 255 up-regulated genes and 411 down-regulated genes under starvation stress, and these genes very likely act in the response to starvation stress (Fig. 2). The analysis shown in Fig. 3 revealed 35 GO categories relevant to starvation stress of V. harveyi. The main terms associated with starvation stress were binding and transporter activity, metabolic process, and cell and catalytic activity. Previous proteomic study revealed that the level of membrane proteins participating in cellular transport, maintenance of cell structure, and bioenergetics processes remained unchanged during starvation at low temperature, suggesting that V. harveyi might need these proteins for long-term survival or for the resuscitation process after dormancy (Parada et al., 2016).
The analysis of KEGG enrichment may help us to understand the molecular mechanisms utilized by V. harveyi for long-term survival under starvation stress. The most abundant KEGG pathways included antibiotic biosynthesis, ABC transporters, butanoate metabolism pathway, starch and sucrose metabolism, and beta lactam resistance pathways, which are processes that have previously been related to starvation stress (Higgins, 2001; Kim et al., 2013; Svensson et al., 2014). Genes related to nutrient transport, such as phospholipids, oligopeptides, and simple sugars, were down-regulated after four weeks starvation. However, genes related to nutrient transfer, such as the phospholipid transfer protein gene and the monosaccharide transporter gene, were significantly up-regulated under starvation stress, representing an active metabolism pathway in V. harveyi. This change may be supplementation sparked by the compensatory response, and changes in the expression of genes controlling biosynthesis of lipids and molecular transport likely affect the composition and properties of the V. harveyi cell envelope, an obvious adaptation to stress. We suspect that V. harveyi comprehensively utilized multiple strategies and adaptation mechanisms to sustain key physiological functions under nutritional stress. At least in part, V. harveyi compensated for the reduced expression of biosynthetic genes by the upregulation of transporter genes controlling the uptake of amino acids (e.g. amino acid ABC transporters). Previous research found that limitation of nutrients leads to the significant downregulation of genes controlling central carbon metabolism, biosynthesis of lipids, amino acids, and nucleotides (Montánchez et al., 2014).
To better understand the survival strategies of V. harveyi under starvation stress, the fatty acid metabolism pathway was analyzed. The genes related with fatty acid synthesis were significantly downregulated and the expression level of fatty acid degradation related genes were significantly increased, producing a large number of acetyl coenzyme A for TCA cycle. The observation of the up-regulation of fatty acid degradation correlates to previous work by Kaberdin et al. (2015). Moreover, the fine-tuning of these metabolic pathways appears to be attained through the action of small regulatory RNAs known for their essential roles in post-transcriptional control of gene expression (Kaberdin and Bläsi, 2006).
Virulence genes played a crucial role in environmental adaptation and virulence. Previous study analyzed V. harveyi adaptation in sea water microcosms at elevated temperature and found that elevated temperature also affected regulation of V. harveyi genes controlling its virulence and ancillary mechanisms (i.e. production and secretion of virulence factors, biofilm formation and motility) (Montánchez et al., 2019). The sequencing analysis revealed downregulated expression levels of virulence regulator gene toxR and flagellin A. These virulence genes regulate a considerable number of genes involved in environmental adaptation and virulence. Other down-regulated genes include flagellinassociated genes, such as flgB, flgC, flgD, flgF, flgG, flgH, flgI, flgK, flgL, fliM, and fliO. Down-regulation of flagellin-associated genes will directly reduce flagellar synthesis of V. harveyi, resulting in reduced motility and adhesive strength, which may be critical during the initials steps of infection. Thus, the pathogenicity may decrease under starvation stress. The decreased expression of flagellin-associated genes suggests that under starvation conditions, V. harveyi reduced energy requirements by reducing the synthesis of non-essential structures.
Under starvation stress, many genes were enriched in metabolic pathways involved in the synthesis of macrolides and ketolide antibiotics (Fig. 4). The sequencing revealed up-regulated expression levels of many genes related to the synthesis of macrolides and ketolides and beta lactam resistance genes, including TolC (outer membrane protein), acrA (membrane fusion protein, multidrug efflux system), and opp (oligopeptide transport system). These resistance-related genes may significantly improve the survival rate of V. harveyi.
5 CONCLUSIONThis study presented the transcriptomic response profiles of the Portunus trituberculatus pathogen V. harveyi strain DY1 under starvation conditions, to elucidate the changes in V. harvey gene expression due to starvation in seawater. V. harveyi may survive under starvation conditions by regulating the expression of virulence and metabolism-related genes. The identified genes may be important highvalue drug targets, suggesting new ways to effectively control clinical infection of V. harveyi. Our findings should facilitate future study on stress adaptation and environmental survival mechanisms of V. harveyi.
6 DATA AVAILABILITY STATEMENTAll sequence data that support the findings of this study have been deposited in the NCBI Short Read. The sequence read archive (SRA) accession number: PRJNA507871.
Alcaide E, Gil-Sanz C, Sanjuán E, Esteve D, Amaro C, Silveira L. 2010. Vibrio harveyi causes disease in seahorse, Hippocampus sp. Journal of Fish Diseases, 24(5): 311-313.
|
Arias C R, LaFrentz S, Cai W L, Olivares-Fuster O. 2012. Adaptive response to starvation in the fish pathogen flavobacterium columnare: cell viability and ultrastructural changes. BMC Microbiology, 12: 266.
DOI:10.1186/1471-2180-12-266 |
Austin B, Zhang X H. 2006. Vibrio harveyi: a significant pathogen of marine vertebrates and invertebrates. Letters in Applied Microbiology, 43(2): 119-124.
|
Austin B. 2010. Vibrios as causal agents of zoonoses. Veterinary Microbiology, 140(3-4): 310-317.
DOI:10.1016/j.vetmic.2009.03.015 |
Biosca E G, Amaro C, Marco-Noales E, Oliver J D. 1996. Effect of low temperature on starvation-survival of the eel pathogen Vibrio vulnificus biotype 2. Applied and Environmental Microbiology, 62(2): 450-455.
DOI:10.1128/AEM.62.2.450-455.1996 |
Company R, Sitj-Bobadilla A, Pujalte M J, Garay E, AlvarezPellitero P. 1999. Bacterial and parasitic pathogens in cultured common dentex, Dentex dentex L. Journal of Fish Diseases, 22(4): 299-309.
|
Diggles B K, Moss G A, Carson J, Anderson C D. 2000. Luminous vibriosis in rock lobster Jasus verreauxi (Decapoda: Palinuridae) phyllosoma larvae associated with infection by Vibrio harveyi. Diseases of Aquatic Organisms, 43(2): 127-137.
|
Gauger E, Smolowitz R, Uhlinger K, Casey J, Gómez-Chiarri M. 2006. Vibrio harveyi and other bacterial pathogens in cultured summer flounder, Paralichthys dentatus. Aquaculture, 260(1-4): 10-20.
DOI:10.1016/j.aquaculture.2006.06.012 |
Haldar S, Maharajan A, Chatterjee S, Hunter S A, Chowdhury N, Hinenoya A, Asakura M, Yamasaki S. 2010. Identification of Vibrio harveyi as a causative bacterium for a tail rot disease of sea bream Sparus aurata from research hatchery in Malta. Microbiological Research, 165(8): 639-648.
DOI:10.1016/j.micres.2009.12.001 |
Higgins C F. 2001. ABC transporters: physiology, structure and mechanism—an overview. Research in Microbiology, 152(3-4): 205-210.
DOI:10.1016/S0923-2508(01)01193-7 |
Hispano C, Nebra Y, Blanch A R. 1997. Isolation of Vibrio harveyi from an ocular lesion in the short sunfish (Mola mola). Bulletin of the European Association of Fish Pathologists, 17(3-4): 104-107.
|
Jiang X, Chai T J. 1996. Survival of Vibrio parahaemolyticus at low temperatures under starvation conditions and subsequent resuscitation of viable, nonculturable cells. Applied and Environmental Microbiology, 62(4): 1 300-1 305.
DOI:10.1128/AEM.62.4.1300-1305.1996 |
Johnson F H, Shunk I V. 1936. An interesting new species of luminous bacteria. Journal of Bacteriology, 31(6): 585-593.
DOI:10.1128/JB.31.6.585-593.1936 |
Kaberdin V R, Bläsi U. 2006. Translation initiation and the fate of bacterial mRNAs. FEMS Microbiology Reviews, 30(6): 967-979.
DOI:10.1111/j.1574-6976.2006.00043.x |
Kaberdin V R, Montánchez I, Parada C, Orruño M, Arana I, Barcina I. 2015. Unveiling the metabolic pathways associated with the adaptive reduction of cell size during vibrio harveyi persistence in seawater microcosms. Microbial Ecology, 70(3): 689-700.
|
Kim C, Mwangi M, Chung M, Milheirço C, De Lencastre H, Tomasz A. 2013. The mechanism of heterogeneous betalactam resistance in MRSA: key role of the stringent stress response. PLoS One, 8(12): e82814.
DOI:10.1371/journal.pone.0082814 |
Kjellerberg S, Humphrey B A, Marshall K C. 1983. Initial phases of starvation and activity of bacteria at surfaces. Applied and Environmental Microbiology, 46(5): 978-984.
DOI:10.1128/AEM.46.5.978-984.1983 |
Kraxberger-Beatty T, McGarey D J, Grier H J, Lim D V. 1990. Vibrio harveyi, an opportunistic pathogen of common snook, Centropomus undecimalis (Bloch), held in captivity. Journal of Fish Diseases, 13(6): 557-560.
DOI:10.1111/j.1365-2761.1990.tb00819.x |
Kunttu H M T, Valtonen E T, Jokinen E I, Suomalainen L R. 2009. Saprophytism of a fish pathogen as a transmission strategy. Epidemics, 1(2): 96-100.
DOI:10.1016/j.epidem.2009.04.003 |
Lavilla-Pitogo C R, Baticados M C L, Cruz-Lacierda E R, de la Pena L D. 1990. Occurrence of luminous bacterial disease of Penaeus monodon larvae in the Philippines. Aquaculture, 91(1-2): 1-13.
DOI:10.1016/0044-8486(90)90173-K |
Li R Q, Yu C, Li Y R, Lam T W, Yiu S M, Kristiansen K, Wang J. 2009. SOAP2: an improved ultrafast tool for short read alignment. Bioinformatics, 25(15): 1 966-1 967.
DOI:10.1093/bioinformatics/btp336 |
Liu P C, Lee K K, Yii K C, Kou G H, Chen S N. 1996. News & Notes: isolation of Vibrio harveyi from diseased kuruma prawns Penaeus japonicus. Current Microbiology, 33(2): 129-132.
DOI:10.1007/s002849900087 |
McDougald D, Rice S A, Weichart D, Kjelleberg S. 1998. Nonculturability: adaptation or debilitation?. FEMS Microbiology Ecology, 25(1): 1-9.
|
Montánchez I, Arana I, Parada C, Garaizabal I, Orruño M, Barcina I, Kaberdin V R. 2014. Reprogramming of Vibrio harveyi gene expression during adaptation in cold seawater. FEMS Microbiology Ecology, 87(1): 193-203.
|
Montánchez I, Ogayar E, Plágaro A H, Esteve-Codina A, Gómez-Garrido J, Orruño M, Arana I, Kaberdin V R. 2019. Analysis of Vibrio harveyi adaptation in sea water microcosms at elevated temperature provides insights into the putative mechanisms of its persistence and spread in the time of global warming. Scientific Reports, 9(1): 289.
DOI:10.1038/s41598-018-36483-0 |
Mortazavi A, Williams B A, McCue K, Schaeffer L, Wold B. 2008. Mapping and quantifying mammalian transcriptomes by RNA-Seq. Nature Methods, 5(7): 621-628.
DOI:10.1038/nmeth.1226 |
Novitsky J A, Morita R Y. 1976. Morphological characterization of small cells resulting from nutrient starvation of a psychrophilic marine vibrio. Applied and Environmental Microbiolog, 32(4): 617-622.
DOI:10.1128/AEM.32.4.617-622.1976 |
Ortigosa M, Garay E, Pujalte M J. 1994. Numerical taxonomy of Vibrionaceae isolated from oysters and seawater along an annual cycle. Systematic and Applied Microbiology, 17(2): 216-225.
DOI:10.1016/S0723-2020(11)80011-1 |
Parada C, Orruño M, Kaberdin V, Bravo Z, Barcina I, Arana I. 2016. Changes in the Vibrio harveyi cell envelope subproteome during permanence in cold seawater. Microbial Ecology, 72(3): 549-558.
DOI:10.1007/s00248-016-0802-0 |
Poindexter J S. 1981. Oligotrophy: fast and famine existence. In: Alexander M ed. Advances in Microbial Ecology. Springer, Boston, MA. p.63-89.
|
Pujalte M J, Sitjà-Bobadilla A, Macián M C, Belloch C, Álvarez-Pellitero P, Pérez-Sánchez J, Uruburu F, Garay E. 2003. Virulence and molecular typing of Vibrio harveyi strains isolated from cultured dentex, gilthead sea bream and European sea bass. Systematic and Applied Microbiology, 26(2): 284-292.
DOI:10.1078/072320203322346146 |
Saeed M O. 1995. Association of Vibrio harveyi with mortalities in cultured marine fish in Kuwait. Aquaculture, 136(1-2): 21-29.
DOI:10.1016/0044-8486(95)01045-9 |
Sun J J, Gao X J, Qun J, Du X D, Bi K R, Zhang X J, Lin L. 2016. Comparative analysis of the survival and gene expression of pathogenic strains Vibrio harveyi after starvation. FEMS Microbiology Letters, 363(22): fnw250.
DOI:10.1093/femsle/fnw250 |
Suzina N E, Mulyukin A L, Kozlova A N, Shorokhova A P, Dmitriev V V, Barinova E S, Mokhova O N, El'-Registan G I, Duda V I. 2004. Ultrastructure of resting cells of some non-spore-forming bacteria. Microbiology, 73(4): 435-447.
DOI:10.1023/B:MICI.0000036990.94039.af |
Svensson S L, Pryjma M, Gaynor E C. 2014. Flagella-mediated adhesion and extracellular DNA release contribute to biofilm formation and stress tolerance of Campylobacter jejuni. PLoS One, 9(8): e106063.
DOI:10.1371/journal.pone.0106063 |
Vatsos I N, Thompson K D, Adams A. 2003. Starvation of Flavobacterium psychrophilum in broth, stream water and distilled water. Diseases of Aquatic Organisms, 56(2): 115-126.
|
Wai S N, Mizunoe Y, Yoshida S I. 1999. How Vibrio cholerae survive during starvation. FEMS Microbiology Letters, 180(2): 123-131.
DOI:10.1111/j.1574-6968.1999.tb08786.x |
Wolf P W, Oliver J D. 1992. Temperature effects on the viable but non-culturable state of Vibrio vulnificus. FEMS Microbiology Letters, 101(1): 33-39.
|
Zhang X H, Austin B. 2000. Pathogenicity of Vibrio harveyi to salmonids. Journal of Fish Diseases, 23(2): 93-102.
DOI:10.1046/j.1365-2761.2000.00214.x |
Zhang X J, Bai X S, Yan B L, Bi K R, Qin L. 2014. Vibrio harveyi as a causative agent of mass mortalities of megalopa in the seed production of swimming crab Portunus trituberculatus. Aquaculture International, 22(2): 661-672.
DOI:10.1007/s10499-013-9695-9 |
Zorrilla I, Arijo S, Chabrillon M, Diaz P, Martinez-Manzanares E, Balebona M C, Moriñigo M A. 2003. Vibrio species isolated from diseased farmed sole, Solea senegalensis (Kaup), and evaluation of the potential virulence role of their extracellular products. Journal of Fish Diseases, 26(2): 103-108.
DOI:10.1046/j.1365-2761.2003.00437.x |