 2020, Vol. 38
Institute of Oceanology, Chinese Academy of Sciences
Article Information
- GUO Chaonan, SUN Chengjun, YANG Guipeng, ZHANG Honghai, CHEN Yan, YIN Xiaofei, JIANG Fenghua, HUANG Yuhuan, NIU Jiaohong, DING Haibing
- Vertical variations of dissolved carbohydrates in the North Yap Trench
- Journal of Oceanology and Limnology, 38(3): 606-618
- http://dx.doi.org/10.1007/s00343-020-9018-8
Article History
- Received Jan. 21, 2019
- accepted in principle Aug. 15, 2019
- accepted for publication Feb. 21, 2020


2 Key Laboratory of Marine Eco-environmental Science and Technology, Marine Bioresource and Environment Research Center, First Institute of Oceanography, Ministry of Natural Resources, Qingdao 266061, China;
3 College of Chemistry and Chemical Engineering, Ocean University of China, Qingdao 266100, China;
4 Marine Ecology and Environmental Science Laboratory, Pilot National Laboratory for Marine Science and Technology, Qingdao 266237, China;
5 Qingdao Collaborative Innovation Center of Marine Science and Technology, Qingdao 266100, China
Carbohydrates are important components of marine organic carbon (Hung et al., 2001; Wang et al., 2006, 2013). They are a relatively unstable component in marine environment, which participate in the circulation of marine food chains and play a key role in the metabolism of plankton (Zhang and Fang, 1991). In the marine system, carbohydrates can be converted to other essential biological components, such as proteins, lipids, and nucleic acids (Myklestad and Børsheim, 2007), and can also provide energy for various organisms through different biochemical processes such as respiration (Witter and Luther, 2002). The carbohydrates in seawater are mainly derived from the photosynthesis of phytoplankton (Kerhervé et al., 2002; Thornton, 2014), the excretion of plankton (Burney et al., 1979), bacterial emission (Kawasaki and Benner, 2006), and resuspension of sediments (Arnosti and Holmer, 1999). The exploration of distribution, source, and migration of carbohydrates in the marine environment is significant for studying the cycle of marine organic carbon.
Dissolved carbohydrates occupy a big fraction of marine dissolved organic carbon, including dissolved monosaccharides (MCHO) and polysaccharides (PCHO). Dissolved carbohydrates have been studied in the equatorial Pacific Ocean (Pakulski and Benner, 1994), the Arctic Ocean (Wang et al., 2006), the Indian Ocean (Khodse et al., 2007), the Gulf of Mexico (Hung et al., 2003), various rivers (Hung et al., 2005), and other areas (Witter and Luther, 2002; Myklestad and Børsheim, 2007) for more than 20 years, but little is known on the vertical variations of concentrations of carbohydrates from the sea surface to hadal zone in a trench area.
The Yap Trench is one of the deepest trenches in the world. It is located at the junction of the Philippine Plate, the Pacific Plate, and the Caroline Plate, like a letter "J" in shape. The trench is 650 km long from north to south with the deepest depth 8 527 m, connecting the Mariana Trench in the north and the Palau Trench in the southwest. The Yap Trench has a typical abyssal and hadal environment. In last several decades, the rock composition, water characteristics, geological structure, and evolution of the Yap Trench have been studied (Hawkins and Batiza, 1977; Johnson and Toole, 1993; Sato et al., 1997; Fujiwara et al., 2000; Guo et al., 2018), but few studies focus on its biogeochemical characteristics. This is the first study to investigate biogeochemical characteristics of carbohydrates in the seawater of the Yap Trench, including vertical variation of carbohydrates from sea surface to hadal zone, their source and sink, and controlling factors on their concentrations. This study is of great significance for further understanding the biogeochemical characteristics of carbohydrates in the marine system and providing basic data for studying dissolved organic carbon in the ocean.
2 MATERIAL AND METHOD 2.1 Sampling collection and treatmentSeawater samples were collected in the Yap Trench (Fig. 1). The information of four CTD stations and five Dive stations is shown in Table 1.

|
| Fig.1 Sampling stations map of research area PHS: Philippine Sea Plate; PAC: Pacific Plate; CP: Caroline Plate; MT: Mariana Trench; YT: Yap Trench; PT: Palau Plate; CR: Caroline Ridge; YI: Yap Island. |

In May 2016, the R/V Xiangyanghong 09 equipped with the Jiaolong submersible conducted the No. 37 Cruise of the China Ocean Mineral Resources Research and Development Association in the study area. The seabird CTD sampler amounted in R/V Xiangyanghong 09 collected seawater samples at different water depths of the four CTD stations. The Jiaolong submersible collected five seawater samples at the sediment-seawater interface of the five Dive stations. After sampling collection, 300-mL seawater samples were filtered through Whatman GF/F filters (diameter 47 mm, pore size 0.7 μm, pre-combusted for 5 h at 500℃). The filtered seawater was stored in acid-cleaned glass bottles and immediately frozen at -20℃ freezer for analysis of dissolved carbohydrates.
2.2 Carbohydrates analysisThe concentration of MCHO was measured by the 2, 4, 6-tripyridyl-s-triazine (TPTZ) method (Myklestad et al., 1997). Briefly, 1-mL filtered seawater sample was mixed with 1 mL of 0.7 mmol/L potassium ferrlcyanide solution in an acid cleaned perfluoroalkoxy alkane tube, and then placed in water bath at 100℃ for 10 m. After that, 1 mL of 2.0 mmol/L ferric chloride solution and 2 mL of 2.5 mmol/L TPTZ solution were added immediately and mixed well on a vortex mixer. The absorbance was measured at 596 nm using UVvisible spectrophotometer (UV-2550, Shimadzu Co., Japan). According to the glucose working curve (1-mL glucose standard solution in concentration of 0.00, 0.40, 0.80, 1.20, 1.60, and 2.00 mg/L mixed with 1 mL of basic potassium ferricyanide solution in 100℃ water bath for 10 min, then added 1 mL ferric chloride solution and 2 mL TPTZ solution. The absorbance of the final solution was measured at 596 nm), the concentration of MCHO was determined. This method was used to measure the total dissolved carbohydrate concentration after acid hydrolysis of 4 mL of seawater with HCl (0.4 mL, 1 mol/L) in a sealed ampule at 150℃ for 1 h. The concentration of PCHO was the difference between the concentrations of TCHO and MCHO ([PCHO]=[TCHO]–[MCHO]). The coefficient of variation for this method was 2%–10% and the detection limit was 2.2 μmol/L.
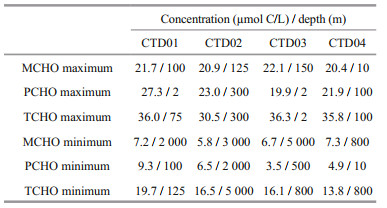
3 RESULT 3.1 Vertical distribution characteristics of dissolved carbohydrates in the Yap TrenchIn the research area, among the four CTD stations, the concentrations of MCHO, PCHO, and TCHO in the seawater samples were in the ranges in μmol C/L of 5.8–22.1, 3.5–27.3, and 13.8–36.3, respectively. The maximum concentrations of MCHO, PCHO, and TCHO appeared at 150 m depth (22.1 μmol C/L) in CTD03 station, at 2 m depth (27.3 μmol C/L) in CTD01 station, and at 2 m depth (36.3 μmol C/L) in CTD03 station, respectively. In addition, their minimum concentrations appeared at 3 000 m depth (5.8 μmol C/L) in CTD02 station, at 500 m depth (3.5 μmol C/L) in CTD03 station and at 800 m depth (13.8 μmol C/L) in CTD04 station, respectively. In each station, the depths with the maximum and minimum concentrations of MCHO, PCHO, and TCHO are listed in Table 2. The vertical variations of concentrations of MCHO, PCHO, and TCHO in the seawater from the sea surface to the abyss in the four CTD stations of the Yap Trench are shown in Fig. 2.
|

|
| Fig.2 Vertical variations of the concentrations of MCHO, PCHO, and TCHO in the sea water from the sea surface to the abyss in the four CTD stations of the Yap Trench and in 0-200 m euphotic zone |
In the four CTD stations, the concentrations of MCHO showed complex variation trends with water depth, especially in euphotic zone. From 200 to 1 000 m mesopelagic seawater, the concentrations fluctuated around 10.0 μmol C/L. In 1 000–4 000 m bathypelagic seawater, the MCHO remained relatively stable. In 4 000–6 000 m abyssal zone, the concentrations of MCHO decreased slightly with water depth, and then increased at the bottom layer.
The concentrations of PCHO varied intricately in euphotic seawater of the four stations. In CTD02 station, the concentrations of PCHO had a decreasing trend with water depth, and the concentrations showed fluctuation at other three stations. In 200–1 000 m mesopelagic seawater, the concentrations of PCHO decreased remarkably just below euphotic layer, and then increased with water depth. In 1 000–4 000 m bathypelagic seawater, the concentrations of PCHO showed fluctuating decreasing trend in all four stations. In abyssal seawater, the concentrations of PCHO tended to decrease with water depth.
3.2 Concentrations of carbohydrates in the five Dive stationsThe concentrations of MCHO, PCHO, and TCHO in seawater of the five Dive stations in the Yap Trench are shown in Fig. 3. Among the five stations, the concentration of MCHO was the highest in Dive109, up to 16.7 μmol C/L, and reached the lowest in Dive110, as low as 4.6 μmol C/L. In the hadal zone of Dive110, 111, 112, 113 stations, the concentrations of MCHO ranged from 4.6 to 9.0 μmol C/L, close to the average concentration of MCHO in the abyssal layer of the four CTD stations. The concentration of PCHO was the highest in Dive113 (in the eastern side of the trench), up to 14.7 μmol C/L, and the concentrations of PCHO of the four stations in the western side of the trench were similar, varied between 5.4 and 9.4 μmol C/L, which were slightly lower than the concentration of PCHO in the abyssal layer. The concentrations of TCHO in Dive109 and 113 were higher, between 20.0 and 25.0 μmol C/L. The values were close to the concentrations of TCHO in the abyssal seawater. The concentration of TCHO in the other stations was lower than the average concentration of TCHO in the abyssal layer of the CTD stations.

|
| Fig.3 Concentrations of MCHO, PCHO, and TCHO in five Dive stations of Yap Trench |
The trend of salinity at the four stations in the study area was relatively consistent (Fig. 4). The salinity in the surface was low, and then increased with water depth. The halocline appeared at the depth range of 100–150 m. Below 200 m, the salinity was reduced first and became stable gradually with water depth. The surface water temperature of the four stations was higher. As the water depth increased, the temperature decreased rapidly (Fig. 4). Below 2 000 m, the temperature was as low as 2℃ and remained relatively stable. The concentrations of dissolved oxygen in the four stations showed similar trend as salinity (Fig. 4). The concentration of dissolved oxygen in surface water was relatively high, and the minimum oxygen zone appeared at 300–1 000 m depth. Below 2 000 m, the dissolved oxygen content slightly with water depth increased. The variation trends of salinity, temperature and concentrations of dissolved oxygen with water depth in the four stations had characteristics of ocean water. In the euphotic layer, the CTD01–03 station had high concentrations of chlorophyll a (chl a) around 100 m (Fig. 4). Overall, CTD04 station had a lower chl a concentrations than the other three stations. At 200 m depth, the concentrations of chl a dropped significantly, approaching zero.

|
| Fig.4 Vertical variation profiles of temperature (T), salinity (S), dissolved oxygen (DO), and chlorophyll a (chl a) in the four CTD stations in Yap trench |
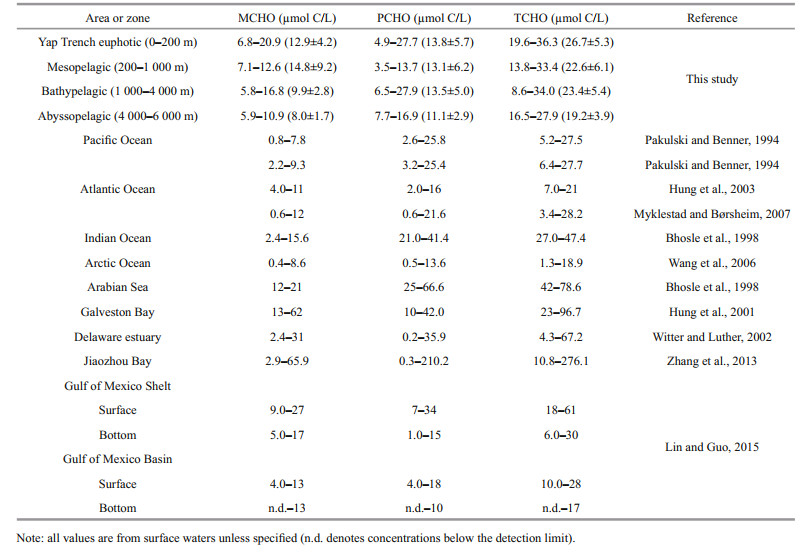
The concentrations ranges of MCHO, PCHO, and TCHO at the four stations of Yap Trench are shown in Table 3. Previous studies have conducted extensive research on dissolved carbohydrates in different oceans, estuaries and bays. The results show that the concentrations ranges of dissolved carbohydrates in the surface of Yap Trench are similar to that of ocean area, much lower than that in the estuaries and bays. The concentrations of MCHO in the surface of the Yap Trench were similar to that in the Indian Ocean (Bhosle et al., 1998), but higher than that in the equatorial Pacific, Atlantic Ocean (Pakulski and Benner, 1994) and the Arctic Ocean (Wang et al., 2006). The concentrations of PCHO in the surface of the trench were similar to those in the Pacific and Atlantic (Pakulski and Benner, 1994), but higher than those in the Arctic Ocean (Wang et al., 2006). Overall, the concentration ranges of dissolved carbohydrates in the surface water of the Yap Trench were consistent with the concentration ranges of dissolved carbohydrates in the ocean. Pakulski and Benner (1994) reported that the concentration of dissolved carbohydrates in the equatorial Pacific Ocean and the Gulf of Mexico varied insignificant with water depth, which was inconsistent with the results of this study. Our results showed that the concentrations of dissolved carbohydrates had decreased trend with water depth.
|
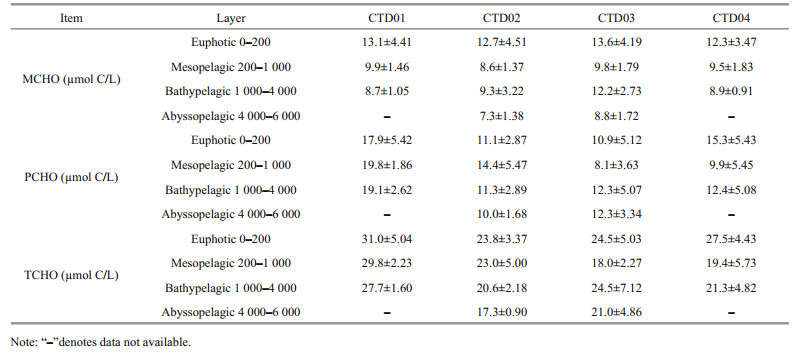
The average concentrations of MCHO, PCHO, and TCHO in the euphotic, mesopelagic, bathypelagic and abyssal layers of the four CTD stations in Yap Trench are listed in Table 4. Among the four stations, the concentrations of dissolved carbohydrates are roughly the same. In general, the variation of concentrations of MCHO gradually decreased from the euphotic layer to the abyssal layer (Pakulski and Benner, 1994), but in CTD03 and CTD04 stations, the concentration of MCHO in the bathypelagic layer was higher than those in the mesopelagic layer. This may be attributed to the conversion of particulate carbohydrates to MCHO. On the other hand, the reproduction of organic matter around 2 000 m might also provide source of MCHO. The concentration of PCHO in bathypelagic layer of CTD01 and CTD02 stations was higher than those in mesopelagic layer. However, the opposite trend appeared in CTD03 and CTD04 stations. The concentration of TCHO reached the highest in the euphotic layer in all four stations. High primary production may attribute to the high concentration of the TCHO in the euphotic layer. In CTD01 and CTD02 stations, the concentration of TCHO decreased with water depth. In CTD03 and CTD04 stations, the concentration of TCHO in the bathypelagic layer was higher than those in the mesopelagic layer. This result is consistent with the concentration variation trends of PCHO.
|
Generally, in the four CTD stations of the Yap Trench, the maximum value of TCHO appeared in the euphotic layer (0–200 m). This result was consistent with data of Pakulski and Benner (1994). They found the maximum concentration of the TCHO in the equatorial Pacific appeared at the depth of 19 m, and Hung et al. (2003) detected that maximum concentration of TCHO in the Gulf of Mexico occurred between 0 and 100 m. These high values of concentration of TCHO indicated the effect of phytoplankton on the distribution of marine carbohydrates. Phytoplankton photosynthesis initiated energy flow and material flow in marine ecosystems (Huang et al., 2006). Dissolved carbohydrates in the ocean were direct products of phytoplankton photosynthesis (Benner et al., 1997), and biomass of phytoplankton affected the distribution of concentrations of carbohydrates to some extent (Kerhervé et al., 2002; Thornton, 2014). The concentration of chl a in seawater is an important indicator of phytoplankton biomass, and its distribution reflects the abundance and variation of phytoplankton in water (Walsh et al., 1988). In the 0–200 m euphotic layer of the Yap Trench, chl a increased from sea surface to 100 m, and then decreased with water depth. The maximum appeared at 100 m depth. The concentration of chl a below 200 m was lower than the detection limit. The euphotic layers of the four stations exhibited maximum concentrations of dissolved carbohydrates, indicating the production and release of phytoplankton might be the most important source of dissolved carbohydrates in seawater (Pakulski and Benner, 1994). However, there was no significant correlation between concentration of dissolved carbohydrates and chl a in this study, demonstrating that phytoplankton biomass in the euphotic layer of the northern of the Yap Trench was not the only factor controlling concentrations of carbohydrate in seawater. Hayakawa (2004) and Wang et al. (2006) also considered that concentrations of dissolved carbohydrates were affected by various factors. Previous studies also showed that the relationship between dissolved carbohydrates and chl a in different sea areas were very complicated. For example, Hung et al. (2001) reported concentrations of TCHO (R=0.76; P < 0.002) and chl a had significant positive linear relationship in the estuary of Galveston Bay. In the Gerlache Strait, chl a was significantly negatively correlated with PCHO (R=-0.64; P < 0.05) and MCHO (R=-0.74; P < 0.05) (Pakulski and Benner, 1994). In fact, carbohydrates production by photosynthesis of phytoplankton in the euphotic layer and carbohydrate consumption by respiration of marine organisms (Walsh, 1965), caused the complex vertical variations of the concentrations of MCHO, PCHO and TCHO in the euphotic seawater. Dissolved carbohydrates were consumed by photodegradation in the euphotic layer. For example, PCHO in the Adriatic Sea was cleaved into MCHO by glycosidic bonds under light conditions, and then MCHO formed smaller molecules by photolysis (Kovac et al, 1998). To a certain extent, the complex changes in the concentrations of MCHO, PCHO and TCHO in the euphotic layers of the four CTD stations in the study area were a combination of various processes, including photosynthesis, respiration and photodegradation.
4.2.3 Variation in concentration of carbohydrate from mesopelagic to abyssal layer of Yap TrenchBelow the euphotic layer, without light, the process of photosynthesis for synthesizing carbohydrates no longer existed. The concentrations of dissolved carbohydrates in seawater were mainly controlled by the following processes: respiration, consumption of monosaccharides by degradation, hydrolysis of polysaccharides to form monosaccharides, aggregation of polysaccharides to form particle matter, dissolution and release from particle phytoplankton caused by death and sinking of phytoplankton from euphotic layer and etc.
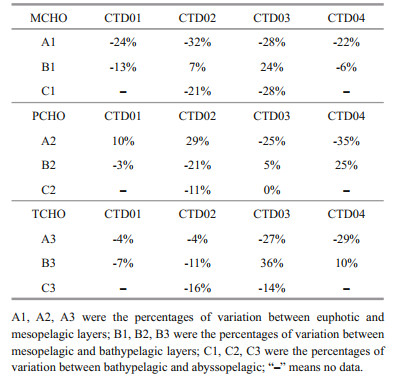
In the mesopelagic (200–1 000 m) layer, the concentrations of MCHO, PCHO, and TCHO in the whole study area were smaller than those in the euphotic layer, and the minimum concentration of TCHO in CTD03 and CTD04 stations appeared in the 800 m water depth. In the mesopelagic layer of the Yap Trench, with the depth increasing, the concentration of dissolved oxygen (Fig. 4) decreased dramatically, reaching minimum value in 500–1 000 m at all four stations. With consumption of dissolved oxygen, a large amount of organic matter was oxidized in that layer. The percentage changes of concentration of MCHO between different water layers in the four stations are shown in Table 5. The percentage reduction of concentrations of MCHO from euphotic to mesopelagic layers was very significant, indicating that a large fraction of MCHO was consumed. The consumption of MCHO was much faster higher than its production from the release of polysaccharide hydrolysis. This consumption was strongly related to the degradation of monosaccharides by microbial respiration. In the mesopelagic layer, the concentrations of PCHO in CTD01 and CTD02 stations increased, while its concentrations in CTD03 and CTD04 stations decreased, indicating that both the release of particulate carbohydrates into the seawater and the hydrolysis of polysaccharides in the seawater occurred, and then the variation of concentration of PCHO in the mesopelagic layers of different stations in the trench presented different trends. Bhosle et al. (1998) found a significant negative correlation between concentrations of dissolved carbohydrates and dissolved oxygen in the Arabian Sea. In the Sargasso Sea, Walsh and Douglass (1966) observed that the saturation of dissolved oxygen decrease 39.4% from 350 to 1 000 m depth, while concentrations of dissolved carbohydrate increased from 15 to 27.5 μmol/L C/L, and concentration of dissolved oxygen was negatively correlated with concentration of dissolved carbohydrate. In our study, the increasing concentration of PCHO and decreasing concentration of dissolve oxygen in the mesopelagic layer indicated that the decomposition of particulate carbohydrate by bacteria might be the source of PCHO in CTD03-04 station. Previous studies have shown that microbial growth, diagenetic transformation and mineralization processes existed in the oxygen minimum zone (Wishner et al., 1995). These microbial processes in the mesopelagic layers might lead to the production of PCHO, which increased the concentration of PCHO in seawater. The significant negative correlation between PCHO and MCHO (Bhosle et al, 1998), further declared that PCHO could be hydrolyzed into MCHO. Hydrolysis of PCHO became an important removal process of polysaccharides in seawater. The strength of the biotransformation processes was different among the four stations, causing different variation trends in concentrations of PCHO from euphotic to mesopelagic layers of the stations. In addition to the process of monosaccharide degradation and polysaccharide hydrolysis, dissolved carbohydrates could also undergo the conversion to particulate carbohydrates in seawater. Zhang and Liu (2004) found that carbohydrates were mainly in undissolved state in the 300–1 000 m seawater, and most dissolved carbohydrates were adsorbed on the surface of natural debris and migrated out of seawater with sedimentation. The combined effects of these processes led to a decrease of the concentration of TCHO in the mesopelagic layer of the northern of the Yap Trench.
|
Below mesopelagic layer of the trench, the concentration of dissolved oxygen in seawater gradually increased. In the bathypelagic layer of the trench, the concentrations of MCHO in the seawater from CTD02 and CTD03 stations increased with water depth, and the concentrations of MCHO in the seawater from CTD01 and CTD04 stations decreased with water depth. However, the percentage changes between the mesopelagic and the bathypelagic layers were significantly lower than that between the euphotic to the mesopelagic layers. These variations showed that the consumption of monosaccharide was weakened in the bathypelagic layer by respiration and degradation, and the hydrolysis of polysaccharide becomes an important source of MCHO. In CTD01 and CTD02 stations, the concentrations of PCHO and TCHO in abyssal layer were lower than those in the mesopelagic layer, while the opposite trend appeared in CTD03 and CTD04 stations. The increase of PCHO and TCHO indicated that the particulate polysaccharide would further become dissolved polysaccharides with the increasing seawater depth. If the hydrolysis processes of dissolved polysaccharides weakened, the concentrations of TCHO and PCHO in the seawater would increase. Otherwise, the concentrations of TCHO and PCHO would decrease. In this study, the concentrations of PCHO and TCHO in CTD03 and CTD04 stations were higher in the bathypelagic layer than those in the mesopelagic layer, indicating that the low temperature of bathypelagic layer limited the activities of marine organisms, reduced the energy consumption, and increased the concentrations of carbohydrates and dissolved oxygen in the layer. On the other hand, the funnel-shaped Yap Trench could promote the migration of particulate organic matter into the bathypelagic layer. Previous studies on the decomposition process of particulate organic matter showed that particulate carbohydrates were preferentially decomposed by bacteria and dissolved in seawater, and then increased their concentrations (Wang and Ji, 1995). In addition, Liu et al. (2018) reported that below 3000 m water depth, turbulent mixing process in the north of the Yap Trench was detected. The deep current in the Yap Trench was a branch of the deep-water current of the Southern Ocean circulation in the North Pacific Ocean (Johnson and Toole, 1993). Therefore, these two stations were affected by the seawater from Antarctic deep water with higher concentration of dissolved carbohydrate, and then, increasing the concentration of carbohydrates in the bathypelagic layer of the two stations. The variation of the concentration of carbohydrates in bathypelagic layer of Yap Trench was the combined result of transport and mixing of sea currents, funnel effect of the trench, microbial activity etc.
In the abyssal layer (4 000–6 000 m), the dissolved oxygen concentration continued to increase, and the concentrations of MCHO, PCHO, and TCHO showed significant decrease trends compared with the concentration in the bathypelagic layer. These results indicated that as the carbohydrate was continuously consumed from the euphotic to the abyssal seawater, the amount of particulate carbohydrate reduced continuously, and the dissolved polysaccharides from releasing of the particle polysaccharides also decreased. The hydrolysis process of the polysaccharides and the respiration of microorganisms kept consuming dissolved polysaccharides and monosaccharides, making decreasing trends of the concentration of TCHO in abyssal layers. However, in seawater from sediment-seawater interface, the concentrations of dissolved TCHO increased slightly in CTD02 and CTD03 stations. This increase might ascribe to the release of carbohydrates from resuspended sediment into seawater by vertical mixing (Arnosti and Holmer, 1999). Increasing concentrations of dissolved carbohydrate in sedimentseawater interface were also observed by Witter and Luther (2002) in the Delaware estuary of the United States, which was caused by vertical mixing of seawater.
4.2.4 Variation of concentrations of dissolved carbohydrate in the seawater-sediment interface of the Yap TrenchThe five Dive stations were located at the sedimentseawater interface of the Yap Trench. The average concentrations of MCHO, PCHO, and TCHO in the five Dive stations were 8.72, 9.39, and 18.11 μmol C/L, respectively, similar as the concentration of dissolved carbohydrate at the 6 000 m water depth in CTD02-03 station. The concentrations of MCHO and PCHO in the seawater from Dive109 and Dive113 stations were significantly different. MCHO was the dominant carbohydrate in Dive109 and PCHO the dominant carbohydrate in Dive113. This difference might be related to the depth of these two stations. The depths of Dive109 and Dive113 are 4 435 and 6 574 m, respectively. Particulate organic matter sinking from euphotic layer is the source of dissolved organic matter in the seawater at sediment-seawater interface of the trench. As an important fraction of dissolved organic matter, the concentrations of MCHO was controlled by the processes of vertical transport, degradation and mineralization of the particulate organic matter (Guo et al., 2018). Thus, it is reasonable that concentrations of MCHO at two different depths were significant. Glud et al. (2013) studied microbial activities in the hadal zone of the Mariana Trench (11 000 m) and the nearby 6 000 m layer. Their results show that the microbial oxygen consumption in the hadal zone was twice as high as that of the abyssal water, indicating high microbial activities in trench area (He et al., 2018). High microbial activity could rapidly consume MCHO and decompose deposited particulate organic matter to release carbohydrate into the nearby seawater through the resuspension process, causing lower concentration of MCHO and higher concentration of PCHO in hadal zone. The Dive113 station was located on the eastern of the trench. The horizontal transport of organic matter along the slope by gravity flow and gravity (Ichino et al., 2015), combining with the activities of microorganisms and the resuspension of sediments, resulted in high concentrations of PCHO and TCHO in this station.
4.3 The ratios of MCHO/TCHO and PCHO/TCHO in Yap TrenchThe vertical variation profiles of MCHO/TCHO and PCHO/TCHO at four stations with water depth were shown in Fig. 5. The MCHO/TCHO and PCHO/TCHO range of the seawater sample in CTD01 station were 0.23–0.7 and 0.3–0.76, respectively, with average values of 0.31 and 0.69, respectively. In general, the PCHO/TCHO values were higher than MCHO/TCHO in the seawater samples from all depth in this station, indicating that PCHO was the main component of TCHO in CTD01 station. This result is consistent with the results about the vertical distributions of concentrations of carbohydrates in the Atlantic Ocean, the Delaware River estuary (Witter and Luther, 2002), and the East China Sea (He et al., 2015). At 100 m depth, the MCHO/TCHO value increased to 0.7, while the PCHO/TCHO value decreased to 0.3. The increase of the MCHO/TCHO ratio further indicated degradation of PCHO into MCHO (Kovac et al., 1998).

|
| Fig.5 Vertical variation of MCHO/TCHO and PCHO/TCHO ratios in four CTD stations |
Overall, in CTD02 and CTD03 stations, the ratios of MCHO/TCHO and PCHO/TCHO were similar, but their variations with water depth were more complicated. In euphotic zone of CTD02 station, the average values of MCHO/TCHO were smaller than the average value of PCHO/TCHO, indicating that PCHO was the major component of TCHO in this station. PCHO was considered as a direct product of phytoplankton (Myklestad and Børsheim, 2007). In spring, phytoplankton synthesis released PCHO into seawater, and then PCHO became major fraction of TCHO. In the water depth of 200–4 000 m, the overall MCHO/TCHO was higher than the PCHO/TCHO, indicating that MCHO contributed more to TCHO in the mesopelagic and bathypelagic layers. In abyssal layer, at 4 000–5 000 m depth the ratio of PCHO/TCHO was higher than the ratio of MCHO/TCHO, indicating that PCHO was the main dissolved carbohydrates in the abyssal seawater. Near the bottom layer, the ratio of MCHO/TCHO increased significantly, probably due to the higher activity of benthic microbes (Glud et al., 2013) hydrolyzed PCHO to MCHO released into interface seawater by sediment resuspension.
The vertical variations of ratios of MCHO and PCHO to TCHO with water depth were not consistent at the four stations. In the 63 seawater samples from the four CTD stations, the PCHO/TCHO values in 36 samples were higher than 0.50. Overall, the average values of MCHO/TCHO and PCHO/TCHO were 0.47 and 0.53, respectively. From the average of PCHO/TCHO and MCHO/TCHO, PCHO was the major form of dissolved carbohydrates in the north region of the Yap Trench.
4.4 Relationship between dissolved carbohydrates and salinityIn the study area, the concentration of dissolved carbohydrates decreased dramatically at 100 m depth in CTD01, 03 and 04 stations, and a concentration thermocline of dissolved carbohydrates appeared. From Fig. 4, a halocline of the Yap Trench occurred at water depth of 100–200 m, and the maximum salinity appeared in 115 m water depth. The salinity remained constant below 200 m water depth in all stations. Liu et al. (2018) also proved that thermocline and halocline were present at the depths from 100 m to 200 m, where the steep vertical gradients of potential temperature and salinity existed. The water depth of the concentration thermocline of carbohydrate and halocline were similar, indicating that changes in salinity might affect the concentrations of dissolved carbohydrates in seawater of the trench. Correlation analysis was conducted on the concentration of dissolved carbohydrate and salinity in euphotic zone of the Yap Trench. The results showed that correlations between concentrations of MCHO and PCHO and salinity were insignificant, while concentration of TCHO and salinity had linear negative correlation (R=-0.78, P < 0.02) in the euphotic zone. The results were consistent with the studies of Zhang et al. (2013) in the Jiaozhou Bay and Song et al. (2017) in the East China Sea, indicating that physical mixing of seawater in the euphotic layer of the trench was another important factor controlling the concentration of TCHO in the seawater.
5 CONCLUSIONIn the present study, the vertical variations of concentrations of dissolved carbohydrates were investigated in the northern region of the Yap Trench. Overall, the concentrations of the dissolved carbohydrates decreased gradually with water depth. As a whole, PCHO was the major form of dissolved carbohydrates in the Yap Trench. Concentrations of dissolved carbohydrates were mainly affected by photosynthesis and respiration of plankton in the euphotic layer. Dissolved oxygen in the mesopelagic layer was one of key factors controlling the concentration of dissolved carbohydrate. In the bathypelagic layer, the mixing of water mass and the funnel effect of the trench affected the concentrations of dissolved carbohydrate significantly. At the bottom of the abyssal layer and the seawater-sediment interface, the concentrations of dissolved carbohydrate were influenced by resuspension of sediment. In the euphotic layer, the concentrations of TCHO were obviously correlated with salinity, suggesting that physical mixing of seawater was also an important factor controlling the concentrations of dissolved carbohydrates.
6 DATA AVAILABILITY STATEMENTThe datasets generated during the current study were available from the corresponding author on reasonable request.
7 ACKNOWLEDGMENTAuthors would like to express gratitude to crew and scientists aboard the R/V Xiangyanghong 09 and submersible Jiaolong.
Arnosti C, Holmer M. 1999. Carbohydrate dynamics and contributions to the carbon budget of an organic-rich coastal sediment. Geochimica et Cosmochimica Acta, 63(3-4): 393-403.
DOI:10.1016/S0016-7037(99)00076-9 |
Benner R, Biddanda B, Black B, McCarthy M. 1997. Abundance, size distribution, and stable carbon and nitrogen isotopic compositions of marine organic matter isolated by tangential-flow ultrafiltration. Marine Chemistry, 57(3-4): 243-263.
DOI:10.1016/S0304-4203(97)00013-3 |
Bhosle N B, Bhaskar P V, Ramachandran S. 1998. Abundance of dissolved polysaccharides in the oxygen minimum layer of the Northern Indian Ocean. Marine Chemistry, 63(1-2): 171-182.
DOI:10.1016/S0304-4203(98)00061-9 |
Burney C M, Johnson K M, Lavoie D M, Sieburth J M. 1979. Dissolved carbohydrate and microbial ATP in the North Atlantic:concentrations and interactions. Deep Sea Research Part A. Oceanographic Research Papers, 26(11): 1 267-1 290.
DOI:10.1016/0198-0149(79)90068-2 |
Fujiwara T, Tamura C, Nishizawa A, Fujioka K, Kobayashi K, Iwabuchi Y. 2000. Morphology and tectonics of the Yap Trench. Marine Geophysical Researches, 21(1-2): 69-86.
|
Glud R N, Wenzhöfer F, Middelboe M, Oguri K, Turnewitsch R, Canfield D E, Kitazato H. 2013. High rates of microbial carbon turnover in sediments in the deepest oceanic trench on Earth. Nature Geoscience, 6(4): 284-288.
DOI:10.1038/ngeo1773 |
Guo C Y, Yang Z, Chen J F, Zheng H, Zhang D S, Ran L H, Wang C S, Lu B, Chen Q N. 2018. A preliminary study on the food resources and trophic levels of the benthic community in the Yap Trench based on stable carbon and nitrogen isotopes. Haiyang Xuebao, 40(10): 51-60.
(in Chinese with English abstract) |
Hawkins J, Batiza R. 1977. Metamorphic rocks of the Yap arctrench system. Earth and Planetary Science Letters, 37(2): 216-229.
DOI:10.1016/0012-821X(77)90166-2 |
Hayakawa K. 2004. Seasonal variations and dynamics of dissolved carbohydrates in Lake Biwa. Organic Geochemistry, 35(2): 169-179.
DOI:10.1016/j.orggeochem.2003.09.002 |
He G Y, Xu W, Guo S S, Liu W H, Luo Z H. 2018. Diversity and denitrification capability of cultivable fungi from deep-sea sediments of Yap Trench. Journal of Applied Oceanography, 37(2): 229-240.
(in Chinese with English abstract) |
He Z, Wang Q, Yang G P, Gao X C, Wu G W. 2015. Spatiotemporal variation characteristics and related affecting factors of dissolved carbohydrates in the East China Sea. Continental Shelf Research, 108: 12-24.
DOI:10.1016/j.csr.2015.08.002 |
Huang B Q, Liu Y, Chen J X, Wang D Z, Hong H S, Lü R H, Huang L F, Lin Y A, Wei H. 2006. Temporal and spatial distribution of size-fractionized phytoplankton biomass in East China Sea and Huanghai Sea. Acta Oceanologica Sinica, 28(2): 156-164.
(in Chinese with English abstract) |
Hung C C, Guo L D, Santschi P H, Alvarado-Quiroz N, Haye J M. 2003. Distributions of carbohydrate species in the Gulf of Mexico. Marine Chemistry, 81(3-4): 119-135.
DOI:10.1016/S0304-4203(03)00012-4 |
Hung C C, Tang D G, Warnken K W, Santschi P H. 2001. Distributions of carbohydrates, including uronic acids, in estuarine waters of Galveston Bay. Marine Chemistry, 73(3-4): 305-318.
DOI:10.1016/S0304-4203(00)00114-6 |
Hung C C, Warnken K W, Santschi P H. 2005. A seasonal survey of carbohydrates and uronic acids in the Trinity River, Texas. Organic Geochemistry, 36(3): 463-474.
DOI:10.1016/j.orggeochem.2004.09.004 |
Ichino M C, Clark M R, Drazen J C, Jamieson A, Jones D O B, Martin A P, Rowden A A, Shank T M, Yancey P H, Ruhl H A. 2015. The distribution of benthic biomass in hadal trenches:a modelling approach to investigate the effect of vertical and lateral organic matter transport to the seafloor. Deep Sea Research Part Ⅰ:Oceanographic Research Papers, 100: 21-33.
DOI:10.1016/j.dsr.2015.01.010 |
Johnson G C, Toole J M. 1993. Flow of deep and bottom waters in the Pacific at 10°N. Deep Sea Research Part Ⅰ:Oceanographic Research Papers, 40(2): 371-394.
DOI:10.1016/0967-0637(93)90009-R |
Kawasaki N, Benner R. 2006. Bacterial release of dissolved organic matter during cell growth and decline:molecular origin and composition. Limnology and Oceanography, 51(5): 2 170-2 180.
DOI:10.4319/lo.2006.51.5.2170 |
Kerhervé P, Buscail R, Gadel F, Serve L. 2002. Neutral monosaccharides in surface sediments of the northwestern Mediterranean Sea. Organic Geochemistry, 33(4): 421-435.
DOI:10.1016/S0146-6380(02)00003-7 |
Khodse V B, Fernandes L, Gopalkrishna V V, Bhosle N B, Fernandes V, Matondkar S G P, Bhushan R. 2007. Distribution and seasonal variation of concentrations of particulate carbohydrates and uronic acids in the northern Indian Ocean. Marine Chemistry, 103(3-4): 327-346.
DOI:10.1016/j.marchem.2006.10.003 |
Kovac N, Faganeli J, Sket B, Bajt O. 1998. Characterization of macroaggregates and photodegradation of their water soluble fraction. Organic Geochemistry, 29(5-7): 1 623-1 634.
DOI:10.1016/S0146-6380(98)00178-8 |
Lin P, Guo L D. 2015. Spatial and vertical variability of dissolved carbohydrate species in the northern Gulf of Mexico following the Deepwater Horizon oil spill, 2010-2011. Marine Chemistry, 174: 13-25.
DOI:10.1016/j.marchem.2015.04.001 |
Liu Y Z, Liu X H, Lv X Q, Cao W, Sun C J, Lu J, Wang C S, Yang J C. 2018. Watermass properties and deep currents in the northern Yap Trench observed by the Submersible Jiaolong system. Deep Sea Research Part Ⅰ:Oceanographic Research Papers, 139: 27-42.
DOI:10.1016/j.dsr.2018.06.001 |
Myklestad S M, Børsheim K Y. 2007. Dynamics of carbohydrates in the Norwegian Sea inferred from monthly profiles collected during 3 years at 66°N, 2°E. Marine Chemistry, 107(4): 475-485.
DOI:10.1016/j.marchem.2007.09.002 |
Myklestad S M, Skånøy E, Hestmann S. 1997. A sensitive and rapid method for analysis of dissolved mono- and polysaccharides in seawater. Marine Chemistry, 56(3-4): 279-286.
DOI:10.1016/S0304-4203(96)00074-6 |
Pakulski J D, Benner R. 1994. Abundance and distribution of carbohydrates in the ocean. Limnology and Oceanography, 39(4): 930-940.
DOI:10.4319/lo.1994.39.4.0930 |
Sato T, Kasahara J, Katao H, Tomiyama N, Mochizuki K, Koresawa S. 1997. Seismic observations at the Yap Islands and the northern Yap Trench. Tectonophysics, 271(3-4): 285-294.
DOI:10.1016/S0040-1951(96)00251-X |
Song S Z, Gao L, Li D J, Wang T, Zhu L X, Liu Y L. 2017. Distributions and dynamics of dissolved carbohydrate species in Changjiang Estuary and the adjacent East China Sea. Marine Chemistry, 194: 22-32.
DOI:10.1016/j.marchem.2017.04.002 |
Thornton D C O. 2014. Dissolved organic matter (DOM)release by phytoplankton in the contemporary and future ocean. European Journal of Phycology, 49(1): 20-46.
DOI:10.1080/09670262.2013.875596 |
Walsh G E, Douglass J. 1966. Vertical distribution of dissolved carbohydrate in the Sargasso Sea off Bermuda. Limnology and Oceanography, 11(3): 406-408.
|
Walsh G E. 1965. Studies on dissolved carbohydrate in Cape Cod waters. II Diurnal fluctuation in oyster pond. Limnology and Oceanography, 10(4): 577-582.
|
Walsh J J, Wirick C D, Pietrafesa L J, Whitledge T E, Hoge F E, Swift R N. 1988. High-frequency sampling of the 1984 spring bloom within the Mid-Atlantic Bight:Synoptic shipboard, aircraft, and in situ perspectives of the SEEP-I experiment. Continental Shelf Research, 8(5-7): 529-563.
DOI:10.1016/0278-4343(88)90067-2 |
Wang D L, Henrichs S M, Guo L D. 2006. Distributions of nutrients, dissolved organic carbon and carbohydrates in the western Arctic Ocean. Continental Shelf Research, 26(14): 1 654-1 667.
DOI:10.1016/j.csr.2006.05.001 |
Wang R H, Ji M H. 1995. Carbohydrate composition in Jiaozhou Bay. Acta Oceanologica Sinica, 17(6): 58-64.
(in Chinese) |
Wang X R, Cai Y H, Guo L D. 2013. Variations in abundance and size distribution of carbohydrates in the lower Mississippi River, Pearl River and Bay of St Louis. Estuarine, Coastal and Shelf Science, 126: 61-69.
DOI:10.1016/j.ecss.2013.04.008 |
Wishner K F, Ashjian C J, Gelfman C, Gowing M M, Kann L, Levin L A, Mullineaux L S, Saltzman J. 1995. Pelagic and benthic ecology of the lower interface of the Eastern Tropical Pacific oxygen minimum zone. Deep Sea Research Part Ⅰ:Oceanographic Research Papers, 42(1): 93-115.
DOI:10.1016/0967-0637(94)00021-J |
Witter A E, Luther G W. 2002. Spectrophotometric measurement of seawater carbohydrate concentrations in neritic and oceanic waters from the U.S. Middle Atlantic Bight and the Delaware estuary. Marine Chemistry, 77(2-3): 143-156.
DOI:10.1016/S0304-4203(01)00083-4 |
Zhang S, Fang Z X. 1991. Soluble carbohydrates in the waters of Daya Bay. Tropic Oceanology, 10(4): 89-93.
(in Chinese) |
Zhang Y P, Yang G P, Lu X L, Ding H B, Zhang H H. 2013. Distributions of dissolved monosaccharides and polysaccharides in the surface microlayer and surface water of the Jiaozhou Bay and its adjacent area. Continental Shelf Research, 63: 85-93.
DOI:10.1016/j.csr.2013.05.002 |
Zhang Z B, Liu L S. 2004. Marine Chemistry. Shandong Education Press, Ji'nan, China. p.185-203. (in Chinese)
|