 2020, Vol. 38
Institute of Oceanology, Chinese Academy of Sciences
Article Information
- Taha MohamedEL-KATONY, Magda FaizEL-ADL
- Salt response of the freshwater microalga Scenedesmus obliquus (Turp.) Kutz is modulated by the algal growth phase
- Journal of Oceanology and Limnology, 38(3): 802-815
- http://dx.doi.org/10.1007/s00343-019-9067-z
Article History
- Received Mar. 14, 2019
- accepted in principle Jul. 2, 2019
- accepted for publication Sep. 5, 2019


Soil and water salinity represents a serious threat to land productivity in several regions of the world, particularly the arid and semiarid zones. The problem is further aggravated by secondary salinization due to anthropogenic activities, which renders an increasing sector of the cultivated lands barren and non-fertile every year. As a strategy to cope with the problem of salinity, the poor-quality water can be utilized for cultivation of non-conventional crops that can tolerate harsh environments, in a way to devote the fresh water supplies for human use and production of food crops.
However, algae can afford a valuable alternative to higher plants for utilization of salt-affected soils and waters. Bleakley and Hayes (2017) highly appreciated the role of macroalgae (seaweeds) and microalgae in modern agriculture and termed them "under-exploited crops". Manipulation of algae, instead of higher plants, for production of energy and animal feed can solve several problems such as competition with food production, land utilization, prolonged cultivation times, low yield, and seed toxicity (Alam et al., 2015). In addition, algae have outstanding potentiality to cope with harsh environments compared with higher plants (Lawton et al., 2015). Planktonic algae are often subjected to fluctuating salt concentrations, particularly in estuarine water (Moisander et al., 2002), which might aid in the emergence of salttolerant algal generations by virtue of their rapid growth and reproduction rates.
Different algal species can be manipulated for production of human food, animal feed, and biofuel, in addition to the production of biologically active and antimicrobial compounds (Li et al., 2008; Bleakley and Hayes, 2017). The growth and oil producing efficiency of algae are much higher than that of conventional oil-seed crops such as corn and soybean (Li et al., 2008). Green microalgae contain 20%–70% lipid and exhibit extraordinarily potential for cultivation as energy crops (De Vries et al., 2010). Biomass productivity and the biochemical composition are key factors determining the suitability of algae for utilization in production of useful products (Park et al., 2011). For example, protein concentration is critical for animal feed (Boland et al., 2013), whereas high lipid content is important for biofuel production (Elliott et al., 2015). Another advantage of algae over higher plants is that they can grow on industrial, municipal, and agricultural effluents as well as in fresh and marine waters, which evaluates them for use in wastewater treatment (Chinnasamy et al., 2010).
Scenedesmus is a genus of coenobial green algae, with regularly four or eight cells per coenobium and different morphology according to the cultural conditions, including the level of salinity (Kaewkannetra et al., 2012). S. obliquus is one of the most promising algal species as feedstock for biodiesel production by virtue of its fast growth, efficient photosynthesis, ability to accumulate lipids and to grow in wastewaters (Tang et al., 2011; Kaewkannetra et al., 2012). In addition, S. obliquus has the ability to utilize organic substrates, such as molasses, under both light and dark conditions (Combres et al., 1994), a characteristic justifying its use in bioremediation of organic wastes. The present work was conducted to monitor the consequences of salinity stress on growth and chemical composition of S. obliquus (Turp.) Kutz during different growth phases. Our hypothesis is that salt response of this microalga can vary according to the growth phase. The outcomes of this work are necessary for selection of the appropriate time and level of salinity for future manipulation of S. obliquus in oil production.
2 MATERIAL AND METHOD 2.1 Algal materialScenedesmus obliquus (Turp.) Kutz was collected from the Nile River at Damietta city (31°25′N and 31°67′E), and was identified according to Guiry and Guiry (2013). The alga was isolated and maintained on BG11 growth medium (Tran et al., 2010), and the culture was renewed at regular intervals to maintain the alga in the exponential phase of growth.
2.2 Effect of salinity on algal growth and performanceOne milliliter of the starting S. obliquus maintenance culture was inoculated in 250-mL Erlenmeyer flasks containing 100 mL of sterile Chu 10 culture medium. The stock Chu 10 medium contained (mg/L): Ca(NO3)2·4H2O 57.5, K2HPO4 5, MgSO4·7H2O 25, Na2CO3 20, Na2SiO3 25, FeCl3·6H2O 1.33, and the pH was adjusted to 7.5±0.1. Salinity stress was imposed by adding NaCl to the medium at concentrations of 0, 30, 100, and 200 mmol/L. The flasks were incubated, with periodic gentle shaking, in a growth chamber supplemented with white fluorescent tubes to give irradiance of 50 μmol photons PAR/(m2·s) for 24 h at an average temperature of 25℃. An aliquot (20 mL) of the algal culture was harvested at 4-d intervals across a growth period of 20 d, and separate flasks were used for each harvest. The experiment was factorial with two factors and three replications in a completely randomized design. The main factors were: 1) salinity with four levels (0, 30, 100, and 200 mmol/L NaCl) and 2) age of the culture with six levels (0, 4, 8, 12, 16, and 20 d).
2.3 Estimation of algal growthAlgal growth was estimated spectrophotometrically by measuring absorbance of the culture at 680 nm (A680). Scanning of the culture absorbance across a range of 600–760 nm yielded a peak at 680 nm (Fig. 1).

|
| Fig.1 Absorbance of the S. obliquus culture across a wavelength range of 600–760 nm |
For estimation of the different algal constituents, an aliquot of the algal culture was centrifuged at 6 000×g for 5 min; the pellet was re-suspended in distilled water and centrifuged, and this step was repeated once more to wash cells from the bathing solution.
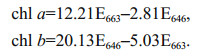
2.4.1 Estimation of photosynthetic pigmentsPhotosynthetic pigments of the alga were determined according to the method described by Wellburn and Lichtenthaler (1984). The washed algal pellet was extracted in 80% acetone using cold mortar and pestle in dim light. The slurry was centrifuged and the clear extract was brought up to volume with 80% acetone and absorbance was read at 646 and 663 nm using a UNICO 7200 series spectrophotometer. The concentrations of chlorophyll a (chl a) and chlorophyll b (chl b) were calculated (μg/mL) using the following equations:
The washed algal pellet was homogenized using a very small pestle fitted in 1.5-mL Eppendorf tube containing 1 mL of boiling 80% ethanol for 30 min and the mixture was centrifuged at 8 000×g for 10 min. Extraction was repeated with fresh 80% ethanol, followed by centrifugation and the extracts were bulked. The residue was kept at -4℃ for determination of starch. The supernatant was quantitatively transferred to glass vials and evaporated to dryness at 70℃, re-dissolved in distilled water and used for determination of soluble sugars. An aliquot of the aqueous extract was completed to 1 mL by distilled water, mixed carefully with 3 mL of the anthrone reagent (8.6 mmol/L anthrone in 80% v/v H2SO4) and heated in water bath at 80℃ for 10 min. After cooling in an ice bath, absorbance was read at 623 nm against the reagent blank. Total soluble sugars were estimated from a glucose calibration curve in the range of 0 to 100 μg glucose/mL (Schlüter and Crawford, 2001).
2.4.2.2 StarchThe residue left after extraction of soluble sugars was suspended in 9.6 mol/L HClO4 and stirred for 15 min at 25℃ for complete hydrolysis of starch (Brányiková et al., 2011). The resulting glucose units were estimated by the anthrone method. Starch was expressed as glucose equivalents using glucose calibration curve in the range of 0 to 100 μg glucose/ mL.
2.4.3 Estimation of proteinThe washed algal pellet was extracted in 1 mL of 1 N NaOH for 24 h at 4 ℃ and the debris was removed by centrifugation at 6 000×g for 10 min. Protein content of the supernatant was determined according to the method of Bradford (1976). An aliquot of the supernatant was completed to 1 mL with distilled water, mixed with 5 mL of the Coomassie brilliant blue reagent and absorbance was read at 595 nm after standing for 5 min at room temperature. Protein concentration was calculated using a standard curve of bovine serum albumin in the range of 0–100 μg/mL.
2.4.4 Estimation of mineralsThe algal K+ and Na+ were extracted according to the method described by Hansen and Munns (1988). The washed algal pellet was extracted in 1 mL of distilled water in Eppendorf tubes at 95℃ for 2 h. The debris was removed by centrifugation at 8 000×g for 10 min. and the clear extract was used for determination of K+ and Na+ using a Jenway PFP7 flame photometer.
2.5 Definitions and calculationsRelative growth rate (RGR) of the alga, also known as the efficiency index, was estimated from the following equation:
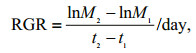
where M2 and M1 are the algal biomass estimated as A680 at times t2 and t1, respectively.
The times (d) to 10% growth (T10), 50% growth (T50) and 90% growth (T90) were taken to express the length of the lag period, the midpoint of the exponential phase and onset of the stationary phase, respectively. Therefore, the period (T90–T10) was taken to express the length of the exponential phases. The concentrations of chlorophylls, soluble sugars, starch, proteins, and ions in the alga were estimated based on A680 as a measure of growth.
2.6 Statistical analysisThe data were subjected to two-way ANOVA using SPSS version 22 to assess and the effect of the main factors (age of culture and level of salinity) and their interaction on algal growth and composition. Mean separation was performed using the Duncan's multiple range test at P < 0.05.
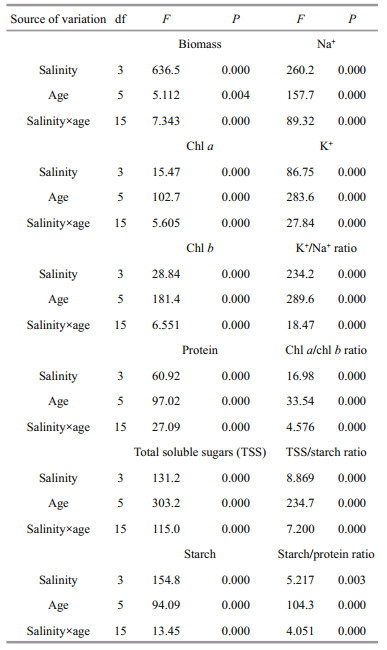
3 RESULTThe two-way ANOVA revealed highly significant effect of the main factors (level of salinity and age of the algal culture) and their interaction on algal growth and composition (Table 1). Among the main factors, age of culture exerted a stronger effect on algal composition (with greater F ratio) relative to salinity level. However, algal biomass and algal concentrations of starch and Na+ exhibited stronger response to salinity than to culture age.
|
Time course of algal growth exhibited a sigmoidal pattern, with distinct lag period, followed by an exponential phase and ultimately a stationary phase. The timing of onset of these phases was markedly prolonged with the increase in the level of salinity. The values of T10, T50 and T90 were increased by 74%, 39%, and 50%, respectively, upon increasing salinity from 0 to 200 mmol/L NaCl (Fig. 2a).

|
| Fig.2 Effect of salinity on growth of S. obliquus Time course of algal growth (a) and RGR (c) under increasing salinity stress. Salinity-response relationship of algal growth (b) and RGR (d) at different growth stages. Each value is the mean of 3 replicates ±SE. Each point in Fig. 2c and each series in Fig. 2d represent the response at the midpoint of two periods. Since RGR was calculated using the means of two periods, their values were not associated with SE. |
Besides affecting timing of the different growth phases, salinity led to marked reduction in algal growth, and the magnitude of reduction varied according to the growth stage. During the early stage of growth (up to 8 d), algal growth exhibited a sharp progressive reduction of 85% with the increase in salinity from 0 to 200 mmol/L NaCl. However, at the later stages, algal growth exhibited relatively moderate reductions of 67% by the 12th day and 58% afterwards as salinity level exceeded a threshold of 30 mmol/L NaCl up to 200 mmol/L NaCl. In addition, with the progress of age, the threshold salinity was associated with progressive promotion of algal growth (Fig. 2b).
RGR of S. obliquus followed a common time course with a peak of 0.42/d across the period 4–8 d (i.e., by the 6th day of growth), irrespective of salinity level and variable effect of salinity around this peak (Fig. 2c). The effect of salinity on RGR was manifested as a strong inhibition during the early stage of growth that diminished with the progress of time, and reversed to a marked promotion, which in turn diminished at the late stages. During the earliest period of growth (0–4 d) RGR was progressively lowered from 0.328/d in absence of salinity 0 to -0.151/d at 200 mmol/L NaCl, but this aggressive effect of salinity diminished during the subsequent period (4–8 d). A positive effect of salinity on RGR was then observed across the third growth interval, where RGR was increased from 0.133/d in absence of salinity to 0.322/d at 200 mmol/L NaCl; and this positive effect again diminished to a small positive effect at the fourth interval and almost no effect at the final interval (Fig. 2d).
3.2 Photosynthetic pigmentsThe concentrations of chl a and chl b in the algal cells exhibited a bell-shaped time course, with peaks at the 4th day of growth, which magnitudes differed according to the level of salinity (Fig. 3a & c). Likewise, the effect of salinity was modulated by the age of culture. At the early stages of growth (the period from the 4th to the 8th day), chl a and chl b, with overall high levels, exhibited a peak at 100 mmol/L NaCl. Post this early period, the two pigments exhibited steady moderate increase with the increase in salinity up to 200 mmol/L NaCl and the magnitude of increase being inversely proportional to the culture age (Fig. 3b & d).

|
| Fig.3 Effect of salinity on photosynthetic pigment composition of S. obliquus Time course of chl a (a), chl b (c) and the chl a/chl b ratio (e) under increasing salinity levels. Salinity-response relationship of chl a (b), chl b (d) and the chl a/chl b ratio (f) at different growth stages. Each value is the mean of 3 replicates ±SE. |
Despite the coincidence in the time course and effect of salinity on chl a and chl b of S. obliquus, the magnitude of response differed in the two pigments. This led to changes in the time course and salinity effect on the chl a/chl b ratio. The time course of chl a/chl b ratio exhibited a distinct periodic rhythm at salinity levels up to 100 mmol/L NaCl, with alternating minima and maxima. However, at 200 mmol/L NaCl, the initial decline was followed by steady low values across the period of 4–16 d with a limited rise at the 20th day (Fig. 3e). The response of chl a/chl b ratio to salinity varied according the growth stage. During the early phase of growth (4–8 d), chl a/chl b ratio was subjected to negligible decline in response to salinity. However, during the subsequent period (12–16 d), the chl a/chl b ratio exhibited a transient limited increase at 30 mmol/L NaCl, followed by marked decline with further increase in salinity up to 200 mmol/L NaCl. At the latest stage of growth (the 20th day), the chl a/chl b ratio exhibited progressive decline of 53% across the whole range of salinity (Fig. 3f).
3.3 Carbohydrate fractionsTotal soluble sugars (TSS) of the alga exhibited their peaks by the 4th day of growth at all salinity levels, but with increasing magnitude in proportion with the increase in salinity level of the medium (Fig. 4a). Likewise, the effect of salinity on TSS was age-dependent, being particularly evident at the earliest stage of growth (the 4th day), at which TSS experienced a fourfold increase as salinity level increased from 100 to 200 mmol/L NaCl. Although the increase in TSS by salinity at the 8th day of growth amounted to about six folds, the overall level of TSS was very low at this stage. Post the 8th day, the salinityinduced increase in TSS concentration of the alga was very limited with overall very low levels of TSS (Fig. 4b).

|
| Fig.4 Effect of salinity on carbohydrate fractions of S. obliquus Time course of TSS (a), starch (c) and the TSS/starch ratio (e) under increasing salinity levels. Salinity-response relationship of TSS (b), starch (d) and the TSS/starch ratio (f) at different growth stages. Each value is the mean of 3 replicates ±SE. |
Starch concentration of the alga exhibited an initial increase up to a certain age, followed by either a steady level or slight decline depending on the level of salinity. At 0 and 30 mmol/L NaCl, the increase in starch concentration progressed up to the 12th and 4th d respectively, followed by a plateau, but at 100 and 200 mmol/L NaCl, the increase progressed up to the 12th and 16th d, followed by a slight decrease (Fig. 4c). Salinity led to increasing starch concentration of the alga, and the magnitude of increase varied from 120% at the early stages of growth (the 4th and 8th d) to 260% at the latter stages, as salinity exceeded 30 mmol/L up to 200 mmol/L NaCl (Fig. 4d).
The time course of the TSS/Starch ratio of the alga varied according to the level of salinity. At the low salinity levels (0 and 30 mmol/L NaCl) the TSS/ Starch ratio was subjected to sharp decline with the progress of culture age up to the 12th day of growth, with no further decline afterwards. However, at higher salinity levels (100 and 200 mmol/L NaCl) there was a transient moderate increase by the 4th day of growth, followed by sharp decline afterwards (Fig. 4e). Likewise, the effect of salinity on the TSS/starch ratio of the alga depended on the growth stage, being particularly evident at the early stages of growth. After 4 d of growth, the TSS/starch ratio exhibited a minimum at 30 mmol/L NaCl, followed by a sharp rise with further increase in salinity up to 200 mmol/L NaCl, whereas after 8 d, the rise was progressive up to 100 mmol/L NaCl with no further increase at 200 mmol/L NaCl. At the late stages of growth (12– 20 d), the very low values of the TSS/starch ratio led to very limited effect of salinity but with a maximum at 30 mmol/L NaCl (Fig. 4f).
3.4 Protein content and starch/protein ratioAlgal protein exhibited a time course similar to that of total soluble sugars (TSS), peaking by the 4th day of growth with increasing peak magnitude in proportion with the increase in the level of salinity (Fig. 5a). Increasing salinity post 30 mmol/L NaCl led to progressive increase in protein concentration of the alga. However, the magnitude of increase was most pronounced at the early stages of growth (averaged around seven folds at the 4th and 8th d) but fades out with the progress of culture age (amounting to only two folds at the 12th day and down to 93% at the 16th and 20th d) (Fig. 5b).

|
| Fig.5 Time course of protein (a) and the starch/protein ratio (c) of S. obliquus under increasing salinity levels; salinityresponse relationship of protein (b) and the starch/protein ratio (d) at different growth stages Each value is the mean of 3 replicates ±SE. |
The starch/protein ratio of the alga exhibited a time course similar to that of growth, with an initial lag phase, followed by a period of sharp rise and terminated with a steady phase or a slight decline (Fig. 5c). The transition between these phases was modulated by the level of salinity. For example, the lag period was relatively brief, with an average of 4 d in the control and 30 mmol/L NaCl but prolonged up to the 8th day at 100 and 200 mmol/L NaCl. Likewise, the beginning of the stationary phase was set at the 12th day for 0–100 mmol/L NaCl but extended up to the 16th day for 200 mmol/L NaCl. In turn, the effect of salinity on the starch/protein ratio depended on the growth stage. At the early stages of growth (4–8 d), the starch/protein ratio was in the overall low and declined by about 70% as salinity exceeded a threshold of 30 mmol/L NaCl up to 200 mmol/L NaCl. By the 12th day, the effect of salinity on the starch/protein ratio was negligible, and later on (the 16th–20th d), the ratio experienced a small decrease at 30 mmol/L NaCl, followed by 90% increase with further increase in salinity up to 200 mmol/L NaCl (Fig. 5d).
3.5 Mineral contentK+ concentration of the alga exhibited a time course similar to that of soluble sugars and protein concentration with peaks, of increasing magnitude with the increase in salinity, by the 4th day of growth (Fig. 6a). Increasing salinity led to a progressive increase in K+ concentration of the alga, and the magnitude of increase was most pronounced at the early stages of growth, averaging around three folds at the 4th and 8th d but diminished with the progress of culture age, approaching 95% at the 12th day and only 37% at the 16th and 20th d (Fig. 6b).

|
| Fig.6 Effect of salinity on mineral composition of S. obliquus Time course of algal K+ (a), Na+ (c) and the K+/Na+ ratio (e) under increasing salinity levels. Salinity-response relationship of algal K+ (b), Na+ (d) and the K+/ Na+ ratio (f) at different growth stages. Each value is the mean of 3 replicates ±SE. |
The time course of the algal Na+ concentration was more or less similar to that of K+. However, the peaking time was shifted from the 4th day at low and moderate salinity (up to 100 mmol/L NaCl) to the 8th day at 200 mmol/L NaCl (Fig. 6c). The increase in Na+ concentration of the alga, in response to salinity, varied from 22 folds at the 4th and 12th d of growth and 10 folds at the 16th and 20th d across the whole range of salinity to 34 folds post 100 mmol/L and up to 200 mmol/L NaCl at the 8th day (Fig. 6d).
The time course of algal K+/Na+ ratio exhibited a periodic rhythm of sharp decline by the 4th day, followed by sharp rise during the subsequent 8 or 12 d, then mild decline and rise across the steady phase of growth. Whereas the initial sharp reduction in the K+/Na+ ratio was intensified with the increase in salinity, with magnitudes of 75%, 85%, 92% and 96% at 0, 30, 100 and 200 mmol/L NaCl, respectively; the subsequent rise was diminished by salinity, and amounted to 2.5 folds at 0–100 mmol/L NaCl across the period from the 4th–12th d and 80% across the period from the 4th–16th d at 200 mmol/L NaCl (Fig. 6e). The reduction in K+/Na+ ratio of the alga in response to salinity averaged around 90% across the whole range of salinity, independent on the culture age (Fig. 6f).
4 DISCUSSIONThe sigmoidal growth curve of S. obliquus, with a distinct lag period followed by an exponential phase and ultimately a stationary phase, is in accordance with the postulation of Rai et al. (2015) that microalgae share the growth phases of microbial populations. However, the timing of onset of the different growth phases is expected to vary depending on the algal species, growth conditions, and presence of stress factors. The genotypic effect emerges clearly when comparing the relatively brief growth phases of S. obliquus with the prolonged phases of Chl orella sp. demonstrated by Rai et al. (2015). The present work suggests that in addition to adversely affecting the magnitude of growth, salinity also slowed down the speed of S. obliquus growth, with delayed timing of transition between the different growth phases, particularly onset of the exponential phase. The reduction in microalgal growth under salinity stress has been reported for Scenedesmus sp. CCNM 1077 (Pancha et al., 2015), and Chlorella sp. (Rai et al., 2015), and the slowing down of growth rate has been reported for Chlorella vulgaris (Church et al., 2017).
The earlier sharp progressive reduction of S. obliquus growth rate in response to salinity versus the moderate sluggish reduction at the subsequent growth stages might mean that immediate exposure of the alga to salt stress induces salt shock, leading to growth retardation and achievement of negative growth rates, but, prolonged exposure to salinity will allow the development of salt resistance mechanisms, which aids in algal acclimation to salt stress. The earlier depression in RGR of the alga by salinity turned to no effect at mid stages of growth and subsequently to growth promotion, which in turn diminished with the progress of culture age towards the stationary stage. This behavior is expected in view of the limited culture volume used in the present work, which will lead to briefing of the different growth phases.
Salt acclimation or acquired salinity tolerance is common in plant cells, where previous exposure to salinity induces protective mechanisms and confers tolerance against subsequent exposure to high salinity (Pandolfi et al., 2016). The distinct ability of algal cells to acclimate to salt stress has been proposed by Erdmann and Hagemann (2001), who postulated that almost all cell types, including algae and cyanobacteria, are able to withstand a certain range of salt concentrations. Rapid acclimation to salinity stress is expected in micro-algae by virtue of their vigorous metabolic activity and high rate of cell division. In such organisms, growth and reproduction can be considered two aspects of cell division, where the new growth is in fact a new generation with distinct physiological and probably genetic characteristics. The osmotic and specific ion hazards of salinity stress can activate intensive acclimation processes that lead to production of resistant cells with distinct physiological characteristics. This acclimation process involves restoration of turgor via buildup of osmolytes, regulated ion uptake via changes in membrane permeability and accumulation of compatible solutes (Khatoon et al., 2014) as well as adjustment of metabolism via altered gene expression and enzyme activity (Erdmann and Hagemann, 2001).
The peaks of chl a, and chl b, coincided with the initiation of exponential phase of growth, and chlorophyll concentration declined in aging cells, probably in synchrony with lowering of metabolic activity. In addition, algal acclimation to salinity stress seems to be associated with alteration in the photosynthetic pigment composition of the alga. The initial salt shock was associated with a beneficial effect of 100 mmol/L NaCl compared with either lower or higher salinities, but later on, the beneficial effect of moderate salinity diminished and was replaced with a progressive, although mild, increase in photosynthetic pigment concentration with the increase in salinity. The reduction in biomass at high salinity was associated with reduction in chlorophyll content of Amphora subtropica (BenMoussa-Dahmen et al., 2016) and Scenedesmus sp. CCNM 1077 (Pancha et al., 2015). The striking matching in the periodicity of the chl a/chl b ratio and the K+/Na+ ratio of S. obliquus suggests that the alteration in algal K+ concentration, either temporal or salinity-induced, has direct consequences on chl a in particular. The mild effect of salinity on the chl a/chl b ratio at the early stages of growth versus a marked reducing effect at the later stages might mean that the adverse effect of salinity on photosynthetic pigments, which targets chl a in particular, is intensified with the progress of culture age.
The peaks of soluble sugars (SS) coincided with termination of the lag phase and onset of the exponential phase of growth, whereas starch exhibited a progressive increase towards the stationary phase of growth. This suggests that accumulation of soluble sugars is a pre-requisite for initiation of the exponential phase to fuel cell division and metabolic activities of this rapid growth stage. However, as the cells grow older there is a tendency to store photosynthates in the form of starch, with consequent lowering in the SS/ starch ratio. This might also mean that S. obliquus manipulates primarily soluble sugars as osmotically active solutes for initiation of the active growth phase, but subsequently another osmotica, probably Na+, K+ and proline, might aid in osmotic adjustment, concomitantly with conversion of soluble sugars to starch. In this regard, it has been claimed that the inter-conversion of carbon resources of algal cells among soluble sugars, starch, and lipids depends on algal species and environmental conditions (Del Río et al., 2017). For example, the pathways of lipid and starch synthesis compete for common bio-synthetic precursors in Chlamydomonas reinhardtii (Chiu et al., 2017), and the excess algal photosynthates are converted into storage carbohydrates (starch) or lipids under N deficiency (Yamaguchi et al., 2017).
The rise in the SS/starch ratio of S. obliquus with the increase in salinity might point to salinity-induced conversion of starch to soluble sugars or limited condensation of soluble sugars into starch. This might represent a mechanism of osmotic adjustment under the impact of salinity. The role of soluble sugars, along with other osmotically active compatible solutes such as proline and glycine betaine, in maintenance of cellular structure and functioning is well-established (Ahmed et al., 2017). Carbohydrate content of Amphora subtropica increased under salinity stress, despite the reduction in algal biomass and chlorophyll content (BenMoussa-Dahmen et al., 2016). Salinity has been reported to increase sugar, glycerin, and proline contents of microalgae (Erdmann and Hagemann, 2001). Although the increase in proline, soluble proteins, and soluble carbohydrates of microalgae under the impact of salinity was achieved at the expense of insoluble and total contents of proteins and carbohydrates, accumulation of active osmolytes has been considered an adaptive response rather than a reflection of impaired metabolism (Ahmed et al., 1989). The present findings suggest that at initiation of the exponential phase, high salinity might induce buildup of soluble sugars with an overall enhanced production of photosynthates. However, by the mid-exponential phase, salinity seems to enhance conversion of starch to soluble sugars, resulting in marked rise in SS with an overall inhibition of photosynthesis. The increase in starch concentration in S. obliquus, observed in the present work particularly at the later stages of growth, is in accordance with that reported by Siaut et al. (2011) for the fresh water microalga Chlamydomonas reinhardtii.
The peaking of protein concentration of S. obliquus at the onset of the exponential phase, in harmony with photosynthetic pigments, SS and K+, might mean that the production of SS and protein and, to a lesser extent photosynthetic pigments, as well as the uptake of K+ are aspects of algal performance that are similarly affected by salinity and growth phase of the alga. Nevertheless, protein concentration of Thalassiosira weissflogii increased progressively with the advance of diatom growth from the exponential to the stationary phase (García et al., 2012). This pattern of favored protein synthesis at the early stage of algal growth, followed by enhanced production of starch at the expense of protein, which was manifested as a progressive rise in the starch/protein ratio of the alga with progress of culture age-might arise from nutrient limitation during the late stages of algal growth. In support to this postulation, N deficiency can lead to conversion of excess algal photosynthates into starch (Yamaguchi et al., 2017).
The promoting effect of salinity on algal protein at the early stages of growth that diminished with the progress of culture age might mean that salt shock targets primarily cell division and expansion without affecting protein synthesis, but with the elapse of time, salinity can inhibit protein synthesis to a greater extent relative to its effect on algal growth. Salinity has been reported to reduce protein concentration of Amphora subtropica (BenMoussa-Dahmen et al., 2016) and Nannochloropsis sp. (Gu et al., 2012). However, the effect of salinity on algal proteins seems to be related to alterations in carbohydrate content. Whereas the enhanced carbohydrate content was associated with reduced protein content in Ulva lactuca (Kumari et al., 2014), it was associated with increased protein content in Nannochloropsis sp. and Tetraselmis sp. (Khatoon et al., 2014). Expectedly, salinity might affect algal protein fractions differentially, where the increase in soluble proteins was associated with a decrease in insoluble-and total proteins as reported for Scenedesmus obliquus (Ahmed et al., 1989).
The peaking of algal K+ concentration and to a lesser extent Na+ concentration, in harmony with SS, at the initiation of the exponential phase of growth signifies that the efficiency of K+ and Na+ accumulation is associated with the enhanced metabolic activity of the vigorously growing cells at this stage of growth. The striking increase in algal K+ concentration with the increase in salinity, particularly at the early stages of growth that diminished with the progress of culture age might mean that the actively growing cells at the early stages of growth possess a distinct ability to restore K+ homeostasis under the impact of salinity, a trait that diminishes in mature cells. This conclusion can be supported by the relatively moderate salinityinduced reduction in the algal K+/Na+ ratio at the early stages of growth versus marked decrease at the late stages. It has been claimed that upon exposure of plant cells to salinity, specific processes such as regulation of ion uptake, restoration of turgor pressure, and accumulation of compatible solutes and stress proteins are activated (Talebi et al., 2013; Bonomelli et al., 2018). However, because of cell aging, the adverse effect of salinity emerged again at the late stationary phase. Thus, the adverse effect of salinity on membrane integrity and K+ selectivity seems to be mild in the vigorously growing cells but severe in the mature cells of the late stationary phase.
The peaking of algal Na+ concentration at initiation of the exponential phase of growth might be viewed as manipulation of Na+, as a cheap inorganic osmoticum, under the impact of salinity stress rather than indiscriminate seep of Na+ across the membrane. It is quite probable that, at the initiation of this active stage of growth, algal cells possess integral membranes with conscious control of ion passage into the cell. This ability seems to diminish in the mature cells of the late stationary phase. In support to the role of salt ions in osmotic adjustment, the biomass peak of Thalassiosira weissflogii at high salinity has been attributed to the increase in the mineral fraction, which might be manipulated in osmotic adjustment (García et al., 2012). Nevertheless, excessive accumulation of Na+ and Cl– under salinity stress, which is mostly accompanied with lowered K+ selectivity and low Ca2+ uptake, would lead to ionic imbalance in plant cells (Sudhir and Murthy, 2004). One of the aspects of ionic imbalance is the lowering of the K+/Na+ ratio, which can be considered a sensitive indicator of the salt injury in plant cells (Maathuis and Amtmann, 1999). Maintenance of the K+/Na+ homeostasis via limitation of Na+ uptake may be considered as tolerance mechanisms to salt stress (Akça and Samsunlu, 2012; Yang and Guo, 2018). The present findings reveal that S. obliquus utilizes K+ and Na+ in addition to soluble sugars for osmotic adjustment under salinity stress, particularly at the early stages of growth.
5 CONCLUSIONThe adverse effect of salinity on S. obliquus was manifested as slowing down of the speed of growth and delay in timing of transition between the different growth phases. S. obliquus rapidly acclimates to salt stress, post a brief salt shock, utilizing diverse osmotica including soluble sugars in addition to K+ and Na+. Accumulation of soluble sugars in the algal cells seems a pre-requisite for enrollment in the rapid growth stage, but as the cells grow older starch represents the main carbohydrate storage.
6 DATA AVAILABILITY STATEMENTThe data sets of the current study are available from the corresponding author on reasonable request.
Ahmed A M, Mohamed A A, Heikal M M, Shafea A A. 1989. Changes in metabolism of Scenedesmus obliquus after relief of salinization stress. Medical Journal of Islamic World Academy of Sciences, 2(2): 100-105.
|
Ahmed R A, He M L, Aftab R A, Zheng S Y, Nagi M, Bakri R, Wang C H. 2017. Bioenergy application of Dunaliella salina SA 134 grown at various salinity levels for lipid production. Scientific Reports, 7(1): 8118.
DOI:10.1038/s41598-017-07540-x |
Akça Y, Samsunlu E. 2012. The effect of salt stress on growth, chlorophyll content, proline and nutrient accumulation, and K/Na ratio in walnut. Pakistan Journal of Botany, 44(5): 1513-1520.
|
Alam A, Ullah S, Alam S, Shah H U, Aftab S, Siddiq M, Manzoor N. 2015. Influence of culture media and carbon sources on biomass productivity and oil content of the algae Sirogonium sticticum, Temnogyra reflexa, Uronema elongatum, and Chroococcus turgidus. Turkish Journal of Botany, 39(4): 599-605.
DOI:10.3906/bot-1405-16 |
BenMoussa-Dahmen I, Chtourou H, Rezgui F, Sayadi S, Dhouib A. 2016. Salinity stress increases lipid, secondary metabolites and enzyme activity in Amphora subtropica and Dunaliella sp.for biodiesel production. Bioresource Technology, 218: 816-825.
DOI:10.1016/j.biortech.2016.07.022 |
Bleakley S, Hayes M. 2017. Algal proteins:extraction, application, and challenges concerning production. Foods, 6(5): 33.
DOI:10.3390/foods6050033 |
Boland M J, Rae A N, Vereijken J M, Meuwissen M P M, Fischer A R H, Van Boekel M A J S, Rutherfurd S M, Gruppen H, Moughan P J, Hendriks W H. 2013. The future supply of animal-derived protein for human consumption. Trends in Food Science & Technology, 29(1): 62-73.
DOI:10.1016/j.tifs.2012.07.002 |
Bonomelli C, Celis V, Lombardi G, Mártiz J. 2018. Salt stress effects on avocado (Persea americana Mill.) plants with and without seaweed extract (Ascophyllum nodosum)application. Agronomy, 8(5): 64.
DOI:10.3390/agronomy8050064 |
Bradford M M. 1976. A rapid and sensitive method for the quantitation of microgram quantities of protein utilizing the principle of protein-dye binding. Analytical Biochemistry, 72(1-2): 248-254.
DOI:10.1016/0003-2697(76)90527-3 |
Brányiková I, Maršálková B, Doucha J, Brányik T, Bišová K, Zachleder V, Vítová M. 2011. Microalgae-novel highly efficient starch producers. Biotechnology and Bioengineering, 108(4): 766-776.
DOI:10.1002/bit.23016 |
Chinnasamy S, Bhatnagar A, Hunt R W, Das K C. 2010. Microalgae cultivation in a wastewater dominated by carpet mill effluents for biofuel applications. Bioresource Technology, 101(9): 3097-3105.
DOI:10.1016/j.biortech.2009.12.026 |
Chiu L D, Ho S H, Shimada R, Ren N Q, Ozawa T. 2017. Rapid in vivo lipid/carbohydrate quantification of single microalgal cell by Raman spectral imaging to reveal salinity-induced starch-to-lipid shift. Biotechnology for Biofuels, 10: 9.
DOI:10.1186/s13068-016-0691-y |
Church J, Hwang J H, Kim K T, McLean R, Oh Y K, Nam B, Joo J C, Lee W H. 2017. Effect of salt type and concentration on the growth and lipid content of Chlorella vulgaris in synthetic saline wastewater for biofuel production. Bioresource Technology, 243: 147-153.
DOI:10.1016/j.biortech.2017.06.081 |
Combres C, Laliberté G, Reyssac J S, De La Noüe J. 1994. Effect of acetate on growth and ammonium uptake in the microalga Scenedesmus obliquus. Physiologia Plantarum, 91(4): 729-734.
DOI:10.1111/j.1399-3054.1994.tb03012.x |
De Vries S C, Van De Ven G W J, Van Ittersum M K, Giller K E. 2010. Resource use efficiency and environmental performance of nine major biofuel crops, processed by first-generation conversion techniques. Biomass and Bioenergy, 34(5): 588-601.
DOI:10.1016/j.biombioe.2010.01.001 |
Del Río E, García-Gómez E, Moreno J, Guerrero M G, GarcíaGonzález M. 2017. Microalgae for oil.Assessment of fatty acid productivity in continuous culture by two highyield strains, Chlorococcum oleofaciens and Pseudokirchneriella subcapitata. Algal Research, 23: 37-42.
DOI:10.1016/j.algal.2017.01.003 |
Elliott D C, Biller P, Ross A B, Schmidt A J, Jones S B. 2015. Hydrothermal liquefaction of biomass:developments from batch to continuous process. Bioresource Technology, 178: 147-156.
DOI:10.1016/j.biortech.2014.09.132 |
Erdmann N, Hagemann M. 2001. Salt acclimation of algae and cyanobacteria: a comparison. In: Rai L C, Gaur J P eds.Algal Adaptation to Environmental Stresses: Physiological, Biochemical and Molecular Mechanisms.Springer, Berlin, Heidelberg. p.323-361, https://doi.org/10.1007/978-3-642-59491-5_11.
|
García N, López-Elías J A, Miranda A, Martínez-Porchas M, Huerta N, García A. 2012. Effect of salinity on growth and chemical composition of the diatom Thalassiosira weissflogii at three culture phases. Latin American Journal of Aquatic Research, 40(2): 435-440.
DOI:10.3856/vol40-issue2-fulltext-18 |
Gu N, Lin Q, Li G, Tan Y H, Huang L M, Lin J D. 2012. Effect of salinity on growth, biochemical composition, and lipid productivity of Nannochloropsis oculata CS 179. Engineering in Life Sciences, 12(6): 631-637.
DOI:10.1002/elsc.201100204 |
Guiry M D, Guiry G M. 2013. AlgaeBase. World-wide Electronic Publication, National University of Ireland, Galway. http://www.algaebase.org. Accessed on 2013.
|
Hansen E H, Munns D N. 1988. Effect of CaSO? and NaCl on mineral content of Leucaena leucocephala. Plant and Soil, 107(1): 101-105.
DOI:10.1007/BF02371550 |
Kaewkannetra P, Enmak P, Chiu T. 2012. The effect of CO2 and salinity on the cultivation of Scenedesmus obliquus for biodiesel production. Biotechnology and Bioprocess Engineering, 17(3): 591-597.
DOI:10.1007/s12257-011-0533-5 |
Khatoon H, Rahman N A, Banerjee S, Harun N, Suleiman S S, Zakaria N H, Lananan F, Abdul Hamid S H, Endut A. 2014. Effects of different salinities and pH on the growth and proximate composition of Nannochloropsis sp.and Tetraselmis sp. isolated from South China Sea cultured under control and natural condition. International Biodeterioration & Biodegradation, 95: 11-18.
DOI:10.1016/j.ibiod.2014.06.022 |
Kumari P, Kumar M, Reddy C R K, Jha B. 2014. Nitrate and phosphate regimes induced lipidomic and biochemical changes in the intertidal macroalga Ulva lactuca(Ulvophyceae, Chlorophyta). Plant and Cell Physiology, 55(1): 52-63.
DOI:10.1093/pcp/pct156 |
Lawton R J, De Nys R, Magnusson M E, Paul N A. 2015. The effect of salinity on the biomass productivity, protein and lipid composition of a freshwater macroalga. Algal Research, 12: 213-220.
DOI:10.1016/j.algal.2015.09.001 |
Li Y Q, Horsman M, Wang B, Wu N, Lan C Q. 2008. Effects of nitrogen sources on cell growth and lipid accumulation of green alga Neochloris oleoabundans. Applied Microbiology and Biotechnology, 81(4): 629-636.
DOI:10.1007/s00253-008-1681-1 |
Maathuis F J M, Amtmann A. 1999. K+ Nutrition and Na+ toxicity:the basis of cellular K+/Na+ ratios. Annals of Botany, 84(2): 123-133.
DOI:10.1006/anbo.1999.0912 |
Moisander P H, McClinton E, Paerl H W. 2002. Salinity effects on growth, photosynthetic parameters, and nitrogenase activity in estuarine planktonic cyanobacteria. Microbial Ecology, 43(4): 432-442.
DOI:10.1007/s00248-001-1044-2 |
Pancha I, Chokshi K, Mishra S. 2015. Enhanced biofuel production potential with nutritional stress amelioration through optimization of carbon source and light intensity in Scenedesmus sp.CCNM 1077. Bioresource Technology, 179: 565-572.
DOI:10.1016/j.biortech.2014.12.079 |
Pandolfi C, Azzarello E, Mancuso S, Shabala S. 2016. Acclimation improves salt stress tolerance in Zea mays plants. Journal of Plant Physiology, 201: 1-8.
DOI:10.1016/j.jplph.2016.06.010 |
Park J B K, Craggs R J, Shilton A N. 2011. Wastewater treatment high rate algal ponds for biofuel production. Bioresource Technology, 102(1): 35-42.
DOI:10.1016/j.biortech.2010.06.158 |
Rai M P, Gautom T, Sharma N. 2015. Effect of salinity, pH, light intensity on growth and lipid production of microalgae for bioenergy application. OnLine Journal of Biological Sciences, 15(4): 260-267.
DOI:10.3844/ojbsci.2015.260.267 |
Schlüter U, Crawford R M M. 2001. Long-term anoxia tolerance in leaves of Acorus calamus L. and Iris pseudacorus L. Journal of Experimental Botany, 52(364): 2213-2225.
DOI:10.1093/jexbot/52.364.2213 |
Siaut M, Cuiné S, Cagnon C, Fessler B, Nguyen M, Carrier P, Beyly A, Beisson F, Triantaphylidès C, Li-Beisson Y, Peltier G. 2011. Oil accumulation in the model green alga Chlamydomonas reinhardtii:characterization, variability between common laboratory strains and relationship with starch reserves. BMC Biotechnology, 11: 7.
DOI:10.1186/1472-6750-11-7 |
Sudhir P, Murthy S D S. 2004. Effects of salt stress on basic processes of photosynthesis. Photosynthetica, 42(4): 481-486.
DOI:10.1007/S11099-005-0001-6 |
Talebi A F, Mohtashami S K, Tabatabae M, Tohidfar M, Bagheri A, Zeinalabedini M, Mirzaei H H, Mirzajanzadeh M, Shafaroudi S M, Bakhtiari S. 2013. Fatty acids profiling:a selective criterion for screening microalgae strains for biodiesel production. Algal Research, 2(3): 258-267.
DOI:10.1016/j.algal.2013.04.003 |
Tang D H, Han W, Li P L, Miao X L, Zhong J J. 2011. CO2 biofixation and fatty acid composition of Scenedesmus obliquus and Chlorella pyrenoidosa in response to different CO2 levels. Bioresource Technology, 102(3): 3071-3076.
DOI:10.1016/j.biortech.2010.10.047 |
Tran H L, Kwon J S, Kim Z H, Oh Y, Lee C G. 2010. Statistical optimization of culture media for growth and lipid production of Botryococcus braunii LB572. Biotechnology and Bioprocess Engineering, 15(2): 277-284.
DOI:10.1007/s12257-009-0127-7 |
Wellburn A R, Lichtenthaler H. 1984. Formulae and program to determine total carotenoids and chlorophylls a and b of leaf extracts in different solvents. In: Sybesma C ed.Advances in Photosynthesis Research. Springer, Dordrecht. p.9-12, https://doi.org/10.1007/978-94-017-6368-4_3.
|
Yamaguchi S, Motokura K, Tanaka K, Imamura S. 2017. Catalytic processes for utilizing carbohydrates derived from algal biomass. Catalysts, 7(5): 163.
DOI:10.3390/catal7050163 |
Yang Y Q, Guo Y. 2018. Elucidating the molecular mechanisms mediating plant salt-stress responses. New Phytologist, 217(2): 523-539.
DOI:10.1111/nph.14920 |