Institute of Oceanology, Chinese Academy of Sciences
Article Information
- WANG Qingye
- The identified 30-50-day variation in the subthermocline current east of Mindanao
- Journal of Oceanology and Limnology, 38(5): 1354-1367
- http://dx.doi.org/10.1007/s00343-020-0021-x
Article History
- Received Jan. 15, 2020
- accepted in principle Feb. 12, 2020
- accepted for publication Apr. 16, 2020
2 Qingdao National Laboratory for Marine Science and Technology, Qingdao 266000, China;
3 Center for Ocean Mega-Science, Chinese Academy of Sciences, Qingdao 266071, China
The Pacific low-latitude western-boundary currents played an important role in heat budget of the western Pacific warm pool and modulated El Niño-Southern Oscillation (ENSO) (e.g., Lukas et al., 1996). Moreover, they also convey extratropical water masses equatorward and contribute to global thermohaline circulation (e.g., Fine et al., 1994).
In the upper ocean, the Mindanao Current (MC) is a strong, about 200-km-wide southward current east of Mindanao with velocity maximum of ~100 cm/s (Lukas et al., 1991; Wijffels et al., 1995). Some of the MC feeds the Indonesian Throughflow through the Sulawesi Sea and the rest returns eastward to feed the North Equatorial Countercurrent (Kashino et al., 2001). Based on the mooring observations at 6°50′N, 126°43′E east of Mindanao, Kashino et al. (2005) reported that the MC variations at the intraseasonal, seasonal, and interannual timescales are of comparable, and the MC is strong in boreal summers and at the onset of El Niño.
For the subthermocline current (defined here as the current below approximately 400 m) east of Mindanao, some scientists thought it is a northward current, the Mindanao Undercurrent (Hu et al., 1991; Qu et al., 2012; Wang et al., 2015), but Kashino et al. (2015) preferred it should be part of anticyclonic eddy by analyzing recent current data of two moorings at 7°N. Recently, the intraseasonal variability (ISV) in period of 50–100 days has been thought to be a dominant component in the subthermocline current east of Mindanao by analyzing a current meter at a 700-m depth at 6°50′N, 126°43′E (Kashino et al., 2005), a subsurface mooring at 8°N/127°E (Zhang et al., 2014; Kashino et al., 2015) and a high-resolution eddyresolving model (Qu et al., 2012; Chiang et al., 2015). The ISV of subthermocline current east of Mindanao was explained as the propagation of subthermocline eddies (Firing et al., 2005; Chiang and Qu, 2013; Wang et al., 2014b; Zhang et al., 2014; Chiang et al., 2015), and it was associated with subthermocline eddies originated in different propagation pathways. Based on a high-resolution model of Oceanic General Circulation Model (OGCM) for the Earth Simulator (OFES), Chiang and Qu (2013) revealed that the northwestward propagating subthermocline eddies with a 50–60-day period can reach the Mindanao coast. Zhang et al. (2014) analyzed the simulated meridional velocities at 8°N from the OFES outputs and thought that the ISV of the subthermocline current is closely related to the westward propagating subthermocline eddies at ~8°N. Wang et al. (2014b) used 3-day OFES data output to identify the eddy at intermediate water depth directly and found the subthermocline eddies from the North Equatorial Current (NEC) at about 8°N–11°N contribute more to the ISV. Chiang et al. (2015) also supports the role of subthermocline eddies propagating from east in 50–80-day timescale, and suggested that these eddies were generated by meridional movement of the NEC, North Equatorial Undercurrent (NEUC), and topography.
In all, subthermocline current east of Mindanao has significant ISV at a typical period of 60–80 days, and it is related to propagation of subthermocline eddies from different pathways caused by barotropic and/or baroclinic instability (Wang et al., 2014b; Chiang et al., 2015). The ISV of subthermocline current east of Mindanao is very complex, and it may be associated with instabilities and/or eddy-eddy interaction (Kashino et al., 2015). In this study, a new intraseasonal variability at ~30–50 day band in the subthermocline current east of Mindanao was revealed by analyzing nearly 4 year-long moored velocity measurements at 8°N/127°E, and investigated its characteristics and possible dynamics.
2 DATA AND METHOD 2.1 DataTo observe Pacific low-latitude western boundary currents, a subsurface mooring was supported by the Northwestern Pacific Ocean Circulation and Climate Experiment (NPOCE) international program and deployed at 8°N/127°E (water depth: 6 100 m, see Fig. 1 in Zhang et al., 2014 for station position) east of Mindanao from December 1, 2010 to August 28, 2014. Two 75-kHz ADCPs were mounted through a main float on the mooring at a depth of ~400 m in order to collect the current data from surface to ~800 m depth. The two ADCPs measured current velocity hourly in 60 bins in bin size of 8 m. The raw data were first averaged to generate daily data and then vertically interpolated to 10-m vertical resolution from surface to 760-m depth.
|
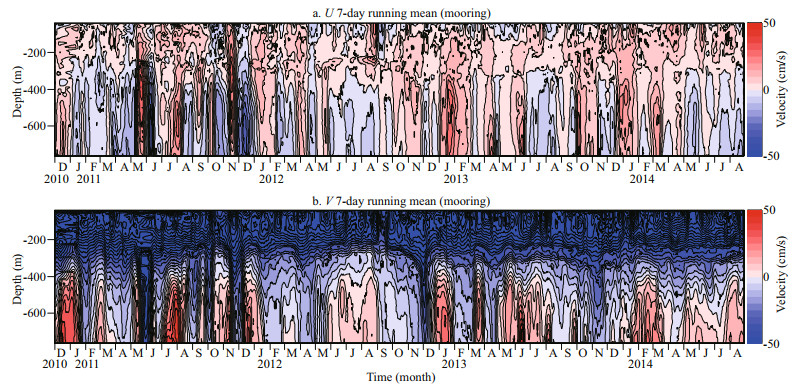
| Fig.1 Time-depth plot of mooring observed zonal (a) and meridional (b) velocities (cm/s) at 8°N/127°E The data have been smoothed by 7-day running mean. The northward and eastward velocities are positive. |
A global HYbrid Coordinate Ocean Model (HYCOM) was configured in Mercator grid between 78°S and 47°N (1/12° equatorial resolution) in 32 vertical layers. The bottom topography is from the quality-controlled NRL DBDB2 dataset (http://www7320.nrlssc.navy.mil/DBDB2_WWW). The wind stress, wind speed, heat flux (using bulk formula), and precipitation are all from the Navy Operational Global Atmospheric Prediction System (NOGAPS). The raw model outputs were vertically interpolated to 33 standard z-levels from surface to 5 500 m. Daily outputs over the period of 2010-2014 were obtained from the website https://www.hycom.org/dataserver/gofs-3pt0/analysis.
In addition, the temperature and salinity data in 0.25° resolution from World Ocean Atlas 2013 version 2 (WOA13 V2) (https://www.nodc.noaa.gov/OC5/woa13) were used to calculate geostrophic current at mooring station for comparison with direct measurement of mooring.
2.2 MethodThe ISV signal of daily current velocity from mooring observation and HYCOM outputs were extracted by applying a 30–50-day or 60–80-day band-pass four-order Butterworth filter. The power spectrum and Empirical Orthogonal Function (EOF) were applied for data analysis.
The eddy detection algorithm by Nencioli et al. (2010) was used in this study to identify and track ocean eddies based on the geometry of the velocity vectors. In this method, four constraints are firstly used to determine the eddy centers, eddy boundaries are determined by stream function field, and finally the identified eddies are tracked by connecting eddy centers within a specified searching area at successive time steps. For more details, please refer to Nencioli et al. (2010).
3 RESULT 3.1 The mean current vector from mooring observationThe 7-day running mean for daily velocity in the 40–760 m as observed by the ADCPs on the subsurface mooring from 1 December 2010 to 28 August 2014 is shown in Fig. 1. In the upper approximately 400 m, the MC flows toward south-southeast and is very stable. Its zonal velocity was generally eastward and less than 15 cm/s in observation period (duration 1 367 days) and its meridional velocity was very strong and the maximum meridional velocity reaching 144 cm/s at depth of 50 m on 20 January 2014 (Fig. 1a & b).
However, the subthermocline current (below 400 m) had significant fluctuations in both zonal and meridional directions. The zonal and meridional current directions changed once every 1–3 months. During 2013–2014, for examples, the eastward subthermocline current occurred in January–February 2013, April 2013, June 2013, October 2013, January 2014, and March–April, 2014, and the northward subthermocline current became stronger in January 2013, March 2013, May–July 2013, September, 2013, January–March 2014, and May–June, 2014 and August, 2014 (Fig. 1a & b). The maximum northward velocity was over 54 cm/s, occurring at 710 m on 14 June 2013 (Fig. 1b).
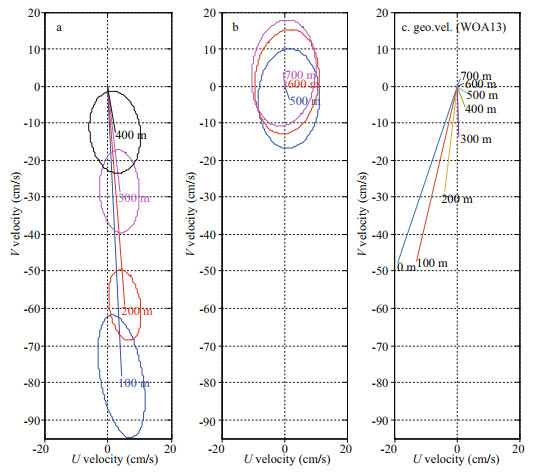
The mean and standard deviations (ellipse) of the daily current velocity at different depths also show the stable MC in the upper 400 m and the fluctuated subthermocline current below 400 m (Fig. 2a & b). The mean MC is about 78 cm/s at 100-m depth and reduced to about 13 cm/s at 400-m depth (Fig. 2a). The standard deviations of the MC in the upper 400 m were 5–15 cm/s and much less than the mean velocity speeds (Fig. 2a), suggesting that the MC is a stable current (Kashino et al., 2005).
|
| Fig.2 The averages (arrows) and standard deviations (ellipses) of observed daily current velocity (cm/s) at different depths a. 100, 200, 300, and 400 m; b. 500, 600, 700 m; c. the mean geostrophic current vector (cm/s) from 0 m to 700 m at 8°N/127°E calculated from WOA13. |
Different from the stable MC, the variation of the subthermocline current was much larger than its mean current speed. In other words, the mean current vectors of subthermocline current below 400 m are included in their ellipses (Fig. 2b). The mean current speed below 500 m was less than 5 cm/s and the maximum northward velocity component is ~4.4 cm/s at 760 m. However, the standard deviations of both the zonal and meridional velocities could reach ~10–14 cm/s (Fig. 2b).
In vertical direction, the mean currents at this mooring station (8°N/127°E) during the observation period, gradually changed the direction anticlockwise with increasing depth. The mean current directions (relative to north) at depths of 100, 400, 500, 600, and 700 m were 177°, 169°, 156°, 35°, and 358°, respectively (Fig. 2a & b). The mean zonal current was 1–5 cm/s in upper 700 m, but the southward velocity decreased rapidly and changed into northward velocity in deeper levels of intermediate water. Interestingly, based on about 8-month mooring observation east of Luzon at 18°N/122.6°E, the mean current directions also gradually rotated anticlockwise with the depth increase (Wang et al., 2014a). The stable Kuroshio was northwestward (340°–350°) at 220–350 m depth, and becomes relative stable Luzon undercurrent (LUC) was southwestward (193°–200°) at 580–684 m depth.
To understand the mechanism of the anticlockwise rotation in current direction with depth, the annual mean temperature, and salinity field in horizontal resolution of 0.25° from WOA13 V2 were used to calculate geostrophic current relative to 1 500 m reference level at mooring station. Although there are some differences in the direction and magnitude of the upper current, the characteristics of anticlockwise rotations of the mean geostrophic current vectors from surface to 700 m was very typical (Fig. 2c). Therefore, it is reasonable that the cyclonic change of current vectors with depth should be related to the ocean current beta spiral associated with dynamic height field calculated from local hydrographic distribution. In fact, the horizontal geostrophic current field calculated from WOA13 V2 shows that the NEC, the Mindanao eddy (ME), and Halmahera eddy (HE) all shift northward with increasing depth east of Philippines, which supported previous studies (Qu and Lukas, 2003; Kashino et al., 2013). The centers of the ME (HE) are located at about 7.6°N (3.5°N) at 200 m, 10.4°N (5°N) at 400 m, and 13.5°N (5.5°N) at 600 m, and below 400 m depth exists a significant eastward current, the NEUC (Qiu et al., 2013).
In addition to the MC and Kuroshio east of Luzon, mean vertical structures of the two western boundary currents in the South Pacific (Great Barrier Reef Undercurrent and East Australian Current), and of the NEC and South Equatorial Current in the Pacific were also examined. All of the four currents exhibit typical beta spiral (figure not shown). However, interestingly it is clockwise rotation for their mean geostrophic current vectors from surface to deeper ocean, which is different from anticlockwise rotation in the MC and the Kuroshio east of Luzon. Therefore, the rotation of the currents with increasing depth may be due to the beta spiral. More examinations for other ocean currents and related physical interpretation will be studied in the future.
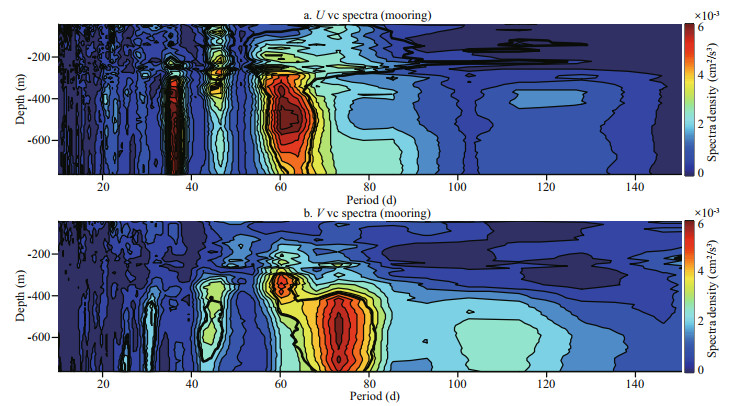
3.2 The 30–50-day variation from mooring observation and modelThe depth-independent power spectrums of the current velocity with 95% confidence level (Fig. 3) show that intraseasonal components were stronger in subthermocline current than in the MC. Two significant ISVs with peak periods of about 62 days and 36 days existed in zonal subthermocline current (Fig. 3a), and significant ISVs with peak periods of about 73, 45, and 31 days existed in meridional subthermocline current (Fig. 3b). Therefore, two intraseasonal variabilities in 60–80-day bands and in 30–50-day bands were very significant in the subthermocline current in both zonal and meridional directions. In this study, they are called as the 60–80-day and 30–50-day variations.
|
| Fig.3 Variance-conserving spectra of daily velocity profiles from mooring observation a. zonal direction; b. meridional direction. The thick lines indicate the 95% confidence level. |
The 60–80-day variation had ever been revealed by the subsurface mooring observations at 8°N (Wang et al., 2014b; Zhang et al., 2014) and at 7°N (Kashino et al., 2015) and was speculated to be associated with eddy propagation. Recently, some researchers used OFES data and found that subthermocline eddies can propagate westward along about 8°N–10°N and can cause 50–80-day variation east of Mindanao (Wang et al., 2014b; Chiang et al., 2015; Kashino et al., 2015). By direct tracking ocean eddy below thermocline, Wang et al. (2014b) suggested that subthermocline eddies from the NEC, from the east along 8°N, and from the New Guinea coast contributed the ISV of subthermocline current east of Mindanao. Based on OFES data, Chiang et al. (2015) discovered two groups of subthermocline eddies near the Philippine coast, of which one from the east had a typical period of 67 days and a propagation speed of 12 cm/s; and they suggested that westward propagating eddies was generated resulted from the interactions among the NEC, the NEUC, and topography. Because of the 60–80-day variation has been well studied, in this study, it was not focused on but used to compare the 30–50-day variation.
However, the 30–50-day variation has never been reported in previous studies. In the following part, the existence of the 30–50-day variation is examined and the temporal and spatial characteristics are analyzed and compared with those of the 60–80-day variation. The power spectrum (Fig. 3) indicates that the 60–80-day variation in meridional current was stronger than that in zonal current, but the 30–50-day variation in zonal current was stronger than that in meridional current.
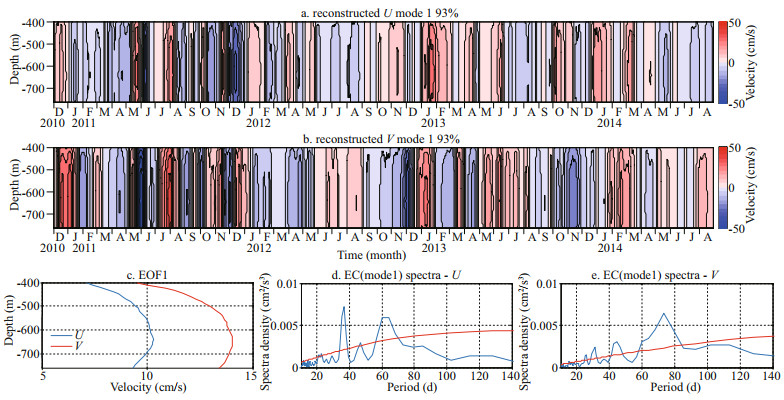
The two intraseasonal signals were also identified by the EOF analysis on the observed current below 400 m. Figure 4 shows the reconstructed current based on the first mode, the spatial patterns and power spectrum analysis to the time series of the first mode. The first EOF modes of both zonal and meridional subthermocline current explain 93% variance, indicating that the subthermocline currents were in vertical coherence. Moreover, it is reasonable that the reconstructed subthermocline currents are well consistent with original observations (Fig. 4a & b). The meridional variation (10–14 cm/s) of subthermocline currents was stronger than the zonal one (7–10 cm/s), and the strongest variation occurred at about 650 m depth (Fig. 4c). The two time series of first EOF mode for both zonal and meridional current clearly show the 60–80-day and 30–50-day intraseasonal variation (Fig. 4d & e), and the relative magnitudes of two intraseasonal signals in zonal and meridional directions are consistent with those from original power spectrum analysis shown in Fig. 3. Therefore, it was concluded that the 30–50-day intraseasonal variations did exist in the subthermocline currents east of Mindanao.
|
| Fig.4 The reconstructed zonal (a) and meridional (b) velocities (cm/s) based on the first EOF mode and the EOF spatial pattern (c); the power spectrum (blue line) with 95% confidence (red line) of the first EOF mode time series for original zonal (d) and meridional (e) currents The reconstructed fields in (a, b) are superimposed on corresponding spatial-mean fields. |
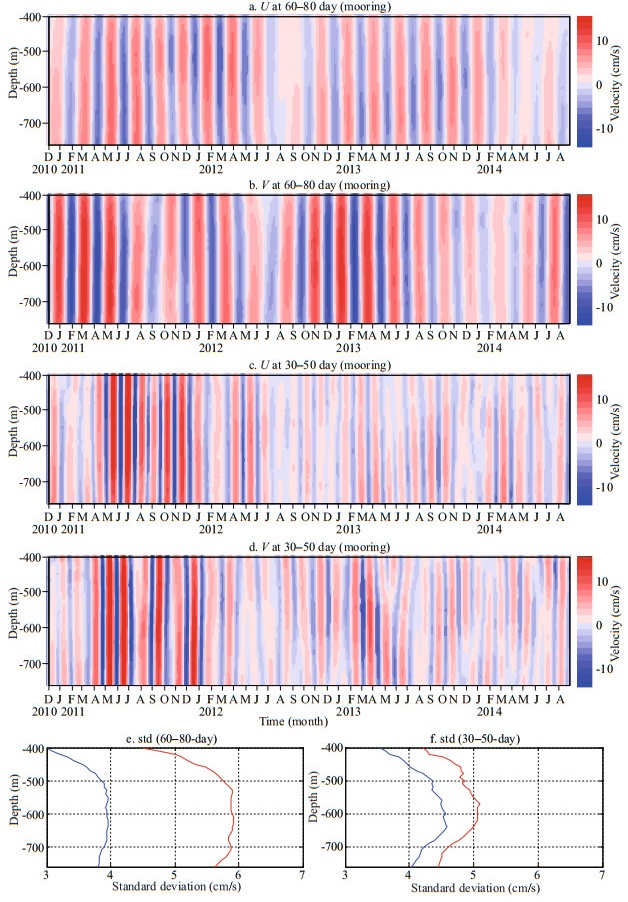
To explore the spatial and temporal characteristics of the two intraseasonal signals in the subthermocline current, the 60–80-day and 30–50-day variations of subthermocline current were extracted with fourorder Butterworth band-passed filter in periods of 60–80 days and 30–50 days, and their standard deviations were calculated (Fig. 5). In vertical direction, both the 60–80-day signal and the 30–50-day signal below 400 m had the same phases and nearly the same magnitudes (Fig. 5a & b). However, during the observation period, their variation magnitudes were different. For example, the 60–80-day signal was stronger in boreal winter and spring, but the 30–50-day signal was much stronger in 2011 (Fig. 5). The 60–80-day signal and the 30–50-day signal were also stronger in 2011 and 2013, indicating interannual variability of these two signals. Wavelet analysis for the velocities below 400 m (figure not shown) supported their interannual variabilities. The standard deviations of 60–80-day variation in zonal and meridional directions were about 4 cm/s and 6 cm/s in 500–760 m depth, respectively (Fig. 5e), but those of 30–50-day variation in zonal and meridional directions are comparable in 500–700 m depth, about 4.5–5 cm/s (Fig. 5f). Therefore, 30–50-day signal is also a very important component in the subthermocline current east of Mindanao. In the following contexts, the 30–50-day variation is focused on and its characteristics and related processes are studied by ocean observation and model outputs.
|
| Fig.5 Time-depth plot of the 60–80-day (a, b) and 30–50-day (c, d) variation (cm/s) of zonal (a, c) and meridional (b, d) velocities; the standard deviation (cm/s) of 60–80-day (e) and 30–50-day (f) variations of zonal (blue) and meridional (red) velocities |
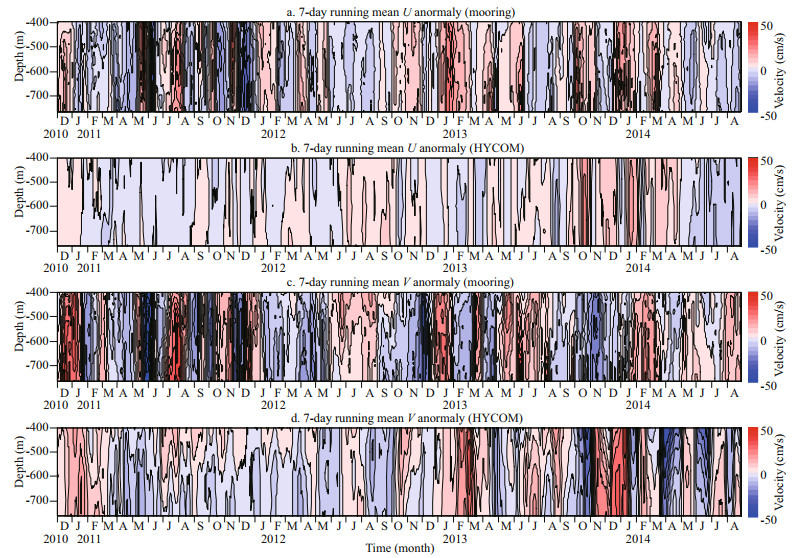
In this research, a high-resolution HYCOM outputs were also used to further clarify the 30–50-day variation. Note that this study used HYCOM outputs but not OFES outputs (Wang et al., 2014b). Comparing the power spectra of the current and wavelet analyses for the subthermocline current at 8°N/127°E from HYCOM/OFES outputs with those from mooring observations (figure not shown), HYCOM outputs were found more consistent with mooring observations, and stronger intraseasonal variability below the 400 m and the 30–50-day variation could be simulated by HYCOM. Figure 6 shows the comparison of subthermocline current anomalies at 8°N/127°E between mooring observation and ocean simulation. Although simulated currents are weaker than moored currents, simulated current are generally consistent with observation and large fluctuations in subthermocline current were reproduced. For example, the positive anomalies in zonal direction occurred in April 2013, June 2013, October 2013, January 2014, and March 2014; and those in meridional direction occurred in December 2010, February/March 2011, July 2011, September 2011, and November 2011 (Fig. 6).
|
| Fig.6 Comparison of 7-day running mean zonal (a, b) and meridional (c, d) velocity anomalies (cm/s) between mooring observation (a, c) and HYCOM outputs (b, d) from December 1, 2010 to August 28, 2014 |
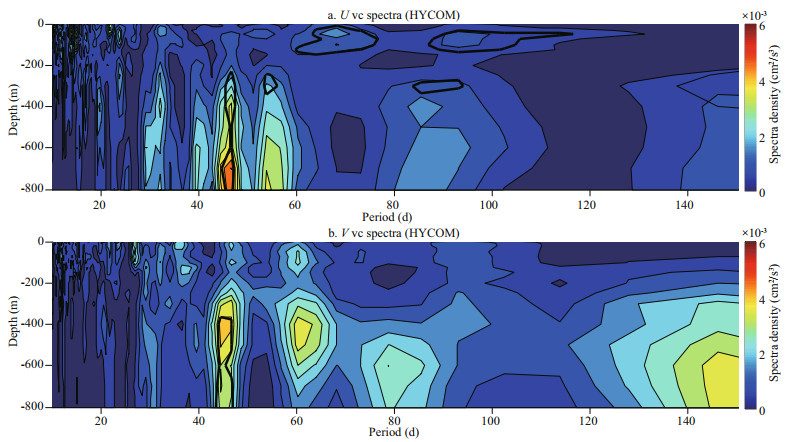
Figure 7 shows the power spectrum for the simulated subthermocline currents. Both zonal and meridional currents were dominated in about 45-day variation (Fig. 7), which supported the 30–50-day variation identified from mooring observation. Note that the 60–80-day variation was not significant in simulated currents at 8°N/127°E.
|
| Fig.7 Same as Fig. 3, but from HYCOM model outputs |
In summary, comparing with the 60–80-day variation reported in previous studies, the 30–50-day variation is a robust intraseasonal signal. It is vertically coherent from 400 m to 800 m, and the components in zonal and meridional subthermocline current are of comparable (Fig. 5f).
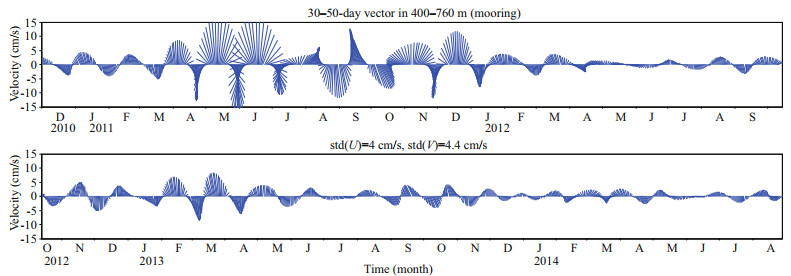
4 DISCUSSIONIn this section, the possible mechanism about the 30–50-day variation is analyzed and discussed. The velocity vectors averaged in 400–760 m of the 30–50-day variation are shown in Fig. 8. The standard deviations of the 30–50-day variation in zonal and meridional were 4.0 cm/s and 4.4 cm/s respectively. A significant feature of the intraseasonal signal was clockwise rotation of their current vectors usually occurring during the observation period. For example, the 30–50-day currents also gradually rotated clockwise during March 2011 to July 2011, and during November 2011 to March 2013. The typical clockwise rotation suggests that it may be related to eddy activity near the Mindanao coast.
|
| Fig.8 Observed 30–50-day current vectors as averaged at a depth of 400–760 m |
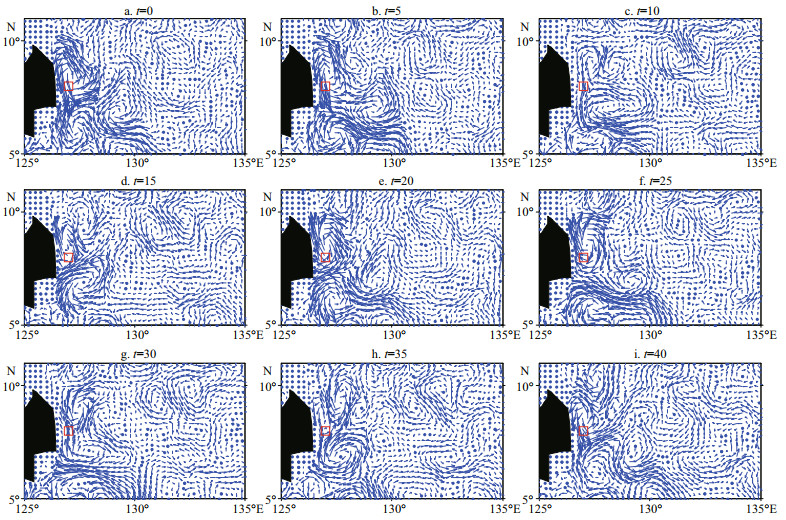
To explore whether the ocean eddies cause the 30–50-day variation, the 30–50-day zonal/meridional velocity components were extracted using the daily zonal/meridional velocities from HYCOM simulation during mooring observation interval, and consequently they were used to calculate the relative vorticity field. Figure 9 shows the average of the 30–50-day current vectors at the moments when the 30–50-day vorticity at 8°N/127°E was greater than one standard deviation and the evolutions after that moment. The evolution field in a typical period (~45 day, Fig. 7) clearly showed the eddy activities near the Mindanao. At the mooring station, a cyclonic eddy was located at the mooring station (Fig. 9a). Due to the Mindanao Island, the western half of this eddy was gradually dissipated in the following 10 days (Fig. 9b & c), and it was replaced by an anticyclonic eddy after ~20–25 days (Fig. 9e & f). Similarly, the anticyclonic eddy also gradually disappeared because of friction (Fig. 9e & g) and a cyclonic eddy was reconstructed (Fig. 9h–i). Therefore, the 30–50-day variation is much closely related to the ocean eddy activities near the Mindanao.
|
| Fig.9 Average of the 30–50-day current vector at the moments when the 30–50-day relative vorticity at 8°N/127°E was greater than one standard deviation (a) and 5 days (b), 10 days (c), 15 days (d), 20 days (e), 25 days (f), 30 days (g), 35 days (h), and 40 days (i) after the moments, respectively The mooring station (8°N/127°E) is marked as a red square. |
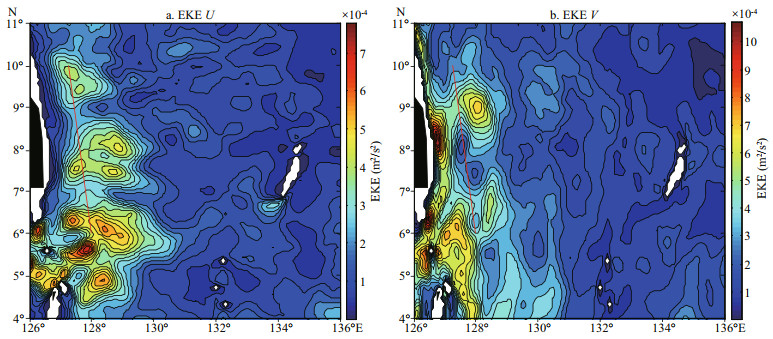
Previous studies also suggested that the 60–80-day variation in the subthermocline current east of Mindanao is because of the ocean eddies. Three different pathways for eddy propagation was identified by the eddy kinetic energy (EKE) distribution and eddy tracking method (Wang et al., 2014b). Here the EKE due to 30–50-day variation was calculated and shown in Fig. 10. Near the Mindanao coast, the zonal EKE component (1/2(U30–50-day)2) indicated a high value region located about 128°E from 6°N to 10°N, which is well consistent with the low minimum region in the meridional EKE component (1/2(V30–50-day)2). According to the schematic diagram (Chiang and Qu, 2013; see their Fig. 6), the EKE distribution (Fig. 10) depicts the existence of ocean eddies activities, and the eddy center was located at ~128°E. Therefore, the EKE distribution also supports that the 30–50-day variation is much closely related to the ocean eddies activities near the Mindanao.
|
| Fig.10 The zonal (a) and meridional (b) components of EKE (m2/s2) for the 30–50-day variation Red line indicates possible pathways of the eddies. |
To understand the characteristics of the 30–50-day variation and its difference from the 60–80-day variation, ocean eddies in the region from 3°S to 15°N and from 122°E to 144°E were identified and tracked based on daily model outputs. The eddy detection algorithm presented by Nencioli et al. (2010) was used in this study and it can detect ocean eddies entirely from the geometry of the velocity vectors. The 30–50-day and 60–80-day velocity vectors during the mooring period were extracted from the modeled velocity field and they were averaged in 400–800 m for eddy-tracking.
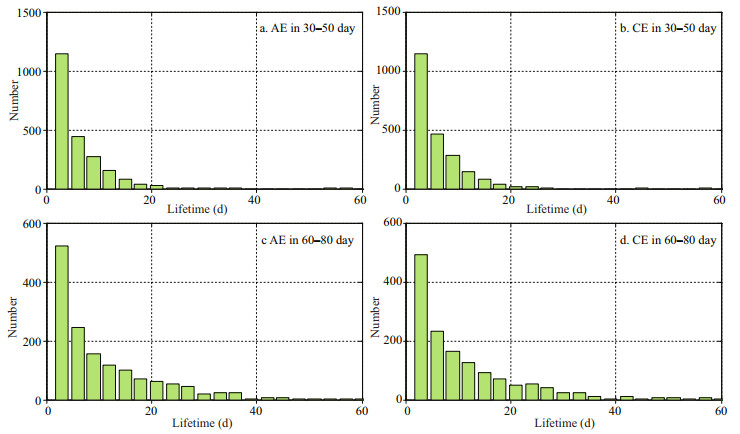
Figure 11 shows the statistics of the eddy number and lifetime. The anticyclonic eddies and cyclonic eddies associated with the 30–50-day variation were more than that associated with the 60–80-day variation, but the lifetime of the former was much shorter than that of the latter. Most of the eddies related to the 30–50-day variation could not live for more than 30 days. The eddy diameter associated with the 30–50-day variation was generally 80–90 km, which is a little less than that associated with the 60–80-day variation (Fig. 12).
|
| Fig.11 The number vs. lifetime (days) for all anticyclonic (a, c) and cyclonic (b, d) eddies associated with the 30–50-day (a, b) and 60–80-day (c, d) variations AE: anticyclonic eddies; CE: cyclonic eddies. |

|
| Fig.12 The mean diameter (km) vs. lifetime (days) for all anticyclonic (a, c) and cyclonic (b, d) eddies associated with the 30–50-day (a, b) and 60–80-day (c, d) variations AE: anticyclonic eddies; CE: cyclonic eddies. |
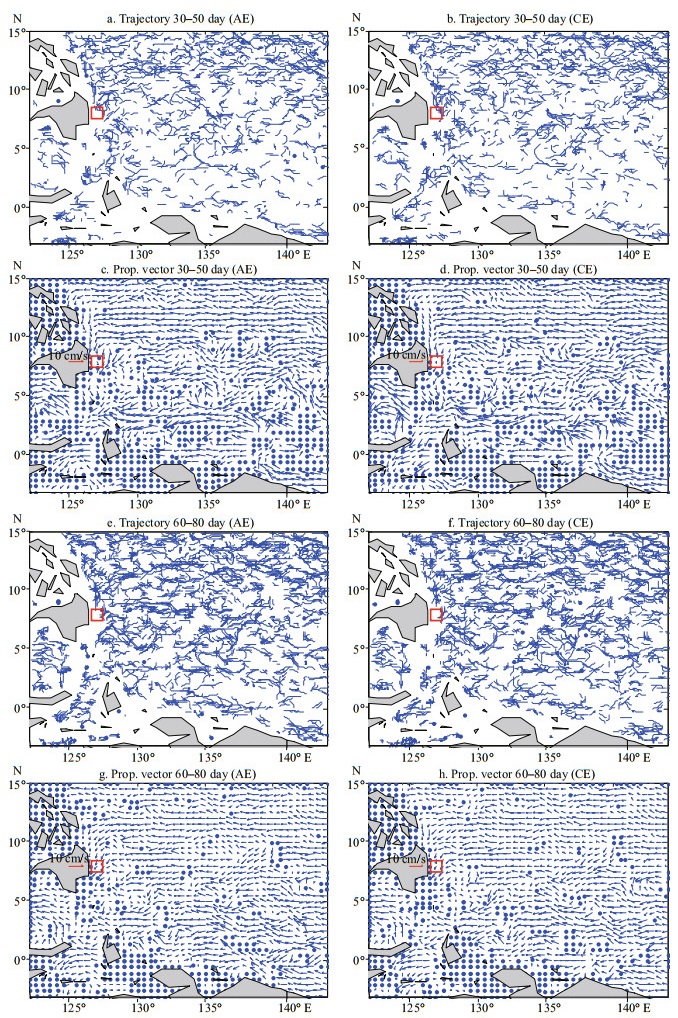
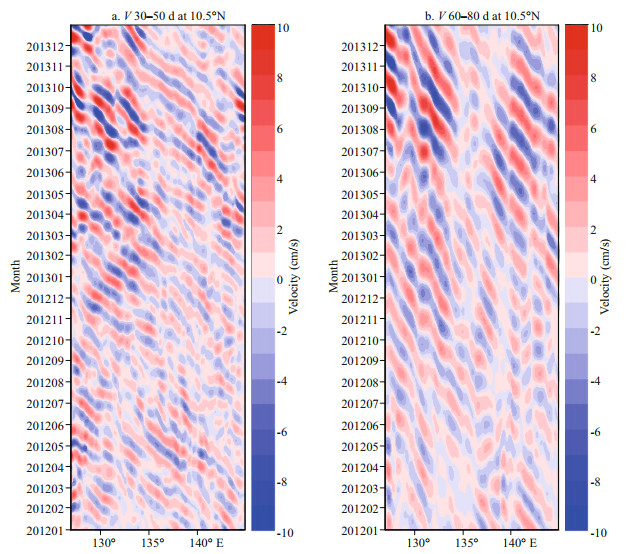
The gridded propagation vectors of the anticyclonic and cyclonic eddies are shown in Fig. 13. Ocean eddies generally propagate westward and the advection of mean currents (e.g., the NEC) can affect their movement. Both the 30–50-day and 60–80-day variations can be caused by ocean eddies originated from the NEC. The mesoscale eddies propagating westward along about 10°N–11°N reach the Philippines coast and continue to move southward, which greatly contribute to the intraseasonal variability of the subthermocline current east of Mindanao. However, the mean propagation speed (7.7 cm/s) of the eddies associated with the 30–50-day variation was larger than that (5.7 cm/s) of the eddies associated with the 60–80-day variation (Fig. 13).
|
| Fig.13 Trajectories (a, b) and gridded propagation vectors (c, d) of all anticyclonic (a, c) and cyclonic (b, d) eddies during mooring intervals as identified from the 30–50-day variation averaged in 400–800 m; e, f, g, h: the same as a, b, c, d but for the 60–80-day variation The mooring station is indicated by a red square. AE: anticyclonic eddies; CE: cyclonic eddies. |
The westward-propagating eddies with different speeds were also indicated by the Hovmöller diagrams of the 30–50-day and 60–80-day band-passed filtered meridional velocity along 10.5°N. As shown in Fig. 14, they took about 9 months for the 30–50-day signal propagating from 145°E to 127°E, but about 14 months for the 60–80-day signal. The estimated propagation speeds from Fig. 14 is also well consistent with the results of eddy-tracking shown in Fig. 13.
|
| Fig.14 Hovmöller diagrams of the 30–50-day (a) and 60–80-day (b) meridional velocity (cm/s) in 400–800 m from 2012 to 2013 (2 years as an example) along 10.5°N |
Therefore, the ocean eddies originated from the NEC (10°N–11°N) contribute much to the 30–50-day and the 60–80-day variations. It is still unknown how the 30–50-day eddies were generated. Two possible energy sources related to generation mechanism should be considered. One is from ocean dynamic instability caused by mean current (the NEC/NEUC) or interaction between mean current and topography, which explains the 70-day eddy activities near the Philippine coast (Chiang et al., 2015). The other is from the atmosphere forcing (e.g., the 40–50-day Madden-Julian Oscillation, Madden and Julian, 1971). Further analysis for the 30–50-day variation will be studied in the future.
5 CONCLUSIONA subsurface mooring deployed at 8°N/127°E east of Mindanao from December 1, 2010 to August 28, 2014 recorded the evolution of western boundary current, especially the subthermocline current. Based on the current time series records and the same period HYCOM data, a new significant intraseasonal components in the subthermocline current was revealed, and its characteristics and possible mechanism were investigated. The important results are summarized as follows.
In addition to the 60–80-day variation, for the first time the 30–50-day variation in the subthermocline currents east of Mindanao was revealed. The 30–50-day variation is also a very important component in the subthermocline current east of Mindanao, and it explains considerable variance same as that of the 60–80-day variation.
The 30–50-day variation is vertically coherent in the subthermocline current. The standard deviations of the 30–50-day variation in zonal and meridional directions were of comparable, and was 4.5–5 cm/s.
Eddy-tracking analysis indicated that ocean eddies originating from the NEC (10°N–11°N) contributed to the 30–50-day and the 60–80-day variations. The 30–50-day eddies propagated faster than the 60–80-day eddies.
6 DATA AVAILABILITY STATEMENTThe mooring data used in this study are available from the corresponding author on reasonable request. The HYCOM data and WOA13 for this paper are available respectively from the Asian-Pacific DataResearch Center (http://tds.hycom.org/thredds/dodsC/GLBa0.08/) and National Oceanographic Data Center (NODC) (https://www.nodc.noaa.gov/OC5/woa13).
7 ACKNOWLEDGMENTThe mooring near Mindanao coast was deployed and recovered by the Institute of Oceanology, Chinese Academy of Sciences during the cruise of the R/V Science 1 or R/V Science in 2010–2014. The author thanks the crews, technicians, and all participants on the all of these cruises. Comments and suggestions from two anonymous reviewers are gratefully appreciated.
Chiang T L, Qu T D. 2013. Subthermocline eddies in the western equatorial Pacific as shown by an eddy-resolving OGCM. Journal of Physical Oceanography, 43(7): 1 241-1 253.
DOI:10.1175/JPO-D-12-0187.1 |
Chiang T L, Wu C R, Qu T D, Hsin Y C. 2015. Activities of 50-80 day subthermocline eddies near the Philippine coast. Journal of Geophysical Research:Oceans, 120(5): 3 606-3 623.
DOI:10.1002/2013JC009626 |
Fine R A, Lukas R, Bingham F M, Warner M J, Gammon R H. 1994. The western equatorial Pacific:a water mass crossroads. Journal of Geophysical Research, 99(C12): 25 063-25 080.
DOI:10.1029/94JC02277 |
Firing E, Kashino Y, Hacker P. 2005. Energetic subthermocline currents observed east of Mindanao. Deep Sea Research Part Ⅱ:Topical Studies in Oceanography, 52(3-4): 605-613.
DOI:10.1016/j.dsr2.2004.12.007 |
Hu D X, Cui M C, Qu T D, Li Y X. 1991. A subsurface northward current off Mindanao identified by dynamic calculation. In:Takano K ed. Oceanography of Asian Marginal Seas. Elsevier, Amsterdam: p.359-365.
|
Kashino Y, Atmadipoera A, Kuroda Y, Lukijanto. 2013. Observed features of the Halmahera and Mindanao Eddies. Journal of Geophysical Research:Oceans, 118(12): 6 543-6 560.
DOI:10.1002/2013JC009207 |
Kashino Y, Firing E, Hacker P, Sulaiman A. 2001. Currents in the Celebes and Maluku Seas, February 1999. Geophysical Research Letter, 28(7): 1 263-1 266.
DOI:10.1029/2000GL011630 |
Kashino Y, Ishida A, Kuroda Y. 2005. Variability of the Mindanao Current:mooring observation results. Geophysical Research Letter, 32(18): L18611.
DOI:10.1029/2005GL023880 |
Kashino Y, Ueki I, Sasaki H. 2015. Ocean variability east of Mindanao:Mooring observations at 7°N, revisited. Journal of Geophysical Research:Oceans, 120(4): 2 540-2 554.
DOI:10.1002/2015JC010703 |
Lukas R, Firing E, Hacker P, Richardson P L, Collins C A, Fine R, Gammon R. 1991. Observations of the Mindanao Current during the western equatorial Pacific Ocean circulation study. Journal of Geophysical Research, 96(C4): 7 089-7 104.
DOI:10.1029/91JC00062 |
Lukas R, Yamagata T, McCreary J P. 1996. Pacific low-latitude western boundary currents and the Indonesian throughflow. Journal of Geophysical Research, 101(C5): 12 209-12 216.
DOI:10.1029/96JC01204 |
Madden R A, Julian P R. 1971. Detection of a 40-50 day oscillation in the zonal wind in the tropical Pacific. Journal of the Atmospheric Sciences, 28(5): 702-708.
DOI:10.1175/1520-0469(1971)028<0702:DOADOI>2.0.CO;2 |
Nencioli F, Dong C M, Dickey T, Washburn L, McWilliams J C. 2010. A vector geometry-based eddy detection algorithm and its application to a high-resolution numerical model product and high-frequency radar surface velocities in the southern California bight. Journal of Atmospheric and Oceanic Technology, 27(3): 564-579.
DOI:10.1175/2009JTECHO725.1 |
Qiu B, Rudnick D L, Chen S M, Kashino Y. 2013. Quasistationary North Equatorial Undercurrent jets across the tropical North Pacific Ocean. Geophysical Research Letters, 40(10): 2 183-2 187.
DOI:10.1002/grl.50394 |
Qu T D, Chiang T L, Wu C R, Dutrieux P, Hu D X. 2012. Mindanao Current/Undercurrent in an eddy-resolving GCM. Journal of Geophysical Research, 117(C6): C06026.
DOI:10.1029/2011JC007838 |
Qu T D, Lukas R. 2003. The bifurcation of the North Equatorial Current in the Pacific. Journal of Physical Oceanography, 33(1): 5-18.
DOI:10.1175/1520-0485(2003)033<0005:TBOTNE>2.0.CO;2 |
Wang F, Zang N, Li Y L, Hu D X. 2015. On the subsurface countercurrents in the Philippine Sea. Journal of Geophysical Research:Oceans, 120(1): 131-144.
DOI:10.1002/2013JC009690 |
Wang Q Y, Zhai F G, Hu D X. 2014a. Variation of Luzon Undercurrent from observations and numerical model simulations. Journal of Geophysical Research:Oceans, 119(6): 3 792-3 805.
DOI:10.1002/2013JC009694 |
Wang Q Y, Zhai F G, Wang F J, Hu D X. 2014b. Intraseasonal variability of the subthermocline current east of Mindanao. Journal of Geophysical Research:Oceans, 119(12): 8 552-8 566.
DOI:10.1002/2014JC010343 |
Wijffels S, Firing E, Toole J. 1995. The mean structure and variability of the Mindanao Current at 8°N. Journal of Geophysical Research, 100(C9): 18 421-18 435.
DOI:10.1029/95JC01347 |
Zhang L L, Hu D X, Hu S J, Wang F, Wang F J, Yuan D L. 2014. Mindanao Current/Undercurrent measured by a subsurface mooring. Journal of Geophysical Research:Oceans, 119(6): 3 617-3 628.
DOI:10.1002/2013JC009693.1 |
 2020, Vol. 38


