 2020, Vol. 38
Institute of Oceanology, Chinese Academy of Sciences
Article Information
- WANG Fujun, FENG Junqiao, WANG Qingye, ZHANG Linlin, HU Shijian, HU Dunxin
- Instability in boundary layer between the North Equatorial Current and underlying zonal jets based on mooring observations
- Journal of Oceanology and Limnology, 38(5): 1368-1381
- http://dx.doi.org/10.1007/s00343-020-0015-8
Article History
- Received Jan. 16, 2020
- accepted in principle Mar. 19, 2020
- accepted for publication Apr. 9, 2020


2 Function Laboratory for Ocean Dynamics and Climate, Qingdao National Laboratory for Marine Science and Technology, Qingdao 266000, China;
3 Center for Ocean Mega-Science, Chinese Academy of Sciences, Qingdao 266071, China
A westward flow called the North Equatorial Current (NEC), which is confined between 8°N–17°N in the surface layer of the North Pacific Ocean, is an important region for water mass exchange and mixing (e.g., Fine et al., 1994; Qu et al., 1998). The main body of the NEC is concentrated within a layer shallower than the 26.5–26.8 potential density (σθ) surfaces (Qiu et al., 2015). To the east of Mindanao Island, the NEC bifurcates into the southward-flowing Mindanao Current (MC) (e.g., Nitani, 1972; Hu and Cui, 1991; Wang et al., 2016) and the northwardflowing Kuroshio Current (KC) (e.g., Lien et al., 2014; Qiu et al., 2014; Chen et al., 2015).
On interannual timescales, NEC transport increases (decreases) during El Niño (La Niña) periods (Qiu and Lukas, 1996; Kim et al., 2004). Seasonally, the NEC is strong in spring and weak in autumn. Dynamically, the variability of the sea surface height anomaly and the NEC is attributed primarily to local winds and Rossby waves propagated from the eastern boundary of the Pacific Ocean (e.g., Qiu and Joyce, 1992; Qu et al., 2008; Kashino et al., 2009; Wang et al., 2019).
Using ocean models with high resolution and low dissipation, Richards et al. (2006) demonstrated that alternating jet-like structures occur between 30°N–55°N and in the tropics. Based on an ocean model of the North Pacific Ocean, Nakano and Hasumi (2005) found a series of zonal jets with meridional scale of 3°N–5°N. Alternating jets have also been discovered in the deep ocean following analysis of float data (Hogg and Owens, 1999). Based on profiling float temperature-salinity data, Qiu et al. (2013a and b) identified three well-defined eastwardflowing jets with velocity of 2–5 cm/s. The jets were centered around 9°N, 13°N, and 18°N within the 26.9–27.3 σθ surfaces along 130°E–135°E beneath the permanent westward-flowing NEC. Zhang et al. (2017) used direct mooring observations to reveal the existence of eastward zonal jets below the NEC at 10.5°N and 13.0°N.
Using the Archiving, Validation, and Interpretation of Satellite Oceanographic (AVISO) products, it has been shown that three regions of high variability exist in the North Pacific Ocean: the Kuroshio/Kuroshio Extension southeast of Japan, North Equatorial Countercurrent along 5°N, and the region off the Pacific coast of Central America around 11°N (Qiu, 1999). In addition, there is a regional maximum of sea surface height variability with a root mean square value of >0.10 m in the area 19°N–25°N, 135°E–175°W (Wyrtki, 1975; Aoki and Imawaki, 1996; Qiu, 1999), where the northern part of the NEC is beneath the surface eastward-flowing North Pacific Subtropical Countercurrent (STCC). The instability of the STCC-NEC system has been discussed comprehensively based on baroclinic instability theory (Qiu, 1999; Kobashi and Kawamura, 2002).
If the bottom layer of the NEC and the upper layer of the zonal jets are considered a coupled system within the NEC basin, it is important to investigate its stability. Furthermore, although NEC stability has been discussed qualitatively by Qiu (1999), the key factors governing its stability remain to be determined. To address these issues, nine moorings were deployed at 8.5°N, 10.5°N, 11.0°N, 12.5°N, 13.0°N, 15.0°N, 15.5°N, 17.5°N, and 18.0°N along 130.0°E to clarify both the growth rate in the boundary layer of the NEC-zonal jets system and the relative contributions to the growth rate of different NEC parameters. The remainder of this paper is organized as follows. The data obtained from the nine moorings and the AVISO products are introduced in Section 2. In Section 3, the relative contributions to NEC stability from different parameters and the growth rate in the boundary layer of the NEC-zonal jets system are discussed. A short discussion and the derived conclusions are presented in Section 4.
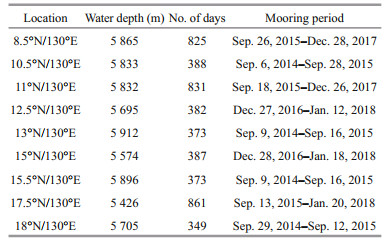
2 DATA 2.1 Acoustic Doppler Current Profiler (ADCP) mooring dataTo determine variability and vertical structure within the NEC basin, moorings were deployed along 130°E. The corresponding water depth is approximately 5 400–5 900 m. Moorings were deployed at 8.0°N, 10.5°N, 13.0°N, 15.5°N, and 18.0°N in September 2014 and retrieved one year later. From 2016, the mooring locations were changed to 8.5°N, 11.0°N, 12.5°N, 15.0°N, and 17.5°N (Fig. 1). It should be noted that mooring data during September 2014 to September 2015 at 8.0°N were lost, and that three ADCPs (two at 12.5°N and one at 15.0°N) failed during September 2015 to December 2016. Full details of the moorings are listed in Table 1.

|
| Fig.1 Root mean square (m) of sea surface height anomaly in the North Pacific Ocean (a) and the mooring region (b) based on AVISO products from January 1993 to December 2015 Black triangles and circles denote the moorings deployed at 10.5°N, 13.0°N, 15.5°N, and 18.0°N in 2014 cruise and at 8.5°N, 11.0°N, 12.5°N, 15.0°N, and 17.5°N along 130.0°E in 2015–2016 expeditions, respectively. |
|
The sampling frequency of the 75-kHz ADCPs deployed on our moorings was set to 1 h. At each mooring, two ADCPs (one looking upward and one looking downward) were attached at the depth of approximately 450 m. As each ADCP was set to observe 60 (8 m/bin) bins, the observation range of the two ADCPs was around 900 m. In fact, the measurement range of the ADCPs was variable because strong currents incline the mooring system and reduce the observational range. Before use in the analysis, the ADCP data underwent a strict quality control procedure. ADCP data with pitch or roll of >18°, current speed of >2 m/s, and < 80% good beam coverage were removed. Furthermore, the blank zone between adjacent ADCPs was filled by interpolation. Generally, most ADCP data were considered poor in the surface layer where beam emission echo is very strong; thus, data in the 0–50 m layer were deleted directly, except for the mooring at 13.0°N because the ADCP data were considered very good in the upper 50 m. The accuracy and resolution of the ADCPs were limited to within 1% velocity ±5 mm/s and < 1 mm/s, respectively. The ADCP data were processed as a daily dataset to remove tidal signals.
2.2 AVISO productsAVISO data were used in this study (Boebel and Barron, 2003; Barron et al., 2009). This altimetryobserved dataset comprises merged European Remote Sensing Satellite-1 and -2, Ocean Topography Experiment Topex/Poseidon, Geosat Follow-On, and Jason-1 and -2 data (Le Traon et al., 1998; Ducet et al., 2000). The 0.25°×0.25° resolution AVISO products (January 1, 1993 to December 31, 2015) that included daily sea surface height and corresponding geostrophic currents were downloaded from https://www.aviso.altimetry.fr.
3 RESULT 3.1 Mean structures of the NEC and zonal jetsThe mean zonal velocities (red lines) and standard deviations (dashed blue lines) at the nine mooring stations are shown in Fig. 2. In this paper, the positive direction is defined as northward and eastward. It can be seen that the NEC is a surface-intensified feature. Generally, the intensity of the surface NEC increases from 8.5°N to 10.5°N and then decreases slowly with increasing latitude. Vertically, the main body of the NEC deepens with latitude. At 18°N, the NEC is completely below the sea surface layer. The greatest standard deviation of zonal velocity occurs at 76 m (8.5°N), 50 m (10.5°N), 63 m (11.0°N), 60 m (12.5°N), 62 m (13.0°N), 67 m (15.0°N), 50 m (15.5°N), 63 m (17.5°N), and 59 m (18.0°N). It is interesting that all depths are focused in the upper 100 m. The mean meridional velocities at the mooring stations are much smaller than the zonal velocities but their standard deviations are comparable (figure not shown).

|
| Fig.2 Mean zonal velocities (red lines) and standard deviations (dashed blue lines) at 8.5°N (a), 10.5°N (b), 11.0°N (c), 12.5°N (d), 13.0°N (e), 15.0°N (f), 15.5°N (g), 17.5°N (h), and 18.0°N (i) along 130.0°E Zero velocities are denoted by black lines (m/s). |
It is worth emphasizing that eastward zonal jets exist beneath the NEC at 8.5°N, 10.5°N, 12.5°N, 13.0°N, and 17.5°N. The strongest zonal jet is found at 8.5°N with a value of 0.08 m/s at 455 m depth. To depict the zonal jets intuitively, latitude-depth sections of the mean zonal velocities interpolated from the ADCP data are shown in Fig. 3. Although zonal jets are found to exist at 10.5°N and 13.0°N, their intensity is smaller than at 8.5°N and 12.5°N. Furthermore, a zonal jet is evident at 17.5°N. Therefore, it is suggested that the zonal jets are concentrated at 8.5°N, 12.5°N, and 17.5°N along 130.0°E, consistent with the findings of Qiu et al.(2013a, b), who reported zonal jets centered around 9°N, 13°N, and 18°N along 130°E–135°E. In addition, the zonal jets deepen with latitude. For example, the zonal jet core is around 500 m depth at 8.5°N and 700 m depth at 12.5°N. At 17.5°N, the zonal jet is very weak above 800 m depth, which suggests that its core might be below 800 m. At 18.0°N, the STCC rather than the NEC occupies the upper layer; instead, the NEC is completely beneath the STCC.

|
| Fig.3 Latitude-depth zonal velocities (m/s) interpolated using data from the nine moorings at 8.5°N, 10.5°N, 11.0°N, 12.5°N, 13.0°N, 15.0°N, 15.5°N, 17.5°N, and 18.0°N along 130.0°E |
Although Qiu (1999) discussed NEC stability qualitatively, the relationship between the NEC growth rate and several key parameters remains unclear yet. To investigate NEC stability quantitatively, a 2½-layer linearized reduced gravity model was utilized under the quasi-geostrophic approximation as follows:
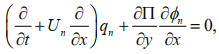 (1)
(1)where qn is the perturbation potential vorticity, Пn is he mean potential vorticity, and ϕn is the perturbation stream function in the n-th layer. In the following, H1/H2 and U1/U2 denote the mean layer thickness and the mean zonal velocity in the surface (n=1) and second (n=2) layers, respectively. The potential vorticity and the meridional gradient of the mean potential vorticity are shown in the following:
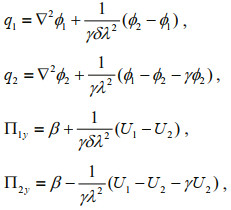
where 

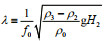
Generally, the normal mode solution is well described by the following form:
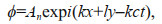 (2)
(2)in which k and l are the zonal and meridional wave numbers, respectively, with amplitude An. To derive nontrivial solutions for An, Eq.2 is substituted into Eq.1, following which the equation about wave speed c is derived as follows:
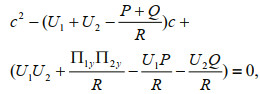 (3)
(3)where 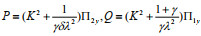

In fact, c is composed of the real part cr and the imaginary part ci; thus, c≡cr+ici, where cr is the phase speed and kci represents the growth rate. If ci=0, the system is stable; otherwise, it is unstable. Past studies have reported that the NEC is stable (Qiu, 1999; Kobashi and Kawamura, 2002); however, the reason for the stability of the NEC remains unresolved quantitatively. It seems that the Coriolis parameter f, shear gradient of zonal velocity, layer depth ratio δ, and stratification ratio γ are all closely associated with the growth rate of the NEC. Our calculations, which indicate that the growth rates at the nine mooring stations are all zero, suggest that the NEC is stable.
A series of idealized experiments was designed to discuss the relative contributions of key parameters to the NEC growth rate. First, all parameters except f were artificially set as constants, which tends to make the NEC unstable. The resultant relationship between latitude and growth rate is shown in Fig. 4a. As f is proportional to latitude, the NEC growth rate becomes larger with increasing latitude/f. Second, γ was similarly considered as the only variable, while all other parameters were set as constants, which also makes the NEC unstable. It is demonstrated in Fig. 4b that a lower value of γ corresponds to a greater growth rate. For U1 and U2, it is shown that a smaller value of U1 or a greater value of U2 leads to a higher growth rate of the NEC (Fig. 4c & d). In other words, the NEC growth rate is proportional to velocity shear. For the layer depth ratio δ, if H1 is held constant, the increase of H2 meridionally corresponds to the decrease of the H1/H2 ratio, which leads to decrease of the growth rate (Fig. 4e). If H2 is held constant, the increase of H1 meridionally corresponds to the increase of the H1/H2 ratio, which leads to decrease of the growth rate (Fig. 4f). In summary, the layer depth ratio δ always generates decrease of the NEC growth rate meridionally. The calculation shows that both the ratio γ and the shear of zonal velocity decrease with latitude in the NEC region. Therefore, f and γ lead to an increase of the NEC growth rate, while U1−U2 and δ generate a decrease of the NEC growth rate meridionally. In fact, as the NEC is stable, it would appear that the two inversed physical processes cancel each other, leading to zero growth rate of the NEC. Specifically, f and γ maintain NEC stability in low latitudes, while velocity shear and the layer depth ratio δ play an important role in NEC stability in high latitudes.

|
| Fig.4 Growth rate (/d) dependence on latitude (a), stratification ratio γ (b), mean flow U1 when U2 is constant (c), mean flow U2 when U1 is constant (d), layer depth ratio δ when H1 is constant (e), and layer depth ratio δ when H2 is constant (f) in the boundary layer of the NEC-zonal jet system |
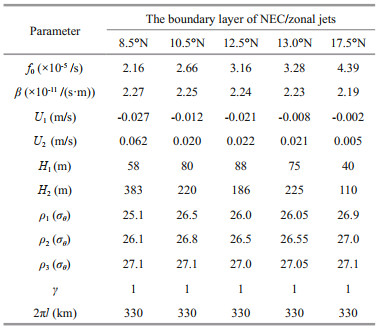
It is shown in Fig. 2 that the zonal jets are much stronger at 8.5°N and 12.5°N, where the standard deviation is comparable with that in the surface layer, in comparison with the other stations. At stations without zonal jets, or where the zonal jets are very weak, the standard deviations generally decrease with depth. It is very likely that the growth rate in the boundary layer comprising the bottom of the NEC (the first layer) and the upper zonal jets (the second layer) is no longer zero. Here, we choose 12.5°N as an example for which to calculate the growth rate in the boundary layer; the corresponding parameters are listed in Table 2. Specifically, ρ1=26.0 σθ, ρ2=26.5 σθ, ρ3=27.0 σθ, H1= 88 m, H2= 186 m, and U1 (U2) is given by the mean zonal velocity between ρ1 and ρ2 (ρ2 and ρ3) based on the mooring observations at 12.5°N. Here, depth ρ2 is set at the point of zero zonal velocity in the NEC-zonal jet system. For simplicity, 2πl is set as the mean value in the NEC region. The result shows that it is unstable. Similar calculation indicates that the growth rate in this layer is not zero at 8.5°N or 13.0°N (Fig. 5a), where both the zonal jets and the velocity shear between the NEC and the zonal jets are larger than at the other stations (Table 2). The smaller velocity shear at 13.0°N (compared with that at 8.5°N and 12.5°N) leads to the smaller growth rate. In comparison, the corresponding layers at 11.0°N, 15.0°N, 15.5°N, and 18.0°N without zonal jets are stable. It is striking that the growth rate is zero at both 10.5°N and 17.5°N, where zonal jets exist. At 17.5°N, the velocity shear is so small that the growth rate is equal to zero. At 10.5°N, although the velocity shear is comparable with that at 13.0°N, the lower latitude tends to attenuate the growth rate to zero. At 18.0°N, the layer comprising the bottom of the STCC and the upper NEC is unstable, consistent with previous research (Qiu, 1999; Kobashi and Kawamura, 2002). It is shown in Fig. 1b that the high variability of sea surface height along 130.0°E is concentrated around 8.0°N, 9.0°N–10.0°N, and 12.0°N–13.0°N. Meanwhile, the mooring data shown in Fig. 3 and Table 2 indicate that the zonal jets at 8.5°N, 12.5°N, and 13.0°N are stronger than at the other mooring stations, both of which support our calculations well.
|

|
| Fig.5 Growth rate (/d) calculated from mooring data at 8.5°N, 12.5°N, 13.0°N, and 18.0°N (a) and two idealized experiments at 12.5°N (b) |
Based on the above analysis, it seems that the stronger the zonal jets, the higher the growth rate. Therefore, it is interesting to investigate whether an equivalent velocity shear at different velocities in the boundary layer produces the same growth rate. To clarify this point, we set an idealized experiment at 12.5°N. The growth rate was calculated with U1=-0.05 and U2=0.01 and with U1=-0.10 and U2=-0.04. It should be noted that the velocity shear (U1−U2) and all other parameters were the same in both cases. It is shown in Fig. 5b that the growth rates are different in the two cases, suggesting that the growth rate is associated not only with the shear gradient of the zonal velocities but also with the velocities in two layers. It would appear that when the signs of the two zonal velocities differ, the growth rate is more likely to become larger than when the signs of the two zonal velocities are the same.
To investigate the dynamics, a key factor D, based on Eq.3, is defined as follows:
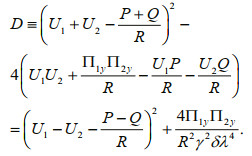 (4)
(4)It should be noted that factor D is the necessary and sufficient condition for stability/instability. As the term 
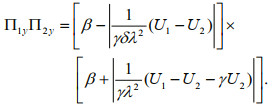 (5)
(5)The term in the second set of brackets is positive. However, as the absolute value of 
In fact, U1−U2 and U2 in Eq.4 could be considered as two variables:
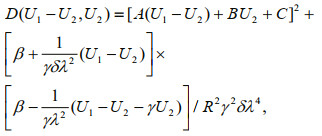
where 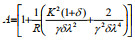


|
| Fig.6 Growth rate (/d) dependence on U1 and U2 when k=5×10⁻⁶ /m (a), k=1×10⁻⁵ /m (b), k=1.3×10⁻⁵ /m (c), and k=2.0×10⁻⁵ /m (d) |
The time series of zonal velocities at the nine mooring stations along 130.0°E are shown in Figs. 7 & 8. Beneath the permanent NEC, eastward zonal jets and the vertically extended NEC exist alternately meridionally. At low latitudes, e.g., 8.5°N, the NEC is concentrated on the surface, and the zonal jets are centered at around 500 m. The main body of the NEC and the intermittent zonal jets deepen with latitude. In addition, the intensity of the zonal jets varies with latitude; it is strongest at 8.5°N on June 6, 2016 (i.e., 0.65 m/s) and weakest at 15.5°N. Generally, the zonal jets at both 8.5°N and 12.5°N are much stronger than at the other stations. At 11.0°N, 15.0°N, and 15.5°N, although there is no zonal jet climatologically, one does appear intermittently over time. At 18.0°N, the zonal jets disappear completely. To investigate the variability of the NEC-zonal jet system, a power spectrum analysis is shown in Figs. 9 & 10. A common peak of 70–120 d is almost coherent from the sea surface to the bottom of the range of ADCP measurements at all mooring stations, which is significant (insignificant) below (above) the thermocline at the 95% confidence level. It should be noted that measurements for the full two years were retrieved only at 8.5°N, 11.0°N, and 17.5°N; the time series at the other stations extended for approximately one year. A semiannual signal is evident at 8.5°N, 11.0°N, and 17.5°N. Specifically, it is concentrated in the upper 250 m at both 8.5°N and 11.0°N and below 400 m at 17.5°N at the 95% confidence level.

|
| Fig.7 Time series of zonal velocities (m/s) along 130.0°E collected by ADCPs from September 2014 to September 2015 under a 30-d low-pass filter at 10.5°N (a), 13.0°N (b), 15.5°N (c), and 18.0°N (d) |

|
| Fig.8 Time series of zonal velocities (m/s) along 130.0°E collected by ADCPs under a 30-d low-pass filter at 8.5°N (a), 11.0°N (b), 17.5°N (c), 12.5°N (d), and 15.0°N (e) |

|
| Fig.9 Power spectral density (PSD) of zonal velocities from ADCPs along 130.0°E at 10.5°N (a), 13.0°N (b), 15.5°N (c), and 18.0°N (d) Mooring data were normalized at all depths before PSD analysis. |

|
| Fig.10 Power spectral density (PSD) of zonal velocities from ADCPs along 130.0°E at 8.5°N (a), 11.0°N (b), 17.5°N (c), 12.5°N (d), and 15.0°N (e) Mooring data were normalized at all depths before PSD analysis. |
To investigate the variability of the relationship between the NEC and the zonal jets, the vertical mean NEC averaged from the sea surface to the depth of zero velocity (blue line), and the mean zonal jets (red line) averaged from the depth of zero velocity to the bottom of the range of the ADCP measurement are shown in Figs. 11 & 12. It should be noted that the depth of zero velocity at 11.0°N, 15.0°N, and 15.5°N is artificially defined at 300, 500, and 500 m, respectively. It is striking that the blue and red lines are well consistent with each other, suggesting that the intensity of the NEC is inversely proportional to the strength of the zonal jets. When the NEC is strong, it is not only a surface-intensified feature but it also extends to deeper layers. Vertical extension of the NEC could weaken the zonal jets or even lead to occupation of the region of the zonal jets. Sometimes the NEC is sufficiently strong that the zonal jets disappear completely. It should be noted that the blue and red lines at 18.0°N represent the STCC and the NEC, respectively. It can be seen that they are well coherent, suggesting that STCC variability is inversely proportional to the NEC at 18.0°N along 130.0°E.

|
| Fig.11 Mean zonal velocities compared with the mean zonal jets (m/s) along 130.0°E at 10.5°N (a), 13.0°N (b), 15.5°N (c), and 18.0°N (d) |

|
| Fig.12 Mean zonal velocities compared with the mean zonal jets (m/s) along 130.0°E at 8.5°N (a), 11.0°N (b), 17.5°N (c), 12.5°N (d), and 15.0°N (e) |
It is interesting to check the growth rate in the boundary layer of the NEC-zonal jet system on the time node, when zonal jets exist beneath the NEC. Calculation shows the boundary layer is unstable during May 15 to June 15, 2016 at 8.5°N, and a similar calculation was applied to the other mooring stations. Quantitatively, in low latitudes, e.g., 8.5°N, when U1−U2 is >0.05 m/s, the system tends to be unstable. Around the bifurcation latitude of the NEC, e.g., 12.5°N, when U1−U2 is >0.04 m/s, the system is unstable. In high latitudes, e.g., 17.5°N, when U1−U2 is >0.01 m/s, the growth rate is not zero. In addition, the stronger the zonal jets, the higher the growth rate. It should be noted that the above analysis is based on the longwave assumption.
4 DISCUSSION AND CONCLUSIONThis study was based on direct ADCP measurements obtained at 8.5°N, 10.5°N, 11.0°N, 12.5°N, 13.0°N, 15.0°N, 15.5°N, 17.5°N, and 18.0°N along 130.0°E. The observations extended vertically to depths of 800–1 000 m, providing a dataset convenient for investigation of the features of the NEC and its underlying zonal jets. The main body of the NEC is concentrated in the upper layer at 8.5°N but it deepens with increasing latitude. At 18.0°N, the NEC is completely below the sea surface layer, and the surface current is instead the eastward-flowing STCC. Climatologically, eastward-flowing intermittent zonal jets are concentrated around 8.5°N, 12.5°N, and 17.5°N, consistent with previous research (Qiu et al., 2013a, b) that found three eastward zonal jets centered around 9°N, 13°N, and 18°N within the 26.9–27.3 σθ surfaces along 130°E–135°E. Similar to the NEC, the main body of the zonal jets also deepens with latitude. Generally, the standard deviation decreases with depth. However, in regions where the zonal jets are strong, the standard deviation is comparable with that in the surface layer. During the observation period, zonal jets were found to exist intermittently. Calculation showed that the variability of the NEC is inversely proportional to the strength of the zonal jets. The power spectral density analysis demonstrated that intraseasonal signals of 70–120 d are common below the thermocline at the nine mooring stations along 130.0°E.
A series of idealized experiments was designed to investigate the growth rate of the NEC. As the Coriolis parameter, velocity shear, layer depth ratio, and stratification ratio are all closely related to the NEC growth rate, in the experiments, one parameter was set as the only variable, while all other parameters were held constant to maintain the NEC instability. It was found that the Coriolis parameter and stratification ratio play important roles in the stability of NEC at low latitudes, and that the velocity shear and the layer depth ratio maintain NEC stability at high latitudes.
In the boundary layer comprising the bottom NEC and upper zonal jets, the growth rate was found not zero at 8.5°N, 12.5°N, and 13.0°N, whereas it was zero at the other stations. Although zonal jets exist at 10.5°N and 17.5°N, the low latitude of 10.5°N and the weak velocity shear at 17.5°N lead to NEC stability at the two stations. At 18.0°N, the layer comprising the bottom STCC and upper NEC was found unstable, consistent with previous research (Qiu, 1999; Kobashi and Kawamura, 2002).
On the assumption of longwaves, the growth rate is mainly proportional to the velocity shear. In the low latitudes of the NEC basin, the boundary layer is unstable when the velocity shear is >0.05 m/s. Near the NEC bifurcation latitude, the boundary layer is unstable when the velocity shear is >0.04 m/s. The corresponding value is 0.01 m/s at high latitudes. On the assumption of shortwaves, the growth rate is unrelated to velocity shear, but it is well proportional to the velocity of the zonal jets. This could be attributed to the asymmetry of the velocities of different layers in Π1y and Π2y.
5 DATA AVAILABILITY STATEMENTThe datasets generated and/or analyzed during the current study are available from the corresponding author on reasonable request.
6 ACKNOWLEDGMENTWe thank all the scientists, technicians, and the crew of R/V Science for the deployment and retrieval of the moorings. The daily sea surface height and geostrophic currents from AVISO products can be downloaded from https://www.aviso.altimetry.fr/.
Aoki S, Imawaki S. 1996. Eddy activities of the surface layer in the western North Pacific detected by satellite altimeter and radiometer. Journal of Oceanography, 52(4): 457-474.
DOI:10.1007/BF02239049 |
Barron C N, Kara A B, Jacobs G A. 2009. Objective estimates of westward Rossby wave and eddy propagation from sea surface height analyses. Journal of Geophysical Research:Oceans, 114(C3): C03013.
DOI:10.1029/2008JC005044 |
Boebel O, Barron C. 2003. A comparison of in-situ float velocities with altimeter derived geostrophic velocities. Deep Sea Research Part Ⅱ:Topical Studies in Oceanography, 50(1): 119-139.
DOI:10.1016/S0967-0645(02)00381-8 |
Chen Z H, Wu L X, Qiu B, Li L, Hu D X, Liu C Y, Jia F, Liang X. 2015. Strengthening Kuroshio observed at its origin during November 2010 to October 2012. Journal of Geophysical Research:Oceans, 120(4): 2 460-2 470.
DOI:10.1002/2014JC010590 |
Ducet N, Le Traon P Y, Reverdin G. 2000. Global highresolution mapping of ocean circulation from TOPEX/Poseidon and ERS-1 and -2. Journal of Geophysical Research:Oceans, 105(C8): 19 477-19 498.
DOI:10.1029/2000JC900063 |
Fine R A, Lukas R, Bingham F M, Warner M J, Gammon R H. 1994. The western equatorial Pacific:a water mass crossroads. Journal of Geophysical Research:Oceans, 99(C12): 25 063-25 080.
DOI:10.1029/94JC02277 |
Hogg N G, Owens W B. 1999. Direct measurement of the deep circulation within the Brazil Basin. Deep Sea Research Part Ⅱ:Topical Studies in Oceanography, 46(1-2): 335-353.
DOI:10.1016/S0967-0645(98)00097-6 |
Hu D X, Cui M C. 1991. The western boundary current of the Pacific and its role in the climate. Journal of Oceanology and Limnology, 9(1): 1-14.
DOI:10.1007/BF02849784 |
Kashino Y, España N, Syamsudin F, Richards K J, Jensen T, Dutrieux P, Ishida A. 2009. Observations of the North Equatorial Current, Mindanao Current, and Kuroshio Current system during the 2006/07 El Niño and 2007/08 La Niña. Journal of Oceanography, 65(3): 325-333.
DOI:10.1007/s10872-009-0030-z |
Kim Y Y, Qu T D, Jensen T, Miyama T, Mitsudera H, Kang H W, Ishida A. 2004. Seasonal and interannual variations of the North Equatorial Current bifurcation in a high-resolution OGCM. Journal of Geophysical Research:Oceans, 109(3): C03040.
DOI:10.1029/2003JC002013 |
Kobashi F, Kawamura H. 2002. Seasonal variation and instability nature of the North Pacific Subtropical Countercurrent and the Hawaiian Lee Countercurrent. Journal of Geophysical Research:Oceans, 107(C11): 6-1-6-18.
DOI:10.1029/2001JC001225 |
Le Traon P Y, Nadal F, Ducet N. 1998. An improved mapping method of multisatellite altimeter data. Journal of Atmospheric and Oceanic Technology, 15(2): 522-534.
DOI:10.1175/1520-0426(1998)015<0522:AIMMOM>2.0.CO;2 |
Lien R C, Ma B, Cheng Y H, Ho C R, Qiu B, Lee C M, Chang M H. 2014. Modulation of Kuroshio transport by mesoscale eddies at the Luzon Strait entrance. Journal of Geophysical Research:Oceans, 119(4): 2 129-2 142.
DOI:10.1002/2013JC009548 |
Nakano H, Hasumi H. 2005. A series of zonal jets embedded in the broad zonal flows in the Pacific obtained in eddypermitting ocean general circulation models. Journal of Physical Oceanography, 35(4): 474-488.
DOI:10.1175/JPO2698.1 |
Nitani, H. 1972. Beginning of the Kuroshio. In: Stommel H, Yoshida K eds. Kuroshio: Its Physical Aspects. University of Washington Press, Seattle, Wash. p.129-163.
|
Qiu B, Chen S M, Sasaki H. 2013b. Generation of the North Equatorial undercurrent jets by Triad Baroclinic Rossby wave interactions. Journal of Physical Oceanography, 43(12): 2 682-2 698.
DOI:10.1175/JPO-D-13-099.1 |
Qiu B, Chen S M, Schneider N, Taguchi B. 2014. A coupled decadal prediction of the dynamic state of the Kuroshio Extension system. Journal of Climate, 27(4): 1 751-1 764.
DOI:10.1175/JCLI-D-13-00318.1 |
Qiu B, Joyce T M. 1992. Interannual variability in the mid-and low-latitude western North Pacific. Journal of Physical Oceanography, 22(9): 1 062-1 079.
DOI:10.1175/1520-0485(1992)022<1062:IVITMA>2.0.CO;2 |
Qiu B, Lukas R. 1996. Seasonal and interannual variability of the north Equatorial Current, the Mindanao Current, and the Kuroshio along the Pacific western boundary. Journal of Geophysical Research:Oceans, 101(C5): 12 315-12 330.
DOI:10.1029/95JC03204 |
Qiu B, Rudnick D L, Cerovecki I, Cornuelle B D, Chen S M, Schönau M C, McClean J L, Gopalakrishnan G. 2015. The Pacific North Equatorial Current:new insights from the origins of the Kuroshio and Mindanao Currents(OKMC) Project. Oceanography, 28(4): 24-33.
DOI:10.5670/oceanog.2015.78 |
Qiu B, Rudnick D L, Chen S M, Kashino Y. 2013a. Quasistationary North Equatorial Undercurrent jets across the tropical North Pacific Ocean. Geophysical Research Letters, 40(10): 2 183-2 187.
DOI:10.1002/grl.50394 |
Qiu B. 1999. Seasonal eddy field modulation of the North Pacific subtropical countercurrent:TOPEX/poseidon observations and theory. Journal of Physical Oceanography, 29(10): 2 471-2 486.
DOI:10.1175/1520-0485(1999)029<2471:SEFMOT>2.0.CO;2 |
Qu T D, Gan J P, Ishida A, Kashino Y, Tozuka T. 2008. Semiannual variation in the western tropical Pacific ocean. Geophysical Research Letters, 35(16): L16602.
DOI:10.1029/2008GL035058 |
Qu T D, Mitsudera H, Yamagata T. 1998. On the western boundary currents in the Philippine Sea. Journal of Geophysical Research:Oceans, 103(C4): 7 537-7 548.
DOI:10.1029/98JC00263 |
Richards K J, Maximenko N A, Bryan F O, Sasaki H. 2006. Zonal jets in the Pacific Ocean. Geophysical Research Letters, 33(3): L03605.
DOI:10.1029/2005GL024645 |
Wang F J, Wang Q Y, Hu D X, Zhai F G, Hu S J. 2016. Seasonal variability of the Mindanao Current determined using mooring observations from 2010 to 2014. Journal of Oceanography, 72(5): 787-799.
DOI:10.1007/s10872-016-0373-1 |
Wang F J, Wang Q Y, Zhang L L, Hu D X, Hu S J, Feng J Q. 2019. Spatial distribution of the seasonal variability of the North Equatorial Current. Deep Sea Research Part Ⅰ:Oceanographic Research Papers, 144: 63-74.
DOI:10.1016/j.dsr.2019.01.001 |
Wyrtki K. 1975. Fluctuations of the dynamic topography in the Pacific Ocean. Journal of Physical Oceanography, 5(3): 450-459.
DOI:10.1175/1520-0485(1975)005<0450:FOTDTI>2.0.CO;2 |
Zhang L L, Wang F J, Wang Q Y, Hu S J, Wang F, Hu D X. 2017. Structure and Variability of the North Equatorial Current/Undercurrent from Mooring Measurements at 130°E in the Western Pacific. Scientific Reports, 7: 46 310.
DOI:10.1038/srep46310 |