 2020, Vol. 38
Institute of Oceanology, Chinese Academy of Sciences
Article Information
- ZHANG Xudong, LI Xiaofeng, ZHANG Tao
- Characteristics and generations of internal wave in the Sulu Sea inferred from optical satellite images
- Journal of Oceanology and Limnology, 38(5): 1435-1444
- http://dx.doi.org/10.1007/s00343-020-0046-1
Article History
- Received Jan. 19, 2020
- accepted in principle Mar. 8, 2020
- accepted for publication Jun. 19, 2020


2 College of Geomatics, Shandong University of Science and Technology, Qingdao 266071, China
Internal waves (IWs) with large amplitude and long wave crests are observed frequently in the global oceans (Jackson, 2007; Zhao et al., 2014), such as the South China Sea (Liu and Hsu, 2004), East China Sea (Nam et al., 2018), Andaman Sea (Sun et al., 2019), Black Sea (Lavrova et al., 2014), Red Sea (da Silva et al., 2012) and White Sea (Kozlov et al., 2014). The propagation and dissipation of IWs have significant impacts on the distributions of plankton and chlorophyll (Vázquez et al., 2009), ocean mixing (Villamaña et al., 2017), and sediment resuspension (Jia et al., 2019). Large-amplitude IWs can travel several thousand kilometers with a strong shear force and hence play an essential role in affecting the ocean environment (Lü et al., 2016).
Properties of IWs have been studied using satellite images, such as the spatial and temporal distribution (Sun et al., 2019), generation mechanism (Li et al., 2008; Magalhaes and da Silva, 2018) and propagation characteristics (Alford et al., 2010; Li et al., 2013; Bai et al., 2017). Both active synthetic aperture radar (SAR) images and passive optical satellite images have provided valuable information for IW studies. Optical satellite images, such as Moderate-Resolution Imaging Spectroradiometer (MODIS) images, are widely used in IW studies, taking advantage of its wide swath and high temporal resolutions. IWs modulate the sea surface roughness with convergence and divergence regions and manifest as bright-dark or dark-bright stripes in optical satellite images under the clear sky conditions in the sun glint areas (Jackson and Alpers, 2010). The alternative bright-dark bands make the IW easy to be recognized on optical satellite images. Jackson (2007) presented the results of 3 581 IWs detected using MODIS images in the global oceans. Sun et al. (2019) presented the spatialtemporal distributions of IWs in the Andaman Sea using MODIS images from 2010 to 2016. Optical satellite images from other sensors are also used for IW studies. Liu and D'Sa (2019) studied the IWs in the Sulu-Celebes Sea using 37 pairs of Moon glint Visible Infrared Imaging Radiometer Suite (VIIRS) images and found four straits where IW generated in the Sulu Sea. In this study, a comprehensive investigation of spatial and temporal characteristics of IWs in the Sulu Sea is conducted using satellite images spanning for nearly three years.
The Sulu Sea is adjacent to the South China Sea and the Pacific Ocean. Satellite observations show that IWs in the Sulu Sea happen all year round with long wave crest. The dominant wave crest extends in the SW-NE direction indicating IW packets propagating from SE to NW toward the Palawan Island. Figure 1 shows MODIS and VIIRS images acquired on 4 April 2019 and 24 March 2019 containing multiple IW packets. The length of wave crests (LWCs) of IWs increases from the south (~100 km) to the north (200–300 km) and decrease (~200 km) when IW meet the northern islands. The distance between two consecutive IW packets ranges from 85 to 95 km. Considering the semi-diurnal generation period (Liu and D'Sa, 2019), the propagation speed of IWs ranges from 1.90 m/s to 2.12 m/s. Some literature related to the IW investigation in the Sulu Sea using field observations (Apel et al., 1985) or satellite images (Liu and D'Sa, 2019) is reported, which shows that IWs in the western Sulu Sea mainly generated at four sources with a lee-wave mechanism. Previous studies of IWs in the Sulu Sea mainly focus on the western region while IWs with long wave crest in the eastern region received less attention.

|
| Fig.1 IWs in the Sulu Sea observed by MODIS image on 4 April 2019 (a) and VIIRS image on 24 March 2019 (b) The white dashed lines indicate wave crests of IWs. The black arrows indicate IW propagation directions and distances between successive packets. |
In this study, we firstly analyzed the spatial and temporal characteristics of IWs in the Sulu Sea using consecutive observations of MODIS and VIIRS images from October 2016 to September 2019. New IW generation sites for IWs in the western Sulu Sea are found using the ray-tracing method. Generations of long IWs occasional observed in the eastern Sulu Sea are discussed. The paper is organized as follows: Section 2 introduces the satellite observation results and the ray-tracing method. Section 3 presents new IW generation sites for IWs in the western Sulu Sea and Section 4 discussed generations of long IWs in the eastern Sulu Sea, and we conclude the study in Section 5.
2 SATELLITE OBSERVATION 2.1 Spatial and temporal distributions of IWsOptical satellite images from MODIS and VIIRS are used in this study. The MODIS sensors are onboard NASA Terra and Aqua satellites acquiring data in 36 spectral bands with a swath of 2 330 km. In this study, MODIS images with a spatial resolution of 250 m (Bands 1 and 2) are used. The VIIRS sensor is on board satellite Suomi National Polar-Orbiting Partnership (NPP). VIIRS images have a swath of 3 000 km and acquiring data with a spatial resolution of 750 m and 370 m. In this study, VIIRS images with a spatial resolution of 370 m are used. Parameters of the Satellite images used in this study are listed in Table 1. A total of 465 optical satellite images with clear IW signatures were collected from 1 October 2016 to 30 September 2019.

Single IW or the leading wave of IW packets is extracted from collected optical satellite images. The extracted locations of wave crests showing the spatial distribution of IWs in the Sulu Sea are presented in Fig. 2. IWs extracted from different images are labeled with different colors. Generally, IWs mainly distributed in the western Sulu Sea, with increasing LWC from south to north. In the deeper region between 6.5°N–8.5°N and 120°E–121°E, few IWs are observed. From Figs. 1 & 2, one can also find that while IWs mainly propagate in the NW direction, and the IW eastern-part wave crest propagates faster than that of western-part because the eastern region is much deeper (Zhang et al., 2018). Figure 2 shows that VIIRS images from the NPP serve as an excellent additional data source for the observation of IWs in the Sulu Sea, especially in regions between 6°N–6.5°N, 7°N–7.5°N, and 9°N–10.5°N.

|
| Fig.2 Spatial distributions of IWs in the Sulu Sea using MODIS (Aqua and Terra) and VIIRS (NPP) images taken from October 2016 to September 2019 The red (blue, yellow) lines indicate IW locations extracted from Aqua (Terra, NPP). |
The LWC of IWs larger than 300 km is observed in the Sulu Sea (Fig. 1). The histogram of the LWC of IWs is shown in Fig. 3a, from which one can find that the LWC mainly distributed between 50 and 120 km. Since the IWs mainly propagate in the meridional direction, the distributions of the LWC along the latitude is calculated and shown in Fig. 3b. Figure 3 shows that IWs generated at the southern islands with an average LWC between 50 km and 70 km (5°N–6°N) and propagate to the northwest with an average LWC over 100 km. The LWC of IWs increases from 5°N–9°N with the evolution of IWs and decreases at 10°N when the IWs meet the northern Palawan Islands. Figure 1b shows that the western branch of the wave crest disappeared at the Palawan Islands while the eastern branch keeps propagating northward.

|
| Fig.3 Histogram of the length of wave crests of IWs (a) and the distributions of the length of wave crest along the latitude (b) |
To study IW seasonal variations, the temporal distributions of IWs in the Sulu Sea is analyzed, and the result is shown in Fig. 4. The Sulu Sea has a tropical monsoon climate and has two seasons each year. The dry season is from November to April (red shaded regions in Fig. 4) and the rainy season is from May to October (green shaded regions in Fig. 4). As shown in Fig. 4, more IWs are observed in the dry season, with the March has the most IWs and July has the least. Two possible reasons may be account for this result, which is cloud contamination of optical satellite images or ocean stratification variations.

|
| Fig.4 Temporal distributions of IWs in the Sulu Sea using MODIS (Aqua and Terra) and VIIRS (NPP) images from October 2016 to September 2019 The red shaded months indicate the dry season and green shaded months indicate the rainy season. |
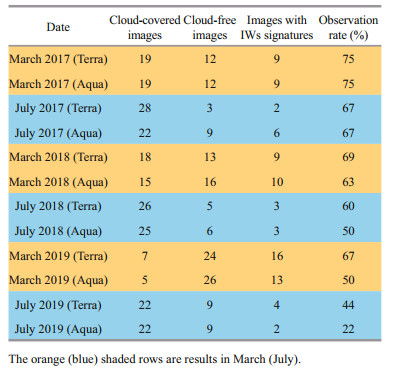
MODIS images from 2017 to 2019 are used to study the difference of observed days in March and July. MODIS images in March and July are divided into two groups, cloud-covered images, and cloudfree (little cloud or no cloud) images. Among cloudfree images, images with clear IW signatures are counted. The observation rate is calculated by images with clear IWs signatures divided by cloud-free images. The results are shown in Table 2. These results demonstrate that the large difference in counted days with IWs observed on satellite images is largely due to the cloud contamination of satellite images, fewer images could be used for IW observation in July.
|
The ray-tracing method (da Silva et al., 2015; Sun et al., 2019) is adopted to find possible generation sites of IWs in the Sulu Sea. The generation sites are determined based on the form of IW wave crests. After generated, the IWs are assumed to propagate with a circular wave crest. The cross points of two perpendicular lines across the wave crest are assumed to be the generation site of IWs. A sketch map of the ray-tracing method is shown in Fig. 5. As shown in. Figs. 1b & 2, the west branch of IW crest is locked by the shallower topography. Therefore, the generation sites are traced back mainly using near-field IW crests while the far-field IW crests will merge and affect by the topography.

|
| Fig.5 Sketch map of the ray-tracing method to fi nd possible IW generation sites |
IWs propagate northward with arc-shape wave crests as shown in Figs. 1 & 2. IWs generated at regions along the Sulu Archipelago (5°N- 6°N) are observed using MODIS images acquired on 28 April 2017 (Fig. 6a) and 20 April 2019 (Fig. 6b). Many small islands located along this region. Large and long IWs are observed in northern regions (north of 7°N) with the evolution of generated IWs (Fig. 2). The generation sites are traced based on the observed IWs from satellite images. Four generation sites are found and labeled from S1 to S4, as shown in Fig. 6. These generation sites are located in different straits between small islands. IWs generated at Sites S3 and S4 propagating northward and merge into one IW, as shown in Fig. 6b.

|
| Fig.6 MODIS images acquired on 28 April 2017 (a) and 20 April 2019 (b), which show clear IW signatures The possible generation sites obtained with the ray-tracing method are labeled from S1 to S4. The insert map shows the locations of the used satellite images in the Sulu Sea. |
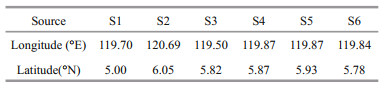
Two generation sites (S5 and S6) are found in the same strait with Site S4 using the VIIRS image acquired on 20 February 2019 (Fig. 7a). Generated IWs propagating in opposite directions with arc-shape wave crest. To have a general view of possible generation sites found by the ray-tracing method, a composite map showing six possible generation sites is presented in Fig. 7b. The exact locations of the six generation sites are shown in Table 3. The results show that although in the same strait, IWs are found generated at different sites (S4, S5, and S6).

|
| Fig.7 VIIRS image acquired on 20 February 2019 showing clear IW signatures (a); a composite image of possible generation sites of IWs in Figs. 4 & 5 (b) The white line shows the wave crest (WC) of an IW originated from diff erent sources. The insert map shows the locations of the used satellite images in the Sulu Sea. |
An IW wave crest labeled with a white line in Fig. 7b shows IWs generated from different sources. When propagating north, these IWs merge into a single IW. Along the wave crest, the wave crest may be divided into three parts. The WC1 part is generated at regions adjacent to Site S3, WC2 part is generated at regions adjacent to Sites S4–S6, and the WC3 part is generated at regions north of Site S2 (Generation Site 4 in (Liu and D'Sa, 2019)). In the regions north of these small islands along 5°N–6°N, single IW or IW packets propagating northward is observed with long wave crest. These results imply that the longwave-crest IWs propagating north in the Sulu Sea are generated at straits between small islands along the Sulu Archipelago. Not specific point generation sites account for the IWs with long crests, but the combined eff orts of whole straits between small islands. Multisites generated IWs merge into single IW with long wave crest when propagating northward.
As shown in Fig. 8a, possible generation sites inferred from satellite observations are superimposed with the IW crests from satellite observations for nearly three years. Figure 8a shows more IW crests observations to validate the inferred IW sources in cases shown in Figs. 6 & 7. The underwater topography is shown in Fig. 8b showing that IW sources are located at the narrow straits between small islands or with an underwater ridge.

|
| Fig.8 Possible IW generation sites superimposed with extracted IW crests (a); the underwater topography of the Sulu archipelago (b) The solid red dots indicate six possible sources of IWs. The black arrows show the propagation path of IWs generated at diff erent sources. The red box indicates the eastern Sulu Sea with less IWs observed. The dashed arrow indicate possible propagation path for IWs in the eastern Sulu Sea. |
The analysis shows that multiple generation sites may exist in the same strait. The sea waters fl ow over the strait in diff erent directions will generate IWs propagating in diff erent directions. With more satellite images acquired in diff erent sensors and time analyzed, more specifi c IW generation sites can be found. As shown in Fig. 7b, IWs generated at diff erent exact locations will merge into a single long IW when propagating northward. So straits between small islands along the Sulu Archilepago all serve as possible generation sites of IW.
4 LONG IWS IN THE EASTERN SULU SEAWhile attentions mainly focus on IWs in the western Sulu Sea generated by lee wave mechanism (Apel et al., 1985), IWs in the eastern Sulu Sea (red box of Fig. 8a) with long-wave crest have received less attention. Long IWs in the eastern Sulu Sea are mainly observed in regions between 8°N and 11°N and no IWs are observed in lower latitude. IWs can be generated by the tide-topography interactions or by the evolution of internal tide from remote sources. For locally generated IWs, the wave crests usually parallel to the isobaths. As shown in Fig. 8a, these long IWs cross isobaths in the eastern Sulu Sea which imply that these IWs are not locally generated.
To find the possible source for these long IWs in the eastern Sulu Sea, the tidal transport in the meridional direction is extracted from the TOPEX/POSEIDON global tidal model (TPXO) and the depth-integrated barotropic tidal forcing are computed. The equation of tidal forcing is expressed as (Li et al., 2008)
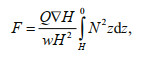
where Q is the barotropic tidal transport, H is the water depth, ▽H is the bottom slope, w is the tidal frequency, and N2 is the buoyancy frequency. The computed tidal forcing of M2 tide is shown in Fig. 9b. Possible generation sites have larger meridional transport and tidal forcing than other regions as shown in Fig. 9. According to the geometry of wave crests in Fig. 8 and the tidal transport and tidal forcing distributions shown in Fig. 9, it is convincible to postulate that strait around (121.5°E, 6°N) is the source of long IWs in the eastern Sulu Sea. These IWs are similar to IWs observed in the northwestern South China Sea as reported by Li et al. (2008).

|
| Fig.9 The transport of M2 tide in the meridional direction (a); the tidal forcing of M2 tide in the Sulu Archipelago (b) |
Several mechanisms may account for the remote generation of IWs, such as tidal beam generation. The internal tide beam refl ects in the ocean and aff ects the pycnocline that may lead to the local generation of IWs. Gerkema (2001) defi ned a parameter gamma to evaluate the interaction of tidal beam and pycnocline. The parameter is defi ned as:

where H is the water depth, h is the thickness of the upper mixed layer, and Nc is the constant buoyancy frequency of lower layer. Considering H =4 000 m, h =100 m, Nc =0.005/s, gʹ =0.03 m/s 2, the parameter is calculated as γ =0.08. For areas that internal waves generated by tidal beam generation mechanism, gamma parameters are found falls in an optimum range 0.1 ≤γ≤ 0.2 (Jackson et al., 2012). Therefore, long IWs in the eastern region of the Sulu Sea are not generated locally due to the tide beams.
Based on the form of IW crests in the eastern Sulu Sea, the underwater topography profi le along the dashed arrow in Fig. 8a is shown in Fig. 10. As we can fi nd long IWs are found north of 8°N only where the water depth begins to decrease. When the water depth starts to decrease, the nonlinear eff ect enhanced and leads to the nonlinear IW generation. The distribution of long IWs matches the position of underwater topography when the nonlinear eff ect begins to increase. Therefore, we postulate that IWs in the eastern region of the Sulu Sea may be generated by the nonlinear evolution of internal tides originated from the Sulu Archipelago.

|
| Fig.10 The underwater topography profile along black dashed arrow in Fig. 8a |
IWs with long wave crest are frequently observed propagating from SE to NW toward the Palawan Island and almost cover the entire sea area. Three years MODIS images from Terra and Aqua, and VIIRS images from NPP are used to study IWs in the Sulu Sea. The spatial distributions of IWs are analyzed, and results show that IWs mainly located in the shallow western regions with less observed in the deeper eastern regions. IWs in the Sulu Sea have a dominant LWC between 50 km and 150 km with the largest LWC over 300 km. The meridional distribution of LWC shows that 9°N has the largest average LWC. Because when IWs meet Palawan Island, the western branch will disappear while the eastern keep propagating northward. This study also shows that VIIRS images serve as a good additional data source for IW study in the Sulu Sea because it serves as a good supplementary description for IWs in some regions. The temporal analysis shows that in March have most IWs while in July have the least. Further study shows that this is mainly due to the cloud contamination of the optical satellite images.
IW generation sites in the Sulu Sea are studied using satellite images. Six possible generation sites for IWs in the western Sulu Sea are found using the ray-tracing method. The analysis shows that all straits along the Sulu Archipelago may serve as possible generation sites. More generation sites may be found in the straits using satellite images acquired at diff erent times. Not specifi c point generation sites account for the long-wave-crest IWs in the northern Sulu Sea, but the whole straits between small islands along 5°N–6°N. IWs generated from diff erent straits will merge into one single IW in the northern regions and fi nally disappear in the northern Palawan Islands. IWs in the eastern Sulu Sea with long wave crest are studied. The remote generated IWs may be generated at the straits around (121.5°E, 6°N) by the internal tide evolution mechanism, and further study is expected.
6 DATA AVAILABILITY STATEMENTSatellite images used in this study could be downloaded freely from NASA Worldview application (https://worldview.earthdata.nasa.gov). The TPXO data could be downloaded freely from OSU TPXO tides Home (https://www.tpxo.net/home).
7 ACKNOWLEDGMENTWe acknowledge the use of imagery from the NASA Worldview application (https://worldview.earthdata.nasa.gov), part of the NASA Earth Observing System Data and Information System (EOSDIS).
Alford M H, Lien R C, Simmons H, Klymak J, Ramp S, Yang Y J, Tang D, Chang M H. 2010. Speed and evolution of nonlinear internal waves transiting the South China Sea. Journal of Physical Oceanography, 40(6): 1 338-1 355.
DOI:10.1175/2010jpo4388.1 |
Apel J R, Holbrook J R, Liu A K, Tsai J J. 1985. The Sulu Sea internal Soliton experiment. Journal of Physical Oceanography, 15(12): 1 625-1 651.
DOI:10.1175/1520-0485(1985)015<1625:Tssise>2.0.Co;2 |
Bai X L, Li X F, Lamb K G, Hu J J. 2017. Internal solitary wave reflection near Dongsha Atoll, the South China Sea. Journal of Geophysical Research:Oceans, 122(10): 7 978-7 991.
DOI:10.1002/2017JC012880 |
da Silva J C B, Buijsman M C, Magalhaes J M. 2015. Internal waves on the upstream side of a large sill of the Mascarene Ridge:a comprehensive view of their generation mechanisms and evolution. Deep Sea Research Part I:Oceanographic Research Papers, 99: 87-104.
DOI:10.1016/j.dsr.2015.01.002 |
da Silva J C B, Magalhães J M, Gerkema T, Maas L R M. 2012. Internal solitary waves in the Red Sea:an unfolding mystery. Oceanography, 25(2): 96-107.
DOI:10.5670/oceanog.2012.45 |
Gerkema T. 2001. Internal and interfacial tides:beam scattering and local generation of solitary waves. Journal of Marine Research, 59(2): 227-255.
DOI:10.1357/002224001762882646 |
Jackson C R, Alpers W. 2010. The role of the critical angle in brightness reversals on sunglint images of the sea surface. Journal of Geophysical Research:Oceans, 115(C9): C09019.
DOI:10.1029/2009jc006037 |
Jackson C R, da Silva J C B, Jeans G. 2012. The generation of nonlinear internal waves. Oceanography, 25(2): 108-123.
DOI:10.5670/oceanog.2012.46 |
Jackson C. 2007. Internal wave detection using the moderate resolution imaging spectroradiometer (MODIS). Journal of Geophysical Research:Oceans, 112(C11): C11012.
DOI:10.1029/2007JC004220 |
Jia Y G, Tian Z C, Shi X F, Liu J P, Chen J X, Liu X L, Ye R J, Ren Z Y, Tian J W. 2019. Deep-sea sediment resuspension by internal solitary waves in the northern South China Sea. Scientific Reports, 9(1): 12 137.
DOI:10.1038/s41598-019-47886-y |
Kozlov I, Romanenkov D, Zimin A, Chapron B. 2014. SAR observing large-scale nonlinear internal waves in the White Sea. Remote Sensing of Environment, 147: 99-107.
DOI:10.1016/j.rse.2014.02.017 |
Lavrova O Y, Mityagina M I, Serebryany A N, Sabinin K D, Kalashnikova N A, Krayushkin E V, Khymchenko I. 2014.Internal waves in the Black Sea: satellite observations and in-situ measurements. In: Proceedings of the SPIE 9240, Remote Sensing of the Ocean, Sea Ice, Coastal Waters, and Large Water Regions 2014. SPIE, Amsterdam, The Netherlands, https://doi.org/10.1117/12.2067047.
|
Li X F, Jackson C R, Pichel W G. 2013. Internal solitary wave refraction at Dongsha Atoll, South China Sea. Geophysical Research Letters, 40(12): 3 128-3 132.
DOI:10.1002/grl.50614 |
Li X F, Zhao Z X, Pichel W G. 2008. Internal solitary waves in the northwestern South China Sea inferred from satellite images. Geophysical Research Letters, 35(13): L13605.
DOI:10.1029/2008gl034272 |
Liu A K, Hsu M K. 2004. Internal wave study in the South China Sea using Synthetic Aperture Radar (SAR). International Journal of Remote Sensing, 25(7-8): 1 261-1 264.
DOI:10.1080/01431160310001592148 |
Liu B Q, D'Sa E J. 2019. Oceanic internal waves in the SuluCelebes Sea under sunglint and moonglint. IEEE Transactions on Geoscience and Remote Sensing, 57(8): 6 119-6 129.
DOI:10.1109/tgrs.2019.2904402 |
Lü H B, Xie J H, Xu J X, Chen Z W, Liu T Y, Cai S Q. 2016. Force and torque exerted by internal solitary waves in background parabolic current on cylindrical tendon leg by numerical simulation. Ocean Engineering, 114: 250-258.
DOI:10.1016/j.oceaneng.2016.01.028 |
Magalhaes J M, da Silva J C B. 2018. Internal solitary waves in the Andaman Sea:new insights from SAR imagery. Remote Sensing, 10(6): 861.
DOI:10.3390/rs10060861 |
Nam S, Kim D J, Lee S W, Kim B G, Kang K M, Cho Y K. 2018. Nonlinear internal wave spirals in the northern East China Sea. Scientific Reports, 8(1): 3 473.
DOI:10.1038/s41598-018-21461-3 |
Sun L N, Zhang J, Meng J M. 2019. A study of the spatialtemporal distribution and propagation characteristics of internal waves in the Andaman Sea using MODIS. Acta Oceanologica Sinica, 38(7): 121-128.
DOI:10.1007/s13131-019-1449-8 |
Vázquez A, Flecha S, Bruno M, Macías D, Navarro G. 2009. Internal waves and short-scale distribution patterns of chlorophyll in the Strait of Gibraltar and Alborán Sea. Geophysical Research Letters, 36(23): L23601.
DOI:10.1029/2009GL040959 |
Villamaña M, Mouriño-Carballido B, Marañón E, Cermeño P, Chouciño P, da Silva J C B, Díaz P A, Fernández-Castro B, Graña M G R, Latasa M, Magalhaes J M, Otero-Ferrer J L, Reguera B, Scharek R. 2017. Role of internal waves on mixing, nutrient supply and phytoplankton community structure during spring and neap tides in the upwelling ecosystem of Ría de Vigo (NW Iberian Peninsula). Limnology and Oceanography, 62(3): 1 014-1 030.
DOI:10.1002/lno.10482 |
Zhang X D, Jie Z, Fan C Q, Wang J, Meng J M. 2018. Observations of internal waves with high sampling data of radar altimetry and MODIS images. International Journal of Remote Sensing, 39(21): 7 405-7 416.
DOI:10.1080/01431161.2018.1470700 |
Zhao Z X, Liu B Q, Li X F. 2014. Internal solitary waves in the China seas observed using satellite remote-sensing techniques:a review and perspectives. International Journal of Remote Sensing, 35(11-12): 3 926-3 946.
DOI:10.1080/01431161.2014.916442 |