 2020, Vol. 38
Institute of Oceanology, Chinese Academy of Sciences
Article Information
- YU Lei, LIU Yanfang, LIU Jinxian
- Gene-associated microsatellite markers confirm panmixia and indicate a different pattern of spatially varying selection in the endangered Japanese eel Anguilla japonica
- Journal of Oceanology and Limnology, 38(5): 1572-1583
- http://dx.doi.org/10.1007/s00343-020-0048-z
Article History
- Received Feb. 10, 2020
- accepted in principle Mar. 26, 2020
- accepted for publication May. 14, 2020


2 Laboratory for Marine Ecology and Environmental Science, Pilot National Laboratory for Marine Science and Technology(Qingdao), Qingdao 266237, China;
3 University of Chinese Academy of Sciences, Beijing 100049, China;
4 Center for Ocean Mega-Science, Chinese Academy of Sciences, Qingdao 266071, China
The Japanese eel (Anguilla japonica) is a temperate catadromous anguillid eel, distributed in the rivers of China (China's mainland and Taiwan region), Japan, and Korea (Tesch, 1977). It spawns in the waters to the west of Mariana Islands near 14°N–16°N, 142°E (Tsukamoto, 1992, 2006), 2 000 to 3 500 km away from the East Asian continent. The leptocephali hatch between April and November (Tsukamoto, 1990; Tzeng, 1990; Tsukamoto et al., 2003), and then drift with the currents, reaching the coasts of East Asia in 4 to 6 months. They metamorphose into glass eels along the continental shelf and then enter estuaries where they continue to grow as elvers (Tesch, 2003). Elvers grow to yellow eels during their upstream migration, and yellow eels spend the next 5 to 10 years in freshwater rivers. Once eels attain sexual maturity, they migrate back to spawning ground for reproduction (Tesch, 1977).
The Japanese eel is a commercially important fish species in East Asia. And the stocks are outside safe biological limits and the fishery has not been sustainable in recent years. The Japanese eel population is currently estimated to be less than 10% of 1970s level (Dekker, 2003), and it is classified as "Endangered" by the International Union for Conservation of Nature (IUCN) Red List (https://www.iucnredlist.org/species/166184/1117791). Although the exact reason for the decline is unclear, there is a direct correlation between the decline in eel catch and population size to the habitat modifications and impediments to upstream migration (Itakura et al., 2015). Other reasons such as pollution, disease, oceanic climate change and habitat losses could also influence the abundance of the Japanese eel population (Arai, 2014). However, the reliance of eel aquaculture on wild-caught juveniles or glass eel seems to be more important reason (Tsukamoto, 2013). Due to the large distribution range of A.japonica, the effective management needs to involve the efforts from all countries within its range. And clarifying the genetic population structure of A.japonica is the basis of multinational cooperation on management and protection. In addition, it is also of vital importance to understand the genetic consequences of external disturbance to this endangered species, such as on-going climate change, ocean warming and overfishing.
Some work has been conducted to test panmixia of A. japonica using different molecular markers; however, the results are not consistent with each other. Panmixia was accepted based on analyses on mtDNA sequences (Sang et al., 1994; Ishikawa et al., 2001). Microsatellite markers, which have more power in studying population structure, were also used to solve this problem. Tseng et al. (2006) divided the populations of A. japonica into two groups based on eight microsatellite markers, and they found no isolation by distance (IBD) pattern in either group. The results challenged the panmixia hypothesis by finding small but significant genetic differences. However, the study used a small number of markers and reported higher temporal than geographic difference. Notwithstanding the results have rejected the null hypothesis of panmixia for the genetic structure of anguillid eels, several studies have challenged this opinion recently. Han et al. (2010) used eight microsatellite markers analyzing the spatial and temporal structure of A. japonica. Although a significant difference was seen among annual cohorts and spatial samples, no specific temporal or spatial scale patterns were observed in the pairwise FST tests or the phylogenetic tree of all samples and the results of the IBD test and the isolation by time (IBT) test were both insignificant. A stable genetic structure could not be observed. The result provided evidence for panmixia. After that, Minegishi et al. (2012) also found no significant genetic difference among 9 localities using 6 microsatellite markers and reported that Japanese forms a panmictic population.
Traditional approach using neutral markers have reported shallow population structure in many marine fishes, which is assumed to be the result of high levels of gene flow. However, in species with large effective population size, the weak genetic structure could also result from the limited effects of genetic drift (Hauser and Carvalho, 2008). Russello et al. (2012) detected ecotype-level divergence using 8 outlier loci in Okanagan Lake kokanee (Oncorhynchus nerka); however, there was no evidence of divergence at neutral loci. Milano et al. (2014) detected a dramatic divergence between Atlantic and Mediterranean populations and fine-scale significant population structure in European hake (Merluccius merluccius) using outlier loci, which was not revealed using neutral loci. Many marine organisms have relatively large effective population size, and they are under limited effects of genetic drift. In such a scenario, gene-associated markers might have more power in unveiling the cryptic genetic population structure than neutral markers.
Local adaptation is how organism response to selective pressures in their local habitats, acting on genetically controlled fitness differences among individuals (Rellstab et al., 2015). Since eels are panmictic and show no philopatry (Als et al., 2011; Pujolar et al., 2014), long-term local adaptation is not possible in eels but single-generation signatures of local selection still can be detected (Gagnaire et al., 2012; Pujolar et al., 2014), which is a completely different scenario relative to other species. In other fish species, fish can adapt to local conditions and those individuals more resistant to adverse environmental condition in a population will survive, while less adapted individuals will not, and this is passed on to the next generation. However, this is not the case in eels: Individuals may have some good genetic combinations which provide good adaptation for survival in their freshwater habitat, however, habitats for offspring of these individuals would change due to random dispersal, which could lead to the loss of these adaptations. Trans-generational signatures of selection cannot be detected while within-generation selection acting on genes could be found. Recently, gene-associated markers have shown their power in detecting signature of selection in several organisms. In the case of anguillid eels, signature of selection is much more difficult to find, due to the special migratory features. However, recent studies have found signature of selection in North Atlantic eels. Gagnaire et al. (2012) scanned for footprints of selection in the American eel (Anguilla rostrata) using a panel of 100 single nucleotide polymorphisms (SNPs) and found the allele frequencies of thirteen loci had a correlation with environmental factors. In the study of European eel (Anguilla anguilla) using the same SNP panel, 10 loci were detected showing genetic-by-environment associations (Ulrik et al., 2014). Pujolar et al. (2014) detected signature of selection in the European eel using 50 354 restriction-site-associated DNA sequencing (RAD) generated SNPs, and dozens of loci showed evidence of divergent selection. However, the study on local adaptation is still absent in A. japonica.
The previous studies have led to conflicting results on panmixia, but all previous studies used a very limited (6–8) number of microsatellites. In the present study, 24 polymorphic gene-associated microsatellite markers were developed for A. japonica. These markers were then used to test the hypothesis of panmixia and to detect footprints of selection in A. japonica.
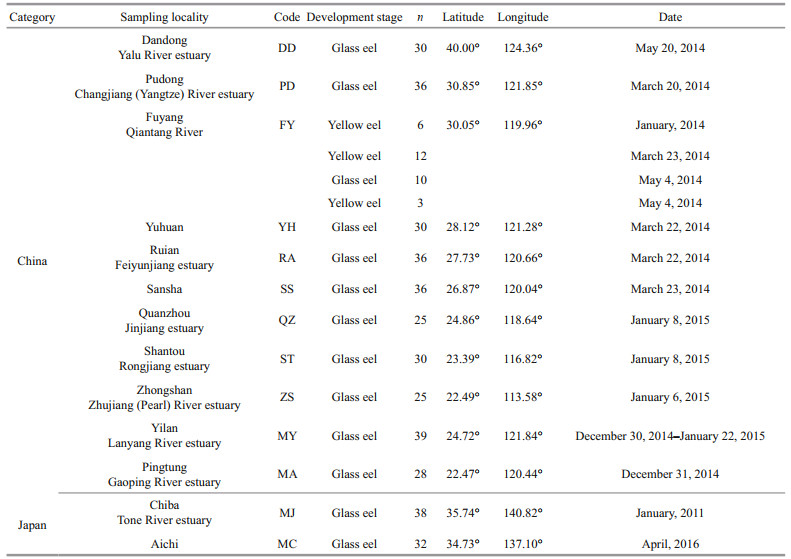
2 MATERIAL AND METHOD 2.1 Sampling and DNA extractionGlass eels or yellow eels were collected from 13 sampling locations spanning the natural species distribution between January 2011 and April 2016 (Table 1), and the whole organism of these eels was preserved in 95% ethanol. Whole genomic DNA was extracted using a standard phenol-chloroform extraction and ethanol precipitation, following the proteinase K digestion.
|
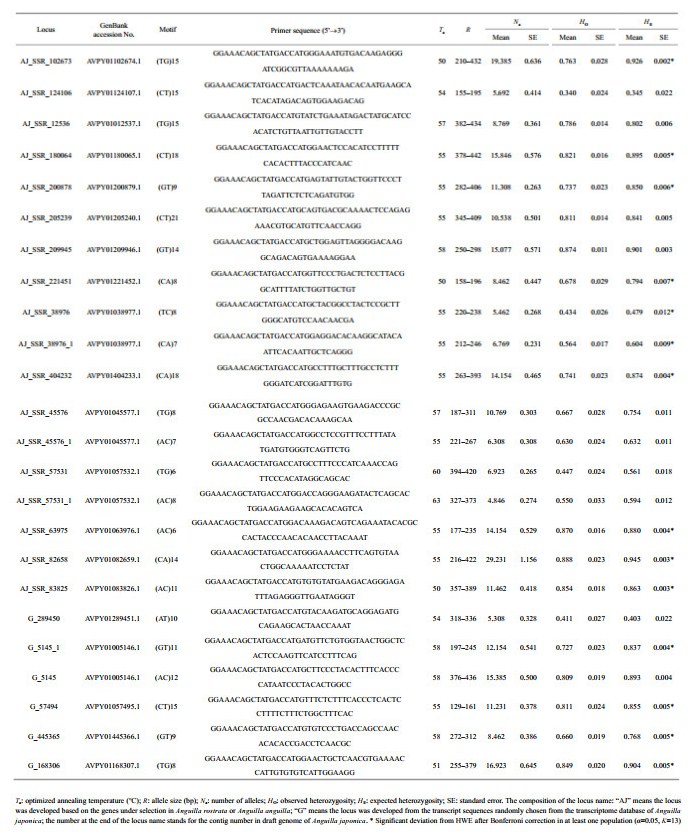
Microsatellite loci were obtained in two ways. Firstly, we searched for the transcript sequences of the genes against the online transcriptome database for A. japonica (http://molas.iis.sinica.edu.tw/jpeel/) built by Hsu et al. (2015) using the names of selected genes in A. rostrata (Gagnaire et al., 2012) and A. anguilla (Pujolar et al., 2014) as keyword. The detail information of the microsatellite loci in each transcript sequence were obtained using MISA software (http://pgrc.ipk-gatersleben.de/misa). Secondly, we developed another panel of microsatellite loci from the transcript sequences randomly chosen from the database of A. japonica. To obtain a longer flanking region for primer design, each transcript sequence with the microsatellite locus was mapped on the draft genome of A. japonica (Henkel et al., 2012). Finally, Premier 5.0 software (Premier Biosoft International, Palo Alto, CA, USA) was used to design primers. 23 primer pairs were designed on the basis of the gene under selection in North Atlantic eels and 12 primer pairs were designed from transcript sequence randomly selected from database. Out of the 36 primer sets, 24 primer pairs consistently amplified fragments of the expected size and were polymorphic. Among the 24 polymorphic loci, 18 loci were developed associated with the gene under selection in North Atlantic eels, and the other 6 loci were developed based on transcript sequence which were randomly selected from the database. PCR was carried out using a three-primer system (Liu and Avise, 2011). All forward primers were 5′ tailed with a M13 forward sequence (5′-GGAAACAGCTATGACCAT-3′). An M13 primer of the same sequence but 5′-labelled with three different fluorescent dyes was used in combination with forward primers. All loci were amplified separately on a Mastercycler (Eppendorf). The PCR consisted of approximately 50 ng genomic DNA, 2 μL of 5× buffer (Promega, Madison, WI), 0.2 mmol/L of each dNTP, 0.2 μmol/L labeled M13 reverse primer and locus specific primer without tail, 0.02 μmol/L locus specific primer with M13 reverse tail, 0.25 U Taq DNA polymerase (Promega, Madison, WI) and water up to 10 μL. The thermal cycling protocol consisted of 3 min at 95℃ followed by 35 cycles of 20 s at 95℃, 52 s at 52℃ and 30 s at 72℃, and a final elongation of 10 min at 72℃. PCR products labelled with different fluorescent primers were pooled and electrophoresis was made on an ABI 3730xl automated sequencer (Applied Biosystems). Size determination of alleles were made by comparison with the GS500-ROX size standard using GeneMarker (SoftGenetics, State College, USA).
2.3 Genetic diversity analysisGenetic diversity indices including observed heterozygosity (HO), expected heterozygosity (HE), the number of alleles (Na), and inbreeding coefficient (FIS) were calculated using GenAlEX 6.5 (Peakall and Smouse, 2006, 2012). The presence of null alleles was assessed using MICRO-CHECKER software version 2.2.3 (Van Oosterhout et al., 2004). Genotypic linkage disequilibrium (LD) and deviation from Hardy-Weinberg equilibrium (HWE) were estimated using GENEPOP 4.5.1 (Rousset, 2008). The significant thresholds for HWE and LD tests were adjusted using Bonferroni correction.
2.4 Population structureGlobal FST value across all populations was calculated using FSTAT version 2.9.3.2 (Goudet, 2001). Pairwise FST values between all populations were obtained using ARLEQUIN 3.5 (Excoffier and Lischer, 2010) and significance was assessed by 10 000 bootstrapping permutations. A modified false discovery rate (FDR) correction was applied to adjust the significant threshold of pairwise FST values (Benjamini and Yekutieli, 2001). The Bayesian clustering program STRUCTURE version 2.3.4 (Pritchard et al., 2000), was used to infer population structure and assign individuals to populations. Admixture model was used, assuming correlated allele frequency, with the option of 'with no prior knowledge of sampling locations'. The program was run with an initial burn-in of 100 000 cycles and 1 000 000 Markov chain Monte Carlo (MCMC) repetitions, and K was modeled from K=1 to K=13. Runs were iterated 10 times for each K. The optimal value of ΔK was determined according to Evanno et al. (2005) method using StructureSelector (Li and Liu, 2018).
2.5 Footprints of selectionThe FST outlier approach (Beaumont and Nichols, 1996) implemented in LOSITAN (Antao et al., 2008) was used to identify outlier loci. The program generated a plot of FST vs heterozygosity.
One hundred thousand simulations were performed using the stepwise mutation model (SMM) and the neutrality of microsatellite markers was determined. Markers having FST values higher than the 95% confidence interval were inferred to be subject to divergent selection, and markers having FST values lower than the 95% confidence interval were inferred to be subject to balancing selection. False discovery rate was set to 0.01.
Spatial analysis method (SAM) was used to assess the association between allelic frequencies and environmental variables, based on multiple univariate logistic regression (Joost et al., 2007). Environmental factors were chosen including degrees north latitude, degrees east longitude, and sea-surface temperature at river mouth averaged across the 10 days, 30 days and 3 months that preceded the sampling date. Temperature data were acquired from a National Oceanic and Atmospheric Administration (NOAA) database containing geo-referenced sea-surface temperatures. The FY population was excluded from this analysis, because the sample included different development stages and the sampling date was also different. Two populations (MJ and MC) from Japan and one population from Taiwan, China (MY) were excluded from genotype-temperature association analysis, because the samples were collected from different date in the same month.
3 RESULT 3.1 Genetic diversityThe average number of alleles per locus across populations ranged from 4.846 (SE=0.274) to 29.231 (SE=1.156) (Table 2). The HO and HE of each sample ranged from 0.675 (SE=0.038) and 0.746 (SE=0.039) to 0.716 (SE=0.033) and 0.769 (SE=0.034) (Table 3). Among a total of 312 sample x locus combinations, 29 were deviated from HWE after Bonferroni corrections (α=0.05, K=13). After Bonferroni correction, no linkage disequilibrium was detected (α=0.05, K=276). Null alleles existed at eight loci in more than three samples (not in all samples).
|

|
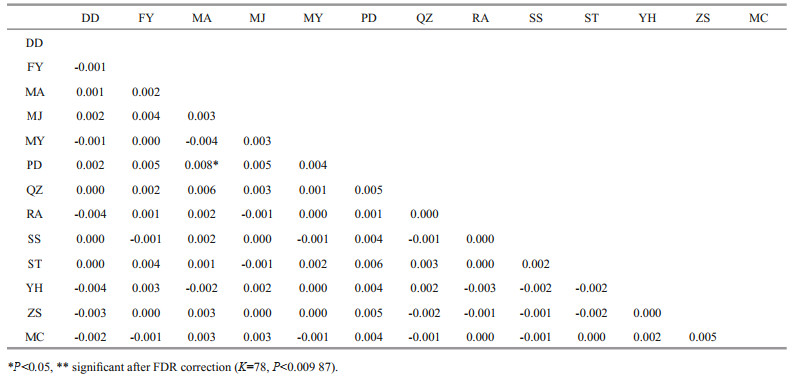
The global non-significant FST value of -0.001 (95% CI: -0.002 < FST < 0.000) indicated that there was no significant genetic differentiation among these samples. None of the pairwise FST values were significant after FDR correction (α=0.05, K=78) (Table 4). STRUCTURE analysis identified K=6 was the optimal number of clusters (Fig. 1). However, all populations showed similar patterns when K=6, demonstrating no genetic structure (Fig. 2).

|
| Fig.1 The scatter plot of possible number of clusters against ad hoc statistic ΔK |

|
| Fig.2 STRUCTURE result based on 24 gene-associated microsatellite markers for 13 geographic populations (K=6) |
No outlier was found in outlier analysis (Fig. 3). No significant correlations were found in SAM, indicating that the 24 loci were not under spatially varying selection.

|
| Fig.3 Outlier test result from LOSITAN software |
Japanese eel has long been considered having a panmictic population structure because sexually matured eels from their distribution range migrate and spawn in a single spawning site and the larvae disperse from the spawning site via the North Equatorial Current (NEC) and the Kuroshio Current (KC) and are transported back to the freshwater habitats randomly. However, there is still debate on the hypothesis of panmixia for A. japonica. Chan et al. (1997) detected spatial genetic heterogeneity in A. japonica using allozyme markers, the significant clinal shift in allelic frequency was putatively attributed to single-generation selection along an environment gradient (Avise, 2003). The geographic range of the sampling sites in our study was similar to that in Chan et al. (1997), however, we found no spatial heterogeneity in the gene frequency of the 24 microsatellites. Tseng et al. (2006) divided the populations of A. japonica into two groups including a low-latitude group (South China and Taiwan, China) and a high-latitude group (Japan, Korea, and North China) using eight microsatellite markers. However, their study used a small number of markers and reported higher temporal difference than geographic difference. Han et al. (2010) suggested that the genetic partitioning detected in Tseng et al. (2006) could be the results of 'chaotic genetic patchiness' and random variations in parental contributions to reproductive activity, incomplete mixing of larvae and kin aggregation might contribute to the subdivision of the Japanese eel population. Han et al. (2010) conducted the most comprehensive study on A. japonica using microsatellite markers and confirmed panmixia of this species.
In the present study, all measures of differentiation were accordant with a panmixia scenario. Our results supported the hypothesis of panmixia in A. japonica. Great efforts have been put into the study of genetic population structure for A. japonica, however, no one has ever tried to use gene-associated markers. Gene-associated makers can be a good option to detect subtle genetic population differentiation in marine organisms. On one hand, traditional neutral markers may be ineffective when populations are recently isolated, and divergence is not yet reflected at neutral loci (Russello et al., 2012). On the other hand, genetic drift has little effects in species with large effective population size (such as marine fishes), which may weaken the power of neutral markers (Milano et al., 2014). At gene-associated markers putatively under selection, genetic differentiation could be larger than that at loci in which among-population differences are caused by genetic drift (Holsinger and Weir, 2009).
There are several studies showing the power of outlier loci in detecting population structure. Russello et al. (2012) successfully detected ecotype-level divergence using eight outlier microsatellite markers, whereas there was no evidence of divergence at neutral loci. By using outlier loci, Milano et al. (2014) revealed a dramatic divergence between Atlantic and Mediterranean populations of European hake and fine-scale significant population structure among regional populations, which was not detected by using neutral markers. Another advantage of the markers in this study is their potential transferability across taxonomic boundaries. Compared with traditional microsatellite markers, microsatellite markers based on transcript sequences are potentially more transferable across taxonomic boundaries (Chagné et al., 2004; Liewlaksaneeyanawin et al., 2004; Gutierrez et al., 2005; Pashley et al., 2006).
For the first time, our study confirmed the panmixia of A. japonica using gene-associated microsatellite markers. We suggested that A. japonica should be managed as a single unit. Management and conservation efforts must be coordinated at the transnational level, as over-exploitation in any region will decrease recruitment across its whole distributional range.
4.2 Different pattern of spatially varying selection from North Atlantic eelsBoth LOSITAN and SAM analysis detected no signals of spatially varying selection. These results indicated that the 24 loci were not targets of spatially varying selection and were nearly neutral genetic markers for Japanese eel. Since most of the microsatellite markers used are associated with the genes under selection in the North Atlantic eels, our results suggested that different selection pattern existed between Japanese eel and the North Atlantic eels. Furthermore, two recent studies found no overlap of loci under selection in the two North Atlantic eel species either. Gagnaire et al. (2012) scanned for footprints of selection in the American eel using a panel of 100 SNPs and 13 loci showed significant correlations between allele frequencies and environmental variables. Ulrik et al. (2014) found evidence for spatially varying selection at 10 loci in the European eel using the same SNP panel; however, none of these were the same loci that showed significant associations in the American eel. The contrasting results in the two species suggested that there were two different patterns of selection in the North Atlantic eels, at least at the level of the individual genes assessed (Hemmer-Hansen et al., 2014). Our results suggested that A. japonica might occupy a third selection pattern, which was different from both the North Atlantic eel species. Due to the latitudinal (rather than longitudinal) spread of freshwater habitats and the longer migration distance to the spawning site of Japanese eel (Chan et al., 1997), the selection pattern between Japanese eel and the North Atlantic eels could be different. Different migration patterns causes distinct selective pressures. With the advances of next-generation sequencing technology, genome wide SNPs have been adopted in population genomic studies of marine fishes. Pujolar et al. (2014) detected signatures of selection using 50 354 RAD-generated SNPs and found dozens of loci associated with the highly variable environmental conditions experienced by European eel along its geographic range. However, study of local adaptation in A. japonica by using genome wide genetic variations is still absent. A better understanding for genetic mechanism of local adaptation in A. japonica could be achieved when genome wide markers were applied in the near future.
5 CONCLUSIONFor the first time, our study developed twenty-four gene-associated microsatellite markers and confirmed panmixia of A. japonica by using these microsatellites. The results suggested that A.japonica should be managed as a single unit. Management and conservation efforts must be coordinated at the transnational level, as over-exploitation in any region will decrease the recruitment of this species. Efforts were also made to detect signature of selection and no footprints of spatially varying selection were found, indicating that A. japonica might occupy a different pattern of selection from North Atlantic eels. The study on population genetic structure and local adaptation in A. japonica is far from complete. A whole-genome level study using population genomic approaches is needed in the future, which could help to elucidate the population structure and genetic mechanism underlying the spatially varying selection for geographic populations of A. japonica.
6 DATA AVAILABILITY STATEMENTThe datasets used and/or analyzed during the current study are available from the corresponding author on reasonable request.
7 ACKNOWLEDGMENTWe thank Dr. LI Yulong for his help in data analysis. Thanks Dr. LIU Bingjian, Dr. Yokogawa Koji, and Dr. HAN Yusan from National Taiwan University, China, for their help in collecting the samples.
Als T D, Hansen M M, Maes G E, Castonguay M, Riemann L, Aarestrup K, Munk P, Sparholt H, Hanel R, Bernatchez L. 2011. All roads lead to home:panmixia of European eel in the Sargasso Sea. Molecular Ecology, 20(7): 1 333-1 346.
DOI:10.1111/j.1365-294X.2011.05011.x |
Antao T, Lopes A, Lopes R J, Beja-Pereira A, Luikart G. 2008. LOSITAN:a workbench to detect molecular adaptation based on a Fst-outlier method. BMC Bioinformatics, 9: 323.
DOI:10.1186/1471-2105-9-323 |
Arai T. 2014. How have spawning ground investigations of the Japanese eel Anguilla japonica contributed to the stock enhancement?. Reviews in Fish Biology and Fisheries, 24(1): 75-88.
DOI:10.1007/s11160-013-9318-6 |
Avise J C. 2003. Catadromous eels of the North Atlantic: a review of molecular genetic findings relevant to natural history, population structure, speciation, and phylogeny.In: Aida K, Tsukamoto K, Yamauchi K eds. Eel Biology.Springer, Tokyo. p.31-48, https: //doi.org/10.1007/978-4-431-65907-5_3.
|
Beaumont M A, Nichols R A. 1996. Evaluating loci for use in the genetic analysis of population structure. Proceedings of the Royal Society B:Biological Sciences, 263(1377): 1 619-1 626.
DOI:10.1098/rspb.1996.0237 |
Benjamini Y, Yekutieli D. 2001. The control of the false discovery rate in multiple testing under dependency. Annals of Statistics, 29(4): 1 165-1 188.
DOI:10.1214/aos/1013699998 |
Chagné D, Chaumeil P, Ramboer A, Collada C, Guevara A, Cervera M T, Vendramin G G, Garcia V, Frigerio J M, Echt C, Richardson T, Plomion C. 2004. Cross-species transferability and mapping of genomic and cDNA SSRs in pines. Theoretical and Applied Genetics, 109(6): 1 204-1 214.
DOI:10.1007/s00122-004-1683-z |
Chan I K K, Chan D K O, Lee S C, Tsukamoto K. 1997. Genetic variability of the Japanese eel Anguilla japonica(Temminck & Schlegel) related to latitude. Ecology of Freshwater Fish, 6(1): 45-49.
DOI:10.1111/j.1600-0633.1997.tb00141.x |
Dekker W. 2003. Did lack of spawners cause the collapse of the European eel, Anguilla anguilla?. Fisheries Management and Ecology, 10(6): 365-376.
DOI:10.1111/j.1365-2400.2003.00352.x |
Evanno G, Regnaut S, Goudet J. 2005. Detecting the number of clusters of individuals using the software STRUCTURE:a simulation study. Molecular Ecology, 14(8): 2 611-2 620.
DOI:10.1111/j.1365-294X.2005.02553.x |
Excoffier L, Lischer H E L. 2010. Arlequin suite ver 3.5:a new series of programs to perform population genetics analyses under Linux and Windows. Molecular Ecology Resources, 10(3): 564-567.
DOI:10.1111/j.1755-0998.2010.02847.x |
Gagnaire P A, Normandeau E, Côté C, Hansen M M, Bernatchez L. 2012. The genetic consequences of spatially varying selection in the Panmictic American Eel (Anguilla rostrata). Genetics, 190(2): 725-703.
DOI:10.1534/genetics.111.134825 |
Goudet J. 2001. FSTAT version 2.9.3.2. A program to estimate and test gene diversities and fixation indices. Institute of Ecology, Lausanne, Switzerland.
|
Gutierrez M V, Patto M C V, Huguet T, Cubero J I, Moreno M T, Torres A M. 2005. Cross-species amplification of Medicago truncatula microsatellites across three major pulse crops. Theoretical and Applied Genetics, 110(7): 1 210-1 217.
DOI:10.1007/s00122-005-1951-6 |
Han Y S, Hung C L, Liao Y F, Tzeng W N. 2010. Population genetic structure of the Japanese eel Anguilla japonica:panmixia at spatial and temporal scales. Marine Ecology Progress Series, 401: 221-232.
DOI:10.3354/meps08422 |
Hauser L, Carvalho G R. 2008. Paradigm shifts in marine fisheries genetics:ugly hypotheses slain by beautiful facts. Fish and Fisheries, 9(4): 333-362.
DOI:10.1111/j.1467-2979.2008.00299.x |
Hemmer-Hansen J, Therkildsen N O, Pujolar J M. 2014. Population genomics of marine fishes:next-generation prospects and challenges. Biological Bulletin, 227(2): 117-132.
DOI:10.1086/BBLv227n2p117 |
Henkel C V, Dirks R P, de Wijze D L, Minegishi Y, Aoyama J, Jansen H J, Turner B, Knudsen B, Bundgaard M, Hvam K L, Boetzer M, Pirovano W, Weltzien F A, Dufour S, Tsukamoto K, Spaink H P, van den Thillart G E E J M. 2012. First draft genome sequence of the Japanese eel, Anguilla japonica. Gene, 511(2): 195-201.
DOI:10.1016/j.gene.2012.09.064 |
Holsinger K E, Weir B S. 2009. Genetics in geographically structured populations:defining, estimating and interpreting FST. Nature Reviews Genetics, 10(9): 639-650.
DOI:10.1038/nrg2611 |
Hsu H Y, Chen S H, Cha Y R, Tsukamoto K, Lin C Y, Han Y S. 2015. De novo assembly of the whole transcriptome of the wild embryo, preleptocephalus, leptocephalus, and glass eel of Anguilla japonica and deciphering the digestive and absorptive capacities during early development. PLoS One, 10(9): e0139105.
DOI:10.1371/journal.pone.0139105 |
Ishikawa S, Aoyama J, Tsukamoto K, Nishida M. 2001. Population structure of the Japanese eel Anguilla japonica as examined by mitochondrial DNA sequencing. Fisheries Science, 67(2): 246-253.
DOI:10.1046/j.1444-2906.2001.00227.x |
Itakura H, Kitagawa T, Miller M J, Kimura S. 2015. Declines in catches of Japanese eels in rivers and lakes across Japan:have river and lake modifications reduced fishery catches?. Landscape and Ecological Engineering, 11(1): 147-160.
DOI:10.1007/s11355-014-0252-0 |
Joost S, Bonin A, Bruford M W, Després L, Conord C, Erhardt G, Taberlet P. 2007. A spatial analysis method (SAM) to detect candidate loci for selection:towards a landscape genomics approach to adaptation. Molecular Ecology, 16(18): 3 955-3 969.
DOI:10.1111/j.1365-294X.2007.03442.x |
Li Y L, Liu J X. 2018. StructureSelector:a web-based software to select and visualize the optimal number of clusters using multiple methods. Molecular Ecology Resources, 18(1): 176-177.
DOI:10.1111/1755-0998.12719 |
Liewlaksaneeyanawin C, Ritland C E, El-Kassaby Y A, Ritland K. 2004. Single-copy, species-transferable microsatellite markers developed from loblolly pine ESTs. Theoretical and Applied Genetics, 109(2): 361-369.
DOI:10.1007/s00122-004-1635-7 |
Liu J X, Avise J C. 2011. High degree of multiple paternity in the viviparous Shiner Perch, Cymatogaster aggregata, a fish with long-term female sperm storage. Marine Biology, 158(4): 893-901.
DOI:10.1007/s00227-010-1616-0 |
Milano I, Babbucci M, Cariani A, Atanassova M, Bekkevold D, Carvalho G R, Espiñeira M, Fiorentino F, Garofalo G, Geffen A J, Hansen J H, Helyar S J, Nielsen E E, Ogden R, Patarnello T, Stagioni M, Consortium F, Tinti F, Bargelloni L. 2014. Outlier SNP markers reveal fine-scale genetic structuring across European hake populations(Merluccius merluccius). Molecular Ecology, 23(1): 118-135.
DOI:10.1111/mec.12568 |
Minegishi Y, Aoyama J, Yoshizawa N, Tsukamoto K. 2012. Lack of genetic heterogeneity in the Japanese eel based on a spatiotemporal sampling. Coastal Marine Science, 35(1): 269-276.
|
Pashley C H, Ellis J R, McCauley D E, Burke J M. 2006. EST databases as a source for molecular markers:lessons from Helianthus. Journal of Heredity, 97(4): 381-388.
DOI:10.1093/jhered/esl013 |
Peakall R, Smouse P E. 2006. GENALEX 6:genetic analysis in Excel. Population genetic software for teaching and research. Molecular Ecology Notes, 6(1): 288-295.
DOI:10.1111/j.1471-8286.2005.01155.x |
Peakall R, Smouse P E. 2012. GenAlEx 6.5:genetic analysis in Excel. Population genetic software for teaching and research-an update. Bioinformatics, 28(19): 2 537-2 539.
DOI:10.1093/bioinformatics/bts460 |
Pritchard J K, Stephens M, Donnelly P. 2000. Inference of population structure using multilocus genotype data. Genetics, 155(2): 945-959.
|
Pujolar J M, Jacobsen M W, Als T D, Frydenberg J, Munch K, Jónsson B, Jian J B, Cheng L, Maes G E, Bernatchez L, Hansen M M. 2014. Genome-wide single-generation signatures of local selection in the panmictic European eel. Molecular Ecology, 23(10): 2 514-2 528.
DOI:10.1111/mec.12753 |
Rellstab C, Gugerli F, Eckert A J, Hancock A M, Holderegger R. 2015. A practical guide to environmental association analysis in landscape genomics. Molecular Ecology, 24(17): 4 348-4 370.
DOI:10.1111/mec.13322 |
Rousset F. 2008. GENEPOP' 007:a complete reimplementation of the GENEPOP software for Windows and Linux. Molecular Ecology Resources, 8(1): 103-106.
DOI:10.1111/j.1471-8286.2007.01931.x |
Russello M A, Kirk S L, Frazer K K, Askey P J. 2012. Detection of outlier loci and their utility for fisheries management. Evolutionary Applications, 5(1): 39-52.
DOI:10.1111/j.1752-4571.2011.00206.x |
Sang T K, Chang H Y, Chen C T, Hui C F. 1994. Population structure of the Japanese eel, Anguilla japonica. Molecular Biology and Evolution, 11(2): 250-260.
|
Tesch F W. 1977. The Eel:Biology and Management of Anguillid Eels. Chapman & Hall, London. p.81-240.
|
Tesch F W. 2003. The Eel. Blackwell Science, Oxford. p.119-202.
|
Tseng M C, Tzeng W N, Lee S C. 2006. Population genetic structure of the Japanese eel Anguilla japonica in the northwest Pacific Ocean:evidence of non-panmictic populations. Marine Ecology Progress Series, 308: 221-230.
DOI:10.3354/meps308221 |
Tsukamoto K, Otake T, Mochioka N, Lee T W, Fricke H, Inagaki T, Aoyama J, Ishikawa S, Kimura S, Miller M J, Hasumoto H, Oya M, Suzuki Y. 2003. Seamounts, new moon and eel spawning:the search for the spawning site of the Japanese eel. Environmental Biology of Fishes, 66(3): 221-229.
DOI:10.1023/A:1023926705906 |
Tsukamoto K. 1990. Recruitment mechanism of the eel, Anguilla japonica, to the Japanese Coast. Journal of Fish Biology, 36(5): 659-671.
DOI:10.1111/j.1095-8649.1990.tb04320.x |
Tsukamoto K. 1992. Discovery of the spawning area for Japanese Eel. Nature, 356: 789-791.
DOI:10.1038/356789a0 |
Tsukamoto K. 2006. Spawning of eels near a seamount. Nature, 439: 929-929.
DOI:10.1038/439929a |
Tsukamoto K. 2013. Advances in Aquaculture for the production of artificial glass eel to help conserve Anguillid Eel Populations Worldwide. Presented at the World Fisheries Congress, Edinburgh, The University of Tokyo, Japan.
|
Tzeng W N. 1990. Relationship between growth rate and age at recruitment of Anguilla japonica elvers in a Taiwan estuary as inferred from otolith growth increments. Marine Biology, 107(1): 75-81.
DOI:10.1007/BF01313244 |
Ulrik M G, Pujolar J M, Ferchaud A L, Jacobsen M W, Als T D, Gagnaire P A, Frydenberg J, Bøcher P K, Jónsson B, Bernatchez L, Hansen M M. 2014. Do North Atlantic eels show parallel patterns of spatially varying selection?. BMC Evolutionary Biology, 14: 138.
DOI:10.1186/1471-2148-14-138 |
Van Oosterhout C, Hutchinson W F, Wills D P M, Shipley P. 2004. MICRO-CHECKER:software for identifying and correcting genotyping errors in microsatellite data. Molecular Ecology Notes, 4(3): 535-538.
DOI:10.1111/j.1471-8286.2004.00684.x |