 2020, Vol. 38
Institute of Oceanology, Chinese Academy of Sciences
Article Information
- YU Yang, DONG Changming, SHAN Haixia, ZOU Bin
- Statistical analysis of intensity variations in tropical cyclones in the East China Sea passing over the Kuroshio
- Journal of Oceanology and Limnology, 38(6): 1632-1639
- http://dx.doi.org/10.1007/s00343-019-9069-x
Article History
- Received Mar. 13, 2019
- accepted in principle Aug. 6, 2019
- accepted for publication Aug. 21, 2019


2 National Satellite Ocean Application Service, Ministry of Natural Resources, Beijing 100080, China;
3 Southern Laboratory of Ocean Science and Engineering, Zhuhai 519000, China
Tropical cyclones are one of the most catastrophic extreme weather processes in China, and cause storm surges, huge waves, and other destructive phenomena in the areas of typhoon hit (Price, 1981; Shay et al., 2000; Wada et al., 2014). At present, the forecast on tropical cyclone's track is effective, but the forecast on the intensity changes of tropical cyclones are less than satisfactory. The hurricane intensity forecast of the National Hurricane Center (NHC) has an error of more than 20 m/s in about 5% of hurricanes within 24 h (Rogers et al., 2013). There are many factors affecting the forecasting accuracy among them, air-sea interaction is an important aspect affecting the forecasting accuracy of tropical cyclones. Especially when tropical cyclones passing over local high-temperature areas, such as the western boundary warm currents (Gulf Stream in the North Atlantic and Kuroshio in the North Pacific), tropical cyclones are strongly affected (Bright et al., 2002). Sea surface temperature (SST) also plays a crucial role in the formation and development of tropical cyclones. The changes in the distribution and magnitude changes of SST are closely related to the intensity of tropical cyclones. High-temperature seawater provides the energy to tropical cyclones by heat transfer (sensible heat and latent heat), and tropical cyclones are formed only on sea surface with SST above 26℃ (Emanuel, 2001). While tropical cyclones pass over, they also cause thermocline cold water upwelling through entrainment or pumping (Chen et al., 2013).
In studies of the effects of Gulf Stream on the changes in tropical cyclones intensity, Bright et al. (2002) used the measured data of the intensity and track of the tropical cyclones in the Gulf of Mexico in 1944–2000 to statistically analyze the effects on the Gulf Stream on the changes in the intensity of tropical cyclones. Galarneau et al. (2013) analyzed that typhoon Sandy (2012) that landed in New Jersey in 2012, was intensified two times when passing over the Gulf Stream and the minimum central pressure (MCP) decreased by 60 hPa and 70 hPa, respectively, and then proposed that the warm water of the Gulf Stream would form a warm seclusion and cause an increase in hurricane intensity. Lin et al. (2005) also found that Bret (1999) was rapidly intensified after passing over a warm vortex.
The Kuroshio is a warm current that is diverted to the northeast from the east side of Taiwan, China, after entering the ECS. It is featured with high temperature, high salinity, a large flow, and has an important impact on East Asian climate. Most of the analysis of the effect of the Kuroshio in the ECS on the intensity change of tropical cyclones focus on super typhoons (Xue et al., 2007; Chang et al., 2008; Wu et al., 2008; Wei et al., 2015; Zhou and Xu, 2015). When Saomai (2006) passes over the high-temperature Kuroshio region, the low-level cyclonic circulation is intensified, causing the upper-level divergence of the atmosphere, making a great amount of water vapor accumulated, converged and rose, and releasing the latent heat (Xue et al., 2007). Zhou and Xu (2015) point that, when using the Weather Research and Forecasting Model (WRF) to simulate the typhoon process, the warm water of the Kuroshio could promote the cumulus convection of the upper atmosphere if there are the areas with high convective precipitation, the positive SST, and the maximal difference of convective available potential energy at the same time. Wu et al. (2008) find that Nari (2001) decreases the SST of the Kuroshio by 5℃, but its intensity continues to increase when it crosses the Kuroshio for multiple times, which is mainly due to that the regional upwelling and cooling effect causes by cyclones could be compensated by the heat transferred by the ocean warm vortex. There is a lack of systematicity in the study of the effects of the Kuroshio in the ECS on the intensity change of tropical cyclones. The purpose of this paper is to statistically analyze the intensity changes before and after the TCs in the ECS interacting the Kuroshio and to systematically discuss the intensity change of such TCs under the action of the Kuroshio.
The structure of this paper is organized as follows. Section 2 is the introduction of the data used. Section 3 is the results of the statistical analysis, including the statistical results of the Kuroshio's effect on the change of TC intensity, the seasonal distribution of the Kuroshio's effect on the change of TC intensity, and the parametric analysis of TC intensification caused by Kuroshio. Sections 4 and 5 are the discussions and conclusions, respectively.
2 MATERIAL AND METHODThe data used in this paper include:
Sea surface temperature (SST) data is the daily data provided by the National Oceanographic Data Center of the United States (REMSS SST Analysis, download from: ftp://ftp.nodc.noaa.gov/pub/data. nodc), with a resolution of 0.09°×0.09° and a period from January 12, 2002 to December 31, 2016.
Tropical cyclone data is the 1949-2016 tropical cyclone optimal tracks dataset (download from: http://www.typhoon.org.cn/) with a temporal resolution of 6 h provided by the China Meteorological Administration, including the latitude and longitude of the tropical cyclones center in the West Pacific Ocean, the atmospheric pressure at the center, and the maximum wind speed.
The flow field data at the sea surface is the observation data at depth of 15 m which are obtained by satellite tracking in the Global Drifter Program (GDP, download from: http:www.aoml.noaa.gov/phod/dac/gdp_information.php); the gridded results of the climatic state with a horizontal resolution of 0.1°×0.1° are obtained (Dong et al., 2011; Lumpkin et al., 2013).
Figure 1 shows the study sea area, where the shading represents the average SST (1979–2011). The vector field is the average speed (1979–2011), and the black box is the study sea area where TCs pass. TCs (1949–2016) are selected in this paper for statistical analysis, which meet the following requirements: (1) located in the black box in Fig. 1; (2) intersecting with the Kuroshio main axis; (3) orienting in southeast-southwest direction. The statistical results (Table 1) show that there are 81 TCs passing over the Kuroshio from the southeast in the ECS between 1949 and 2016. In terms of the change of atmospheric pressure in the center of the TC, 31 TCs are intensified, 28 maintain their intensity, and 22 weakened.

|
| Fig.1 Composed distribution of average sea surface currents and average SST The shaded area is the distribution of sea surface temperature, the black arrow indicates the current, the blue line is the line connecting the maximum current, representing the Kuroshio main axis, and the black frame represents the study area. The data is the observation data of the SST and the current at depth of 15 m which are obtained by satellite tracking in the Global Satellite-tracked Drifter Project (GDP, http://www.aoml.noaa.gov/phod/dac/gdp_information.php; the gridded results of the climatic state with a horizontal resolution of 0.1°×0.1° are obtained (Dong et al., 2011; Lumpkin et al., 2013). Map drawing number is GS(2019) No. 1652. |

The MCP is an important physical variable that directly characterizes the change of TC intensity. The MCP is defined as S1 at the time A and S2 at A+6 h, and then the variation of the MCP (ΔMCP) is defined as the difference between S1 and S2, i.e., ΔMCP=S2– S1. Statistical analysis of the intensity changes of the TCs from 1949 to 2016 (Table 1) shows that there are 81 TCs meeting the above conditions, including 31 of ΔMCP < 0 (referred to as PTC), 28 of ΔMCP=0 (referred to as BTC), and 22 of ΔMCP>0 (referred to as NTC). According to the study of Bright et al. (2002), the first two types are collectively referred to as the positive effect process, and the latter type is referred to as the negative effect process, so that in the TCs that occur during the 68-year period (1949 to 2016), totally 72.8% is in the positive effect process and 27.2% in the negative effect process.
Another indicator describing the TC intensity is the maximum wind speed (MWS). Learned from Table 1, the TCs with increased MWS are distributed as follows: 20 in 31 PTCs, 13 in 28 BTCs and 0 in 22 NTCs. The TCs with decreased MWS are distributed as follows: 2 in 31 PTCs, 1 in 28 BTCs and 15 in 22 NTCs. Therefore, in the positive effect process, most corresponding TCs are increased in the MWS, and in the negative effect process, most corresponding TCs are decreased in the MWS.
3.2 Seasonal distribution of the Kuroshio effect on the change of TC intensityFigure 2 shows the number and monthly MCP distribution of the above 81 TCs. It can be seen from Fig. 2 that the number of PTCs peaks from August to September, the number of BTCs peaks from July to August, and the number of NTCs peaks in July. It is partially caused by that most TCs occur from July to September. From the monthly statistical distribution, there are 1 BTC and 1 NTC occured in May, because they are too weak to change their tracks after a short contact with the Kuroshio, 3 TCs in June, all of which are BTC, 23 TCs in July, of which 15 are in positive effect progress, 27 TCs in August, of which 12 are PTCs, and 28 TCs in September. Therefore, the statistics show that there is an intensification trend in the summer for the TCs passing over the Kuroshio in the ECS from the southeast. Two key factors that make the TCs intensified by the Kuroshio are discussed in the next section (3.2): TC translational speed and the distance of TC center away from the Kuroshio main axis (Fig. 2).

|
| Fig.2 Monthly distribution and average MCP change of 81 TCs The blue bars are the number for ΔMCP < 0; the red bars are the number for ΔMCP=0; the yellow bars are the number for ΔMCP < 0; the purple line is the absolute values of variations of ΔMCP for PTCs; the green line is the absolute values of variations of ΔMCP for NTCs. |
Figure 3 analyzes the relationship between the ΔMCP, the translational speed of the PTC and the distance from the PTC center to the Kuroshio main axis. Along the flow direction of the Kuroshio, the distance is positive on the right side and negative on the left side. As indicated in Fig. 3, PTCs gather in the range where the center translational speed is from 1 m/s to 8 m/s and the distance from the Kuroshio main axis is from 10 km to 75 km. It reflects that TCs with low speed and TCs closer to the Kuroshio are in the positive effect progress.

|
| Fig.3 Scatterplots of ΔMCP variations vs translational speeds of PTCs (upper panel) and ΔMCP vs distances from Kuroshio main axis of PTCs (lower panel) |
How the Kuroshio affects the intensity of TCs is analyzed further. Regarding the TC duration time in the study area (in the black rectangle in Fig. 1), the average duration time is 13.2 h for the stronger PTCs (stronger than the magnitude of a typhoon) and 25.6 h for the weaker PTCs; in terms of the average center translational speed, it is 4.7 m/s (5.9 m/s) for the stronger (weaker) PTCs; as for the distance from the Kuroshio main axis, it is 44.4 km (39.3 km) for the stronger (weaker) PTCs. The TCs with higher intensity than the average level move faster and stay shorter, which is not conducive to intensification. It could be seen that the translational speed is one of the important reasons affecting the TC intensification.
The response time of the TC passing over the Kuroshio differ in the two intensity parameters: the MCP and the MWS (Bright et al., 2002). In terms of the initial response time of the MCP (MWS), after passing over the Kuroshio, the average response time is 6.3 h (19.1 h) for stronger TCs and 14.7 h (8.6 h) for weaker TCs. It is seen that the initial response time of the MCP and the MWS is not consistent. The initial response of the MWS is later than the MCP by at least about 2 h.
4 DISCUSSIONThe Kuroshio intensifies TC development by transporting heat to the atmosphere (Shan et al., 2012). Totally 3 specific examples (Table 2) are selected for the further analysis to explore how a TC is intensified rapidly in limited contact time, how to remain its intensity or how to become weaker.
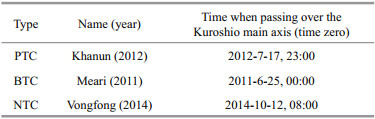
Figure 4 shows the temperature characteristics of the SST of three TCs before and after passing over the Kuroshio, which are logarithmically plotted. It could be seen that when Khanun (2012), Meari (2011) and Vongfong (2014) pass the Kuroshio, the SST of the ECS is decreased in latitude, and there is relatively obvious SW-NE-oriented warm water on the left side of the Ryukyu Islands. The SST is warm when Khanun (2012) passing over the Kuroshio, forming a wide belt of warm water; the SST is relatively colder when Meari (2011) passing over, forming a stripped belt of warm water; and the warm SST is distributed in the SW-NE direction when Vongfong (2014) passing over, only forming a block of warm water.

|
| Fig.4 Daily changes in SST of selected TCs (Khanun (2012), Meari (2011) and Vongfong (2014)) before and after passing over the Kuroshio main axis Shaded area: log10SST; black straight line: the TC track; red dots: powerful typhoon; yellow dots: the typhoon; green dots: super powerful tropical cyclones; title: number of the typhoon cases. |
Khanun (2012) occurs in July 2012, and the temperature is generally higher than the other two cases. The overall water temperature is high in the northwestern Pacific Ocean. A rapid passage of Khanun (2012) is presented through a warm sea (above 27.5℃, lower than the SST of the Kuroshio) before it contacts the Kuroshio main axis. Due to its fast translational speed and the narrow warm water strip, Khanun (2012) quickly enters the cold water area on the east side of the Ryukyu Islands, so it could not be intensified before it contacts the Kuroshio (Fig. 4). Before the TC passing, the SST of the Kuroshio is higher than the surrounding water by 1.5℃; when passing over, there is a cold water patch which is lower than the surrounding water by -0.5℃ at the intersection of the TC moving track and the cold water patch is more obvious on the right side of the TC moving track; after passing, the SST of the cold water patch decreases, and the warm water is replenished again. In Fig. 5, the average SST values in the square of 0.5°×0.5° around the cyclone center position of typical TCs within 24 h before and after TCs pass over the Kuroshio main axis are compared. For Khanun (2012), the average SST is about 25℃, the MCP is 1 002 hPa and the MWS is 18 m/s before passing over the Kuroshio main axis; the average SST is 25.6–30℃, the MCP is 1 002–985 hPa and the MWS is 20–25 m/s when passing over the Kuroshio main axis. The SST difference before and after passing is about 3℃ (increase), and ΔMCP is 17 hPa and ΔWMS is 10 m/s, so the intensity of Khanun (2012) increases when it passes the Kuroshio in terms of both ΔMCP and ΔWMS.

|
| Fig.5 Relative changes in the MCP, MWS (bar graph) and the average SST (line chart) within a square of 0.5°×0.5° around the tropical cyclone centers of selected TCs (Khanun (2012), Meari (2011), and Vongfong (2014)) within 24 h before and after passing over the Kuroshio main axis Dotted box: TC in the study area (as shown by the parallelogram box in Fig. 1); the time zero on the abscissa is the time when the TC passes over the Kuroshio main axis; title: number of the typhoon cases. |
Meari (2011) moves southwest and contacts with the Kuroshio at lower latitude. Figure 4 shows that the SST near the center is higher and reaches 28℃ or higher. However, Meari (2011) moves too fast (35 km/h) to fully contact with the warm water, so the MWS and the MCP do not increase and remain stable. In Fig. 5, for Meari (2011), the average SST is 25.5℃, the MCP is 975 hPa and the MWS is 30 m/s before passing over the Kuroshio main axis; the average SST is 27℃ to 29℃, the MCP is 975 hPa and the MWS is 30 m/s when passing over the Kuroshio main axis. The SST difference before and after passing is about 1℃ (decrease), ΔMCP is almost 0 hPa and ΔWMS is almost 0 m/s, so the intensity of Meari (2011) remains the same when it passes the Kuroshio in terms of both ΔMCP and ΔWMS.
When Vongfong (2014) enters the ECS, it is the season of the fall (October), the SST is lower than that in the summer, and the Kuroshio warm water is not obvious (Fig. 4). Compared with the first two cases, the temperature of the Kuroshio warm water is 1 to 2℃ lower. When Vongfong (2014) passes over the Kuroshio main axis (Fig. 5), the cyclone itself entrains water locally, causing a sudden drop in surface water temperature, which not only fail to effectively increase the heat transfer from the ocean to the atmosphere, but also the cold water upwelling continues to weaken the passing cyclone. This conclusion is also reflected in the seasonal distribution of TC intensity changes in Section 3.2. In Fig. 5, for Vongfong (2014), the average SST is about 27℃, the MCP is 955 hPa and the MWS is 40 m/s before passing over the Kuroshio main axis; the average SST is 29.7–28.8℃, the MCP is 960–980 hPa and the MWS is 40–23 m/s when passing over the Kuroshio main axis, and rapidly increases after passing over, and the temperature difference before and after passing is about 1℃ (decrease), ΔMCP is 30 hPa and ΔWMS is 22 m/s, so the intensity of Vongfong (2014) decreases when it passes the Kuroshio in terms of both ΔMCP and ΔWMS.
In summary, if the SST of the Kuroshio in the ECS is high and the temperature difference of the surrounding water body is large, the intensity of a TC increases more significantly when it passes the Kuroshio, but the high SST does not necessarily guarantee the increase in the intensity of a TC.
5 CONCLUSIONThis paper examines the TCs that interacts with the Kuroshio main axis oriented in the southeastnorthwest direction. First, the statistical results of the TCs from 1949 to 2016 shows that 72.8% of such tropical TCs has a positive response (PTCs and BTCs) during the 68-year period, and the TCs in the range where the center translational speed is 1–8 m/s and the distance from the Kuroshio main axis is 10–75 km are intensified more significantly. In addition, for PTCs and BTCs, the response of MCP is about 2 h earlier than that of MWS, and such cyclones are most likely to intensify in August to September each year. The analysis of the intensity changes of selected TCs when they pass over the Kuroshio indicates that the more significant the Kuroshio warm water, the more likely the TC intensity increases (the decrease of the MCP and the increase of the MWS). Since this paper only analyzes the TCs that interact with the Kuroshio main axis and orient in the southeast-northwest direction, and the dataset on best TC tracks is collected 6 h once, there are uncertainties on the analysis results. Therefore, it is necessary to apply the air-sea coupling model in the future study to explore the mechanism of the effects of the Kuroshio on the intensity change of TCs.
6 DATA AVAILABILITY STATEMENTThe datasets analyzed during the current study are available in the REMSS Analysis (Sea surface temperature data is the daily data provided by the National Oceanographic Data Center of the United States, download from: ftp://ftp.nodc.noaa.gov/pub/data.nodc), the China Meteorological Administration (CMA, http://www.typhoon.org.cn/), and the Global Drifter Program (GDP, download from: http:www.aoml.noaa.gov/phod/dac/gdp_information.php).
Bright R, Xie L, Pietrafesa L. 2002. Evidence of the Gulf Stream's influence on tropical cyclone intensity. Geophysical Research Letters, 29(16): 1 801.
|
Chang Y, Liao H, Lee M, et al. 2008. Multisatellite observation on upwelling after the passage of typhoon Hai-Tang in the southern East China Sea. Geophysical Research Letters, 35(3): L03612.
|
Chen D K, Lei X T, Wang W, Wang C H, Han G J, Zhou L. 2013. Upper ocean response and feedback mechanisms to typhoon. Advances in Earth Science, 28(10): 1 077-1 086.
(in Chinese with English abstract) |
Dong C M, Liu Y, Lumpkin R, Lankhorst M, Chen D K, Mcwilliams J C, Guan Y P. 2011. A scheme to identify loops from trajectories of oceanic surface drifters: an application in the Kuroshio extension region. Journal of Atmospheric and Oceanic Technology, 28(9): 1 167-1 176.
DOI:10.1175/JTECH-D-10-05028.1 |
Emanuel K. 2001. Contribution of tropical cyclones to meridional heat transport by the oceans. Journal of Geophysical Research: Atmospheres, 106(D14): 14 771-14 781.
DOI:10.1029/2000JD900641 |
Galarneau T J, Davis C A, Shapiro M A. 2013. Intensification of hurricane Sandy (2012) through extratropical warm core seclusion. Monthly Weather Review, 141(12): 4 296-4 321.
DOI:10.1175/MWR-D-13-00181.1 |
Lin I I, Wu C C, Emanuel K A, Lee I H, Wu C R, Pun I F. 2005. The interaction of super typhoon Maemi (2003) with a Warm Ocean Eddy. Monthly Weather Review, 133(9): 2 635-2 649.
DOI:10.1175/MWR3005.1 |
Lumpkin R, Grodsky S, Centurioni L, Rio M H, Carton J A, Lee D. 2013. Removing spurious low-frequency variability in drifter velocities. Journal of Atmospheric and Oceanic Technology, 30(2): 353-360.
DOI:10.1175/JTECH-D-12-00139.1 |
Price J F. 1981. Upper ocean response to a hurricane. Journal of Physical Oceanography, 11(2): 153-175.
|
Rogers R, Aberson S, Aksoy A, Annane B, Black M, Cione J, Dorst N, Dunion J, Gamache J, Goldenberg S, Gopalakrishnan S, Kaplan J, Klotz B, Lorsolo S, Marks F, Murillo S, Powell M, Reasor P, Sellwood K, Uhlhorn E, Vukicevic T, Zhang J, Zhang X J. 2013. NOAA's hurricane intensity forecasting experiment: a progress report. Bulletin of the American Meteorological Society, 94(6): 859-882.
DOI:10.1175/BAMS-D-12-00089.1 |
Shan H X, Guan Y P, Wang D X, Huang J P. 2012. Responses of equatorial ocean to rare typhoon Vamei. Journal of Tropical Oceanography, 31(1): 28-34.
(in Chinese with English abstract) |
Shay L K, Goni G J, Black P G. 2000. Effects of a warm oceanic feature on hurricane Opal. Monthly Weather Review, 128(5): 1 366-1 383.
DOI:10.1175/1520-0493(2000)128<1366:EOAWOF>2.0.CO;2 |
Wada A, Uehara T, Ishizaki S. 2014. Typhoon-induced sea surface cooling during the 2011 and 2012 typhoon seasons: observational evidence and numerical investigations of the sea surface cooling effect using typhoon simulations. Progress in Earth and Planetary Science, 1: 11.
DOI:10.1186/2197-4284-1-11 |
Wei Y Z, Pei Y H, Zhang R H. 2015. Seasonal variability of the Kuroshio current at the PN section in the East China Sea based on in-situ observation from 1987 to 2010. Acta Oceanologica Sinica, 34(5): 12-21.
DOI:10.1007/s13131-015-0662-3 |
Wu C R, Chang Y L, Oey L Y, Chang C W J, Hsin Y C. 2008. Air-sea interaction between tropical cyclone Nari and Kuroshio. Geophysical Research Letters, 35(12): L12605.
|
Xue G Y, Zhang J H, Chen H M, Yu H. 2007. Analysis on causes of strengthening of super strong typhoon Saomai (0608) and numerical experiments of the impact of SST on its intensity. Quaternary Sciences, 27(3): 311-321.
(in Chinese with English abstract) |
Zhou W J, Xu H M. 2015. Observational analysis and numerical simulation of influence of Kuroshio over East China Sea on intensity of tropical cyclones. Transactions of Atmospheric Sciences, 38(1): 9-18.
(in Chinese with English abstract) |