 2021, Vol. 39
Institute of Oceanology, Chinese Academy of Sciences
Article Information
- HAN Guoqing, DONG Changming, YANG Jingsong, LIU Yu
- Sri Lanka seasonal warm pools
- Journal of Oceanology and Limnology, 39(2): 437-446
- http://dx.doi.org/10.1007/s00343-020-0112-8
Article History
- Received Mar. 10, 2020
- accepted in principle Apr. 11, 2020
- accepted for publication May. 8, 2021


2 State Key Laboratory of Satellite Ocean Environment Dynamics, Second Institute of Oceanography, Ministry of Natural Resources, Hangzhou 310012, China;
3 Southern Marine Science and Engineering Guangdong Laboratory (Zhuhai), Zhuhai 519082, China;
4 Marine Science and Technology College, Zhejiang Ocean University, Zhoushan 316000, China
The existence of islands significantly affects the local hydrological environment, especially physical processes in the lee of islands (e.g., Tomczak, 1988; Dietrich et al., 1996; Aiken et al., 2002; Dong and McWilliams, 2007; Dong et al., 2007; Andrade et al., 2014; Hsu et al., 2017; Dong et al., 2018). These processes can be classified into two types: (ⅰ) variation in currents behind of an island after they pass an island (hereafter referred to as oceanic current wakes); and (ⅱ) oceanic response to wind wakes (wind wakes are the variation in winds behind an island after they pass an island). The island wake is a combination of these two types, which take place in realistic physical processes in the lee of islands. Through these mechanisms, wind-current interactions and oceanic current wakes can modulate physical parameters such as sea surface temperature (SST) on the lee side of an island.
Abnormal warm SST resulting from the presence of an island has been found in different ocean areas (e.g., Barton et al., 2000, 2001; Xie et al., 2001; Caldeira and Marchesiello, 2002; Caldeira et al., 2005; Li et al., 2012; Han et al., 2019). For example, Barton et al. (2000) found that mountains on the Canary Islands present obstacles to the Trade Winds and to the Canary Current. Using Synthetic Aperture Radar (SAR) and Advanced Very High Resolution Radiometer (AVHRR) images, it was found that the leeward of the Canary Islands of weaker wind coincides with a warm 'wake' (Barton et al., 2001). Xie et al. (2001) explored the wake of the Hawaiian island caused by the northeasterly trade wind and find that when the broad steady northeasterly trades impinge on Hawaii, a number of wind wakes are formed behind the individual islands, and these individual wakes dissipate rather quickly. Caldeira and Marchesiello (2002) found a warm water zone on the leeward side of the Madeira Island. This warm water zone is due to the action of the wind that generated a Karman vortex, making the area cloudless and thus allows more net shot wave flux to enter the warm water region. Caldeira et al. (2005) analyzed the warm water on the eastern side of Santa Catalina Island. The mechanism of the warm water formation in that region is consistent with the generation mechanism of the Madeira Island warm water. Li et al. (2012) explored the seasonal warm pool appeared on the southwest of Hainan Island. This seasonal warm pool results from the small low-level wind speed, which weakens the evaporation cooling at that level so that the SST is higher than in the surrounding ocean areas. Han et al. (2019) explored the warm SST anomalies inside the Mozambique Channel and suggest that the mechanism of warm water formation is the combined effects of wind and sea surface net heat flux. Overall, warm pools in the lee of the island are common. These are caused by the interactions between the wind and sea surface net heat flux.
Located in the southwestern part of the Bay of Bengal, Sri Lanka is on the southeastern side of the Indian peninsula (Fig. 1a) with the Palk Strait and Gulf of Mannar nestled between them (Fig. 1b). Here, the island and the region are under significant influence of the Indian monsoon. It is wide in the south and narrow in the north, Mount Pidurutalagala sits between these two extremes in the south-central part of the island, with its peak reaching 2 500 m. The presence of Sri Lanka Island affects the local oceanic hydrological variability, forced by the strong Indian Ocean monsoon. Previous studies have focused on the cold pool west of Sri Lanka (e.g., Luis and Kawamura, 2000, 2001, 2002; Rao et al., 2008), caused by the strong wind-induced evaporation cooling and upwelling. However, little research is geared toward investigating the ocean's response to the change in wind direction and intensities during the summer and winter monsoons in the lee of Sri Lanka. Sri Lanka seasonal warm pools (SSWPs) are observed on the leeward sides of the island. During the summer monsoon onset, a warm pool on the east side of Sri Lanka is generated, with the highest temperature reaching 30 ℃. On the other hand, when the winter monsoon starts, there is also a warm pool appeared in the west of Sri Lanka. Because the two warm pools are along the coast, the higher SST in the warm pools could cause increasing air temperature over Sri Lanka, and change the systems of precipitation and atmospheric circulation over the land as well. The change of weather system could affect the local economy and society, including animal lives, tourism, and agriculture. The present study examines the spatiotemporal variability of the seasonal monsooninduced SSWPs and investigates their potential formation mechanisms.

|
| Fig.1 Study area (red box, 75°E–85°E, 3°N–13°N) (a); topography (unit: m) of the study area from ETOPO1 data (b); 37-year (1982–2018) 3-month (June to August) mean SST (unit: ℃; black box: summer monsoon-induced warm pool area from AVHRR SST data) (c) and 37-year (1982–2018) 3-month (December to February) mean SST (unit: ℃; black box: winter monsoon-induced warm pool area from AVHRR SST data) (d) |
The remainder of this paper is organized as follows: Section 2 introduces the data used. In Section 3, the spatiotemporal characteristics of the SSWPs and the influences of the wind intensity and oceanic currents on the SSWPs are described. Section 4 is the discussion, in which the influence of SSWPs on the precipitation is analyzed. A numerical model is also used to analyze the temperature budget. Section 5 is the summary.
2 DATA AND MODEL CONFIGURATION 2.1 Remote sensing data: AVHRR SSTWe compare Advanced Very High Resolution Radiometer (AVHRR) SST data with J-OFURO3 SST and NCEP-CFSR SST data. The remote sensing datasets (AVHRR, J-OFURO3) show similar SST distribution in the study area, which is slightly colder than re-analysis (NCEP-CFSR) data (especially during winter monsoon onset). The overall SST distributions of these 3 datasets are similar. Therefore, we selected AVHRR SST data for this study. The AVHRR SST data with 0.25°×0.25° spatial resolution and daily sampling were used in this study (Reynolds et al., 2007) (https://www.ncei.noaa.gov/thredds/catalog/OisstBase/NetCDF/AVHRR). AVHRR is a sensor carried on the NOAA (National Oceanic and Atmospheric Administration) series of meteorological satellites. Since the launch of the TIROS-N satellite in 1979, the AVHRR sensor has continued to perform ground observation missions. The period of SST data used in this study is from 1982 to 2018.
2.2 Reanalysis data: NCEP-CFSRThe Climate Forecast System Reanalysis (CFSR) data by the National Centers for Environmental Prediction (NCEP) are applied to the present study (Saha et al., 2010, 2014) (https://rda.ucar.edu/datasets/). The wind field data near the ground were used to check the influence of the wind speed on SSWPs. The precipitation data were also used in this study.
2.3 Model configurationThe Regional Ocean Modeling System (ROMS) was used in this study. The ROMS has been widely used in regional ocean simulation, air-sea interaction, and ocean dynamics analysis (Dong and McWilliams, 2007; Dong et al., 2007; Li et al., 2018; Dong et al., 2018). The detailed settings of the model can be found in Li et al. (2016). Daily-average results of the model output in the year of 2014 were used for heat budget analysis over the study area (3°N–13°N, 75°E–85°E).
3 RESULT 3.1 Spatial distributionTo examine the spatial distribution of the SST around the Sri Lanka island, the 37-year AVHRR data from 1982–2018 are used. The area averaged SST is not sensitive to the size of the area we selected. Therefore, we selected a 10°×10° square as our study area (the red box in Fig. 1a). Figure 1c plots the spatial distribution of climatic 3-month (June to August) mean SST. It shows that during the summer monsoon onset, there is a significant difference in the SST between the eastern and western sides of the island, with the SST on the east being significantly higher than that on the west. There is a warm pool on the east side of Sri Lanka, with the highest temperature reaching 30 ℃. The SST on the west side of the island is lower than 28 ℃. The lowest SST around the island appears in the south of Sri Lanka, and the lowest temperature is 27.5 ℃. The lowest SST may be affected by the southwest monsoon-induced upwelling. We used the isotherm of 29.6 ℃ as a reference to select the summer monsoon-induced warm pool (SMWP) area (roughly shown in the black box in Fig. 1c). On the other hand, when the winter monsoon starts (December to February), the SST in the west side of Sri Lanka island is higher than that in the east side (Fig. 1d), which is opposite to the SST distribution pattern during the summer monsoon. There is also a warm water area in the west of Sri Lanka, but the area of the winter monsoon-induced warm pool (WMWP) is smaller than the SMWP. In addition, the temperature of the WMWP is lower than the SMWP. We used the 28 ℃ isotherm as a reference to determine the WMWP area (roughly shown in the black box in Fig. 1d).
3.2 Temporal variationsIn order to characterize the intensity of warm pools, we defined the warm pool intensity as the monthly mean SST inside the warm pool (black lines in Fig. 1c or d) minus the monthly average SST of the study area (red box in Fig. 1a). The area-averaged SSTs inside the SMWP, WMWP, and the study area display the same seasonal cycle signal (not shown in the paper). The correlation coefficient of the SST series between the SMWP and the study area is 80%. The correlation coefficient of the SST series between the WMWP and the study area is 84%. Therefore, the removal of the impact of the seasonal signal by subtracting the mean SST in the study area from that in the warm pools is demonstrably right.
Figure 2a shows the monthly warm pool intensity of the SMWP from the AVHRR data from 1982 to 2018. Results show that the strongest intensity, which usually occurs in summer monsoon onset, can reach 1.8 ℃ inside the SMWP (Fig. 2a). During the winter monsoon, the warm pool intensity of the SMWP area becomes negative. The SMWP shows a weakening trend, which might result from the increasing SST in the study area (black lines in Fig. 2a). Figure 2b shows the climatic monthly mean SST (solid red line) of the study area and the SMWP intensity (dashed blue line). Two peaks (April and October) are evident in the monthly mean SST which results from the direct influence of sunlight twice a year. Moreover, the intensity of the SMWP has no significant relationship with the local mean SST. It is not expected that there is a significant correlation between the SMWP intensity and the absolute SST in the study area because the SMWP intensity removed the seasonal cycle already. The strongest SMWP intensity appears in July. At that time, the water temperature in the warm pool is 0.8 ℃ higher than the climatic local mean SST of the study area. In December, the negative SMWP intensity is the weakest and the SST in the warm pool is about 0.35 ℃ lower than the regional average SST. From Fig. 2a&b, the SMWP is stronger in the summer monsoon. The mean of the SMWP intensity in summer monsoon from 1982–2018 (Fig. 2c) shows that the intensity of the SMWP has obvious interannual variation. It is found that there is a significant relationship between El Niño and the SMWP intensity. The black line is the Niño 3.4 index that is defined as the average SST anomaly in the region bounded by 5°N to 5°S and 170°W to 120°W. It is calculated using AVHRR SST data. During strong Niño years (e.g., 1987, 1997, 2015), the intensities of the SMWP is much weaker than that in normal years.

|
| Fig.2 The monthly mean SMWP intensity from 1982–2018 (in color), the annual mean SST for the study area (dotted black line); and 37-year (1982–2018) 3-month (June to August) mean SST for the study area (solid black line) (a); monthly mean SMWP intensity (dotted blue line) and mean SST for the study area (solid red line) (b); the annual SST anomaly of SMWP during summer monsoon from 1982–2018 (unit: ℃, AVHRR data; black line: Niño 3.4 index) (c) |
The WMWP intensity (Fig. 3a) shows a maximum intensity value of 0.8 ℃, but it is weaker than the warm pool observed during the summer monsoon. Generally, in summer monsoon, the WMWP area displays a cold anomaly. The 3-month (December to February) mean SST in the study area also displays an increasing trend which results in the weakening of the WMWP. Figure 3b shows that the strongest warm pool intensity appears in February. At that time, the water temperature in the WMWP is about 0.25 ℃ higher than the climatic local mean SST of the study area. In July, the WMWP intensity is strongest and the SST is about 0.9 ℃ lower than the regional mean SST. The annual mean WMWP intensity from 1982– 2018 (Fig. 3c) showed obvious interannual variations. It was found that there is also a significant relationship between the WMWP intensity and El Niño events. During the years with strong El-Niño events (e.g., 1993, 2008, 2015), the intensities of the WMWP are smaller. In the winter monsoon-induced warm pool area, the maximum SST anomaly is observed in 1988, with SST in the warm pool reaching about 0.5 ℃ higher than the regional mean SST.

|
| Fig.3 The monthly mean WMWP intensity from 1982–2018 (in color), and 37-year (1982–2018) and 3-month (December to February) mean SST for the study area (black line) (a); monthly mean WMWP intensity (dotted blue line) and mean SST for the study area (red line) (b); annual SST anomaly of WMWP during winter monsoon from 1982–2018 (unit: ℃; AVHRR data; black line: Niño 3.4 index) (c) |
The intensity of the SMWP is significantly stronger than the WMWP. In addition, the WMWP is not observed during some years (1994, 1999, 2003, 2006, 2014, and 2015), while the SMWP appears every year.
El Niño events are associated with a shift of the Walker circulation above the eastern Pacific. The eastward shift can result in strengthened low-level convergence above the tropical Indian Ocean and in driving an anomalous Hadley circulation with a descent over the Indian subcontinent (Goswami, 1998). The strength of the Indian monsoon depends on the strength of the regional Hadley circulation (Goswami, 1998; Krishnamurthy and Goswami, 2000). During El Niño events, the monsoon wind weakens, thus the SST over the study area increases (black lines in Figs. 2a&3a).
Indian Ocean dipole (IOD) events can also influence the intensity of the SSWPs. IOD generally starts to develop in boreal summer, peaks in fall, and terminates in winter, subject to the strong summer monsoon. Therefore, IOD plays a more important role in the SMWP than WMWP. Both ENSO and IOD events affect the intensities of the SSWPs through influencing the wind field over the Sri Lanka Island.
Due to orographic influences, monsoon intensity on the leeward side of Sri Lanka weakens. The differences in wind intensities between SSWPs and the study area decrease, thus the intensities of SSWPs are smaller. Further analysis of the relationship between SST and wind intensity is discussed in Section 3.3.
3.3 Effects of sea surface windWind blowing over the sea surface transfers momentum from the atmosphere to the ocean through surface wind stress, forming the main driving force of upper ocean dynamics. The surface wind stress produces turbulence through direct mixing and shear effects, which modulates the vertical mixing process in the mixed layer. It is the most direct factor that leads to the deepening of the mixed layer, and also determines the dynamic structure of this layer. When the wind blows over an island, the wind stress intensity is significantly reduced because the roughness of the island is much greater than that of the sea surface. The mountains on the island also hinder the wind movement.
During summer monsoon (June to August), the southwest wind prevails over the study area (Fig. 4a). The strongest wind (about 12 m/s) appears in the southeast of Sri Lanka. On the northwest side of the island, there is another region of high wind speed (about 10 m/s). When the southwest monsoon wind blows over Sri Lanka island, there is a weak wind area (4 m/s) downwind, that is, on the east side of the island. The location of the weak wind area is consistent with that of the SMWP area during the summer monsoon onset.

|
| Fig.4 Topography (gray, unit: m, ETOPO1 data) and wind field (vectors, unit: m/s, NCEP-CFSR data) in summer monsoon onset (a) and winter monsoon onset (b); wind-stress curl in summer monsoon (unit: N/m3) (c); wind stress curl in winter monsoon (unit: N/m3) (d); SST (color, unit: ℃) and sea surface current (vectors, unit: m/s) in the summer monsoon of 2015 (e) and SST (color, unit: ℃) and sea surface current (vectors, unit: m/s) in the winter monsoon of 2015 (f) |
During winter monsoon (December to February), a northeastern wind dominates over the study area (Fig. 4b). The strongest wind speed appears on the northwest side of Sri Lanka. When the northeast monsoon passes through the Palk Strait, it is enhanced and reaches 7 m/s. On the northeast side of Sri Lanka, the wind speed is above 5 m/s. When the northeast monsoon blows over Sri Lanka island, there is a significant small wind area downwind (less than 3 m/s), that is, on the southwest side of the island. The location of this small wind area is consistent with that of the WMWP (black box in Fig. 1d) when the east monsoon starts.
According to Fig. 4a&b, we calculate the windstress curl corresponding to the peak periods of SSWPs. The results show that in summer there is a negative (northwest) and a positive (southeast) vorticity region on the side of the SMWP (Fig. 4c&d). During the winter wind outbreak, a pair of symmetrical wind stress curls appeared on both sides of the small wind area, corresponding to the WMWP location in winter. The Ekman pumping velocity depends on the local wind-stress curl. However, the surface wind-stress curl field does not show any strong signal in SSWPs regions, suggesting that the upwelling induced by the Ekman pumping does not play an important role in the SSWPs area.
3.4 Effects of oceanic currentsTemperature advection plays an important role in temperature variation. Figure 4e & f shows surface currents and SST in summer monsoon and winter monsoon of 2015 (a strong Niño year), as an example. During summer (Fig. 4e), the East India Coastal Current (EICC) carries warm water into the SMWP area, which plays a heating role. In winter (Fig. 4f), the Winter Monsoon Current (WMC) also plays an important role in bringing warm waters into the WMWP area. The background currents enhance the intensities of SSWPs.
4 DISCUSSION 4.1 Impacts of SSWPs on precipitationWhen moist air masses meet with a terrain blocking, the moist air could be forced to uplift slowly. Cloud is thus formed by adiabatic cooling and condensation and can lead to precipitation. This depends on the Froude number (Fr=U/NH), where Fr is the Froude number, U is the characteristic velocity, N is the Brunt-Väisälä frequency, and H is the characteristic depth. When the monsoon passes over Sri Lanka, the Froude number near Sri Lanka (U~10, N~10-2, H~500) is about 2, which is larger than 1, thus the air can be forced to uplift. There is a significant amount of precipitation on the windward slope of the island but the precipitation on the leeward side is significantly reduced. Figure 5a&b is the precipitation distribution in the windward and leeward of Sri Lanka during the summer and winter monsoon onset, respectively. Figure 5a shows that the windward precipitation during the summer monsoon period is much higher than that in winter monsoon. Although there is less precipitation in the leeward area, there is a slightly higher precipitation rate in the SSWPs area (Fig. 5b). This may be due to the higher SST, smaller wind speed, and more evaporation of seawater in the warm pool area, which makes the local precipitation slightly higher. The precipitation during the summer monsoon period is much higher than that in winter monsoon. The leeward precipitation in winter monsoon is higher than that in the summer monsoon.

|
| Fig.5 Climatological mean (1982–2018) precipitation rate in windward sides (unit: kg/(m2·s)) (a); climatological mean (1982–2018) precipitation rate in leeward sides (unit: kg/(m2·s)) (b); differences of temperature budget terms between SSWPs and the study area in the upper ocean (c) In a, b: the left part: in summer monsoon onset; the right part: in winter monsoon onset. The black line is a selected boundary between the windward and leeward of Sri Lanka (NCEP-CFSR data); in c: the SMWP was calculated in June 2014 and WMWP in February 2014 (unit: ℃/s). |
To further understand the different physical processes affecting SST in the SSWPs and study area, we examine the heat budget in the upper ocean. The difference between the heat budget of the warm pool and study area (see details in Appendix) is:
 (1)
(1)where dQt is the difference of temperature variation rate terms between the SSWPs and the study area. dQxadv, dQyadv, and dQzadv are the zonal, meridional, and vertical different advection terms. dQxdiff, dQydiff, and dQzdiff are the zonal, meridional, and vertical different diffusion terms. dQsurf is the difference of surface flux terms between the SSWPs and the study area. dQres is the residual term.
To calculate the heat budget, a numerical model (for more details about this model, please refer to Li et al., 2016) is applied in this study. The depth of 20 m is chosen as the bottom of the ocean upper layer. The horizontal boundaries are selected using the edge of SSWPs shown in Fig. 1c&d.
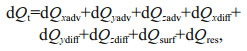
Figure 5c shows the contributions of total advection term (dQtadv=dQxadv+dQyadv+dQzadv), total horizontal diffusion term (dQhdiff=dQxdiff+dQydiff), vertical diffusion term (dQzdiff) and surface heat flux term (dQsurf) inside SSWPs and the study area in January and June. The temperature change rates in the WMWP (January) and SMWP (June) are both higher than that of the study area. In June, the positive SMWP intensity is dominated by the vertical diffusion, which results from the large different wind intensities between the SMWP and the surrounding sea area. In January, the intensity of the WMWP is controlled by the total advection term, which might be caused by the warm water carried by the WMC. In January and June, total advection terms and vertical diffusion terms play positive roles in the positive intensity while the horizontal diffusion terms play negative roles in the warm pool intensity. Surface heat flux terms play negative roles in June and positive roles in January, which might be caused by the decreasing of outgoing longwave radiation related to the larger precipitation in the WMWP. The residual term (dQres) is very small compared with other terms; it can be neglected in our study.
5 CONCLUSIONThe presence of Sri Lanka exerts significant influences on the hydrology of the adjacent area of Sri Lanka. The summer and winter monsoons blow through Sri Lanka with different wind directions and intensities. The oceanic response to the monsoons is the primary factor for the formation of the SSWPs. In summer monsoon, the SMWP appears east of Sri Lanka, whose highest SST can reach 1.8 ℃ warmer than the average SST in the study area. In winter monsoon, the WMWP appears west of Sri Lanka, which is 0.8 ℃ warmer than the surrounding area. The intensity of the SSWPs is related to the Niño 3.4 index. The intensity in the SSWPs during El Niño events is much smaller than that during La Niña events. The ENSO influences the wind field through Walker and Hadley circulations. During El Niño events, the monsoon weakens. The differences in wind intensities between SSWPs and the study area become smaller, thus the intensities of SSWPs are smaller. The background currents also play an important role in SSWPs. The precipitation in the windward area is greater than that in the leeward area because of orographic effects. In addition, the warmer water inside the SSWPs enhances local precipitation.
6 DATA AVAILABILITY STATEMENTThe datasets generated and/or analyzed for the current study are available from the corresponding author.
AppendixThe equation of temperature budget is:
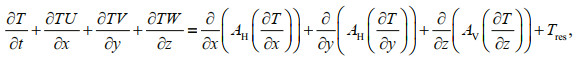 (A1)
(A1)where T is the temperature, U, V, and W are zonal, meridional, and vertical components of velocity, respectively. AH and AV are horizontal and vertical heat diffusivity parameter. Tres is the residual term.
For simplicity, we abbreviate Eq.A1 as follows:
 (A2)
(A2)Each of these terms is represented by
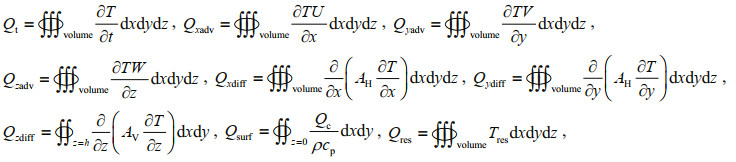
where Qc is concentration flux; ρ is the density of sea water (ρ=1 025 kg/m3); cp is the specific heat capacity of sea water at constant pressure (cp=3 890 J/(kg∙℃)).
To characterize the different terms of the temperature budget between warm pools and the study area, all terms are calculated in unit volume/area
 (A3)
(A3)where 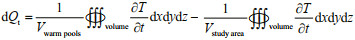
Aiken C M, Moore A M, Middleton J H. 2002. The nonnormality of coastal ocean flows around obstacles, and their response to stochastic forcing. Journal of Physical Oceanography, 32(10): 2955-2974.
DOI:10.1175/1520-0485(2002)032<2955:TNOCOF>2.0.CO;2 |
Andrade I, Sangrà P, Hormazabal S, Correa-Ramirez M. 2014. Island mass effect in the Juan Fernández Archipelago(33°S), Southeastern Pacific. Deep Sea Research Part Ⅰ: Oceanographic Research Papers, 84: 86-99.
DOI:10.1016/j.dsr.2013.10.009 |
Barton E D, Basterretxea G, Flament P, Mitchelson-Jacob E G, Jones B, Arístegui J, Herrera F. 2000. Lee region of Gran Canaria. Journal of Geophysical Research: Oceans, 105(C7): 17173-17193.
DOI:10.1029/2000jc900010 |
Barton E D, Flament P, Dodds H, Mitchelson-Jacob E G. 2001. Mesoscale structures viewed by SAR and AVHRR near the Canary islands. Scientia Marina, 65(S1): 167-175.
DOI:10.3989/scimar.2001.65s1167 |
Caldeira R M A, Marchesiello P, Nezlin N P, DiGiacomo P M, McWilliams J C. 2005. Island wakes in the Southern California Bight. Journal of Geophysical Research-Oceans, 110(C11): C11012.
DOI:10.1029/2004JC002675 |
Caldeira R M A, Marchesiello P. 2002. Ocean response to wind sheltering in the Southern California Bight. Geophysical Research Letters, 29(13): 13-1-13-4.
DOI:10.1029/2001GL014563 |
Dietrich D E, Bowman M J, Lin C A, Mestas-Nunez A. 1996. Numerical studies of small island wakes in the ocean. Geophysical and Astrophysical Fluid Dynamics, 83(3-4): 195-231.
DOI:10.1080/03091929608208966 |
Dong C M, Cao Y H, McWilliams J C. 2018. Island wakes in shallow water. Atmosphere-Ocean, 56(2): 96-103.
DOI:10.1080/07055900.2018.1448750 |
Dong C M, McWilliams J C, Shchepetkin A F. 2007. Island wakes in deep water. Journal of Physical Oceanography, 37(4): 962-981.
DOI:10.1175/JPO3047.1 |
Dong C M, McWilliams J C. 2007. A numerical study of island wakes in the Southern California Bight. Continental Shelf Research, 27(9): 1233-1248.
DOI:10.1016/j.csr.2007.01.016 |
Goswami B N. 1998. Interannual variations of Indian summer monsoon in a GCM: external conditions versus internal feedbacks. Journal of Climate, 11(4): 501-522.
DOI:10.1175/1520-0442(1998)011<0501:ivoism>2.0.co;2 |
Han G Q, Dong C M, Li J D, Yang J S, Wang Q Y, Liu Y, Sommeria J. 2019. SST anomalies in the Mozambique Channel using remote sensing and numerical modeling data. Remote Sensing, 11(9): 1112.
DOI:10.3390/rs11091112 |
Hsu P C, Chang M H, Lin C C, Huang S J, Ho C R. 2017. Investigation of the island-induced ocean vortex train of the Kuroshio Current using satellite imagery. Remote Sensing of Environment, 193: 54-64.
DOI:10.1016/j.rse.2017.02.025 |
Krishnamurthy V, Goswami B N. 2000. Indian monsoon-ENSO relationship on interdecadal timescale. Journal of Climate, 13(3): 579-595.
DOI:10.1175/1520-0442(2000)0132.0.CO;2 |
Li J D, Liang C J, Tang Y M, Dong C M, Chen D K, Liu X H, Jin W F. 2016. A new dipole index of the salinity anomalies of the tropical Indian Ocean. Scientific Reports, 6: 24260.
DOI:10.1038/srep24260 |
Li J D, Liang C J, Tang Y M, Liu X H, Lian T, Shen Z Q, Li X J. 2018. Impacts of the IOD-associated temperature and salinity anomalies on the intermittent equatorial undercurrent anomalies. Climate Dynamics, 51(4): 1391-1409.
DOI:10.1007/s00382-017-3961-x |
Li J X, Wang G H, Xie S P, Zhang R, Sun Z Y. 2012. A winter warm pool southwest of Hainan Island due to the orographic wind wake. Journal of Geophysical Research-Oceans, 117(C8): C08036.
DOI:10.1029/2012JC008189 |
Luis A J, Kawamura H. 2000. Wintertime wind forcing and sea surface cooling near the south India tip observed using NSCAT and AVHRR. Remote Sensing of Environment, 73(1): 55-64.
DOI:10.1016/s0034-4257(00)00081-x |
Luis A J, Kawamura H. 2001. Characteristics of atmospheric forcing and SST cooling events in the Gulf of Mannar during winter monsoon. Remote Sensing of Environment, 77(2): 139-148.
DOI:10.1016/s0034-4257(01)00201-2 |
Luis A J, Kawamura H. 2002. Dynamics and mechanism for sea surface cooling near the Indian tip during winter monsoon. Journal of Geophysical Research, 107(C11): 8-1-8-13.
DOI:10.1029/2000jc000455 |
Rao R R, Girish Kumar M S, Ravichandran M, Gopalakrishna V V, Thadathil P. 2008. A cold pool south of Indo-Sri Lanka channel and its intrusion into the Southeastern Arabian Sea during winter. Deep Sea Research Part Ⅰ: Oceanographic Research Papers, 55(8): 1009-1020.
DOI:10.1016/j.dsr.2008.04.006 |
Reynolds R W, Smith T M, Liu C Y, Chelton D B, Casey K S, Schlax M G. 2007. Daily high-resolution-blended analyses for sea surface temperature. Journal of Climate, 20(22): 5473-5496.
DOI:10.1175/2007jcli1824.1 |
Saha S, Moorthi S, Pan H L, Wu X R, Wang J D, Nadiga S, Tripp P, Kistler R, Woollen J, Behringer D, Liu H X, Stokes D, Grumbine R, Gayno G, Wang J, Hou Y T, Chuang H Y, Juang H M H, Sela J, Iredell M, Treadon R, Kleist D, Van Delst P, Keyser D, Derber J, Ek M, Meng J, Wei H L, Yang R Q, Lord S, van den Dool H, Kumar A, Wang W Q, Long C, Chelliah M, Xue Y, Huang B Y, Schemm J K, Ebisuzaki W, Lin R, Xie P P, Chen M Y, Zhou S T, Higgins W, Zou C Z, Liu Q H, Chen Y, Han Y, Cucurull L, Reynolds R W, Rutledge G, Goldberg M. 2010. The NCEP climate forecast system reanalysis. Bulletin of the American Meteorological Society, 91(8): 1015-1057.
DOI:10.1175/2010BAMS3001.1 |
Saha S, Moorthi S, Wu X R, Wang J D, Nadiga S, Tripp P, Behringer D, Hou Y T, Chuang H Y, Iredell M, Ek M, Meng J, Yang R Q, Mendez M P, van den Dool H, Zhang Q, Wang W Q, Chen M Y, Becker E. 2014. The NCEP Climate Forecast System Version 2. Journal of Climate, 27(6): 2185-2208.
DOI:10.1175/JCLI-D-12-00823.1 |
Tomczak M. 1988. Island wakes in deep and shallow water. Journal of Geophysical Research, 93(C5): 5153.
DOI:10.1029/JC093iC05p05153 |
Xie S P, Liu W T, Liu Q Y, Nonaka M. 2001. Far-reaching effects of the Hawaiian Islands on the Pacific oceanatmosphere system. Science, 292(5524): 2057-2060.
DOI:10.1126/science.1059781 |