 2021, Vol. 39
Institute of Oceanology, Chinese Academy of Sciences
Article Information
- LI Shuai, ZHANG Guangtao
- Role of intraspecific competition in intrinsic growth rate regulation in an Oikopleura dioica (Tunicata) population
- Journal of Oceanology and Limnology, 39(2): 609-622
- http://dx.doi.org/10.1007/s00343-020-0071-0
Article History
- Received Jan. 31, 2020
- accepted in principle Mar. 13, 2020
- accepted for publication Apr. 14, 2020


2 University of Chinese Academy of Sciences, Beijing 100049, China;
3 Laboratory for Marine Ecology and Environmental Science, Qingdao National Laboratory for Marine Science and Technology, Qingdao 266071, China
Compared to that of classic crustacean herbivores, the grazing of a pan-global appendicularian Oikopleura dioica population can make a greater contribution to the consumption of fleeting phytoplankton blooms (Amelina et al., 2017), as they are capable of removing a wide size range of particles with mucous filters (Flood and Deibel, 1998; Gorsky et al., 1999; Fernández et al., 2004). Additionally, these semelparous organisms proliferate with extremely high intrinsic rates of natural increase (r) that are similar to those determined for some algal species that reproduce by binary fission (Troedsson et al., 2002). In view of their capacity for rapid blooms, extremely high abundance of O. dioica has been reported in brackish estuaries and harbors, i.e. in Fukuyama Harbor of Japan (Uye and Ichino, 1995) and Kingston Harbour of Jamaica (Hopcroft et al., 1998). Since daily discarded house material calculated for the population corresponded to 490%–1 100% of its biomass (Sato et al., 2001), large number of macroscopic aggregates produced by this organism must contribute significantly to key oceanic processes. The persistence of high r values during bloom periods will lead to a J-shaped population size increase and abrupt decline at/after the theoretical maximum. In terms of carbon fluxes at depth, there will be a sudden deposition of dense carcasses at the end of population growth in addition to the continuous discarding of filtration houses and fecal pellets (Gorsky and Fenaux, 1998; Purcell et al., 2004; Alldredge, 2005; Robison et al., 2005). Intrinsic growth rate regulation is the key process for avoiding such sudden collapses, which changes the population growth model to an S-shaped curve. As dense patches were not common in the existing field reports (Deibel and Lowen, 2012), the population growth of O. dioica may be strongly regulated by inter- and/or intraspecific interactions. Both laboratory and mesocosm experiments have shown the potential of predation regulation (Sommer et al., 2003; López-Urrutia et al., 2004; Stibor et al., 2004), but there are no reports available on the possibility of intraspecific competition, which is the basic consideration for changing population growth from exponential to the much more common logistic model.
Competition for food is common in animal populations. For appendicularians, their limited lipidstorage ability and high metabolic activity suggest a strong dependence on food standing stocks (Gorsky et al., 1987; Deibel et al., 1992). In microcosms, a negative correlation was observed between Oikopleura growth rates and biomass (Hopcroft et al., 1998), though extremely high abundance was thought to be the more likely reason than competition. The maintenance food concentration, where assimilation balances respiration, is generally very low, and as a result, large O. dioica under natural conditions are less likely to experience food-limited growth than other mesozooplankton, but the growth of young juveniles could be more limited by food concentrations (López-Urrutia et al., 2003b). In a laboratory study, O. dioica attained a small body size at a high density (200 individuals in 1 L) (Gorsky and Palazzoli, 1989; reshown in Lombard et al., 2009b). Compared to the results in laboratory incubations with a sufficient food supply, natural populations generally achieved smaller body sizes in bloom seasons (Uye and Ichino, 1995; Li et al., 2020).
We thus propose density-dependent growth performance for O. dioica. In addition to natural mortality, population size can be equally regulated by fecundity, which is correlated with body size (Lombard et al., 2009a). According to previous reports, the high rmax of O. dioica was attributed to a short generation time and high fecundity (Troedsson et al., 2002). As the generation time at a given temperature is essentially constant, fecundity is more likely the reason. O. dioica is known to be capable of regulating numerical oocyte production over 2 orders of magnitude (Aksnes and Giske, 1990), establishing this species among the most adept clutch-size manipulators. The experiments and model of Lombard et al.(2009a, b) suggested that both extremely low and high food concentrations might have negative impacts on growth rates. However, the set-up of the previous experiment did not allow taking into account of the density effect, which may regulate the population dynamics through altered competitive and trophic interactions, potentially having significant ecosystem implications. In particular, O. dioica performed well in warmer conditions and benefited from low pH levels with the background of global climate change (Troedsson et al., 2013; Winder et al., 2017).
In this work, we have used a 3×4 cross-over design to assess effects of intraspecific competition on population growth in a wide food concentration range, 27–219 μg C/L. We aimed to (a) investigate how different densities of conspecifics modulate the growth and reproductive physiological responses of the competition pressure and (b) quantify the environmental carrying capacity through the relationship between r and available food along the density gradient. For quantitative measurements of the carrying capacity in terms of comparative food sufficiency, the critical values for full development were determined in the per capita food supply (PFS) instead of the absolute food concentration based on growth performance under various competition conditions.
2 MATERIAL AND METHOD 2.1 Cohort establishment and generation synchronizationIndividuals of Oikopleura dioica (Tunicata, Appendicularia) were collected in the Jiaozhou Bay, Qingdao, China (35°03′N, 120°20′E) on June 20, 2017, using a plankton net with a large-volume codend (10 L). The samples were diluted into 50-L buckets and transported immediately to the laboratory, where healthy individuals were sorted and cultured in a small room (approximately 10 m2) maintained at 18±1℃ using a standard air conditioner. The sorted animals were reared in 10-L glass beakers in seawater (filtered through 2-μm cellulose acetate membranes), stirred with a plastic paddle (25 cm deep and 6 cm wide) rotating at 10 r/min, and fed a mixed diet of the flagellate Isochrysis galbana, the diatom Chaetoceros gracilis, and the cyanobacterium Synechococcus sp. at a proportion of 5꞉3꞉2 and a carbon concentration of approximately 100 μg/L.
The protocol from Martí-Solans et al. (2015) was followed to initiate a synchronized new generation. In brief, we transferred 30 mature females and 15 mature males into a mating beaker with 1.5 L of filtered seawater (FSW) using a wide-bore pipette. After the release of gametes, thousands of offspring were incubated for 18–24 h to expand their first house. Subsequently, the beaker was diluted one-fold (1/2 dilution) with fresh FSW chronologically on Day 1 (D1) and Day 2 (D2), and on Day 3 (D3), 200 animals were transferred to a new beaker with 4 L of fresh FSW. Then, the beaker was diluted 0.6-fold (2/3 dilution) on Day 4. On the morning of Day 5, most animals synchronously matured and were ready for the experiment. After each dilution, the previously used diets were added in proportion to the total incubation volume.
2.2 Experimental design and manipulationReplicate design is necessary and efficient in dealing with random error. However, for this most rapid proliferation metazoan, real replicates are impossible regarding high juvenile mortality and short manipulation time window. Thus, we transferred to crossover design similar to that commonly used in medical experiments, instead of testing separately the effects of density and food concentration with replicates. Therefore, we did not assume each combination as an independent replicate, but a joint point in orthogonal design.
The experiment was conducted in a thermostatic laboratory from September to October 2017. A crossover design without replication was used with 3 levels of population densities and 4 levels of food additions in this study. To form an independent cohort, three couples of fully mature females and males were selected randomly from the synchronized generation; 18 distinct cohorts were established in hatching dishes (6 cm in diameter) with 50 mL of FSW. To synchronize all cohorts, parental animals were forced to release their gametes by gentle aspiration in a pipette. Then, all dishes were placed in a speed-regulating vibrator (HY-4H) rotating at 60 r/min for 5 min to mix the eggs and male gametes together, and this time was considered time zero (D0). After 15 h of hatching and metamorphosis, when most of the fertilized eggs hatched successfully (all juveniles were observed to be actively filtering in their first house), three aliquots of 20 mL were randomly isolated from the 18 cohorts and photographed with a camera attached to a dissecting microscope. All samples were then reunited into 12 cohorts, and three density gradients were established (high-H, medium-M and low-L). The photographs of juveniles in each aliquot were used for numerical counting and length measurement.
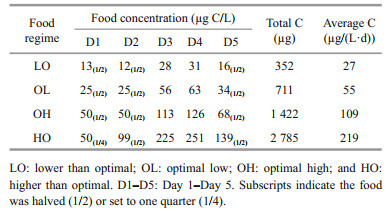
The reunited cohorts were divided into four groups with three density gradients and cultured in 5-L glass beakers under four different food regimes. In all treatments, the culture volumes were 1.5 and 2.5 L of FSW on D1 and D2, and the final volume was adjusted to 4 L on D3. To control the food concentration, a mono-diet of Isochrysis galbana was adopted for all treatments. Based on the existing reference optimum food concentration, ranging from 50–100 μg C/L (Lombard et al., 2009a), the food regimes were determined to be lower than optimal (LO, 25 μg C/L), optimal low (OL, 50 μg C/L), optimal high (OH, 100 μg C/L) and higher than optimal (HO, 200 μg C/L). Among them, the LO treatments corresponded to oligotrophic oceanic conditions, the OL and OH treatments corresponded to mesotrophic conditions, and the HO treatments corresponded to eutrophic conditions. To avoid the potential that filtering organs would be clogged by excessive feeding, the food supply in the treatments was increased gradually to the final concentrations on D3. Before the daily food additions, microalgal solutions from the same batch were prepared according to the highest concentration and diluted 2-fold successively for the rest of the treatments. At feeding time, the food concentration was roughly estimated with the empirical value of the cell carbon content and enumeration, and triplicates of the 10-mL microalgal solution were filtered through pre-burned GF/F membranes (0.77-μm pore-size) for the postincubation carbon content measurements. For determining the conversion factor between carbon content and chlorophyll a concentration, duplicate triplicates of the 10-mL microalgal subsamples were filtered through 0.45-μm pore-size cellulose acetate membranes for chlorophyll a measurement.
2.3 Counting and measurementsOn the morning of D5, when the onset of maturation was observed in a few individuals in the high food concentration treatments, the food additions were halved, and all incubations were terminated before gamete release. All animals were gently picked out and preserved in 4% neutralized formalin for counting and measurement. All the O. dioica samples were counted using a SteREO Discovery V20 (ZEISS, Germany) microscope, and the length parameters were measured using an equipped camera (Axiocam 506 color, Germany) and image analysis software (ZEN 2.3 pro). Early sexual differentiation in the O. dioica life cycle (Bouquet et al., 2009) was used as the maturity index to distinguish mature and nonmature individuals by visual observation. For the measurements of body length, trunk length, and gonad length, the method of Lombard et al. (2009a) was adopted.
For the food carbon content determination, loaded membranes were acidified using hydrochloric acid vapor for half an hour and measured with a VARIO EL cube after drying. In order to determine a reliable final remaining food concentration (pigmented particles) in each treatment, 1-L water samples were taken from the beakers and filtered through 0.45-μm pore-size cellulose acetate membranes for chlorophyll a measurement. For chlorophyll a concentration measurement, loaded membranes were extracted with 90% acetone (v/v) in a refrigerator for 24 h (≤0 ℃), and measured with a Turner Designs Model 7200 fluorimeter. With a conversion factor of 50.6 (data from food microalgal in this study), the final food concentrations in chlorophyll a was transferred into carbon content.
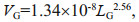
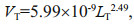
2.4 Data analysisThe gonad/body volume ratio (GVR) was calculated with the following equations established by Lombard et al. (2009a):
 (1)
(1) (2)
(2)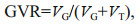 (3)
(3)where LG and LT are the length in μm of the gonad and trunk, respectively. The body volume is the sum of the gonad (VG) and trunk volumes (VT).
The maximal intrinsic rate of natural increase (rmax), determined by the simple equation rmax=lnb/T, where b is the lifetime egg number and T is the generation duration. Lifetime egg number is determined by a factor of 1 145.02 in gonad volume of mature individuals (Lombard et al., 2009a). As spawning is a short process that occurs when the gonad/body volume ratio reaches a threshold (Gorsky, 1980; Ganot et al., 2007), the generation duration is defined as the development time from fertilization to the earliest maturation, i.e. 4.5 d. Combining fecundity data with maturation rate (MR) provides a more representative estimation of the intrinsic rate of natural increase (r):
 (4)
(4) (5)
(5)where N is the population growth value. The MR refers to the proportion of mature individuals to all individuals.
The food supply for each O. dioica individual (per capita food supply, PFS), calculated as the quotient of the consumed food carbon content and final population density, was established to understand the combined effects of food availability and conspecific density on body size and population growth (Livore and Connell, 2012). Spearman correlation analyses between initial population sizes, food concentrations, and survival rates were performed to test the relationship between various parameters. Linear and exponential regression analysis between growth performance (including body length, gonad length and gonad/body volume ratio), maturation rate, intrinsic growth rate of O. dioica and food competition (including food concentration and PFS) were performed respectively with Origin Pro 9.0 (OriginLab, USA). An ANCOVA (covariance analysis) with Type Ⅲ sum of squares for unbalanced designs performed with SPSS software version 19.0 (IBM Corporation, USA) was used to test the effects of density on gonad-body length of mature and nonmature individuals. A one-way ANOVA (analysis of Variance) was used to test the effects of density and PFS on growth performance of O. dioica. Tukey's honestly significant difference (HSD) post hoc test was used to check for the differences between groups after verification of homogeneity in the variance. Differences were considered statistically significant at P < 0.05.
3 RESULT 3.1 Cohort survivorshipFrom gamete production, the entire incubation duration was 4 d and 12 h. Recalculated with the measured carbon content of algae samples, the food concentration in this experiment effectively reflected the diet regime designation (Table 1). The final food concentrations, ranged from 0.1 to 185.6 μg C/L, were lower than the average daily food addition in all treatments (Fig. 1). The remaining food concentrations were significantly related to the final population densities, with the lowest values in high densities and the highest values in low densities.

|
| Fig.1 The final food concentration (FC, bars) of each treatment at the end of the incubation duration (4 d and 12 h) and the daily food addition (symbol and line) in the experiment Treatment manipulations: H, M, and L: final high, medium, and low population density, respectively; LO and OL: lower than optimal and optimal low food concentration; and OH and HO: optimal high and higher than optimal food concentration, respectively. |
The initial cohort sizes differed among the treatments of each food regime but deviated evidently from the proposed proportion of 4꞉3꞉2 (Table 2). The final abundances were not proportional to the initial cohort sizes. In the LO and OH conditions, the highest final abundance was observed in the medium density treatments, whereas in the OL and HO conditions, the lowest final abundance was achieved in the same density treatments. Thus, in the following context, density will specifically refer to the density at the end of the incubation.

|
The survival rate, calculated as the quotient of the final and initial population size, was highest on average in the OH treatments (66.0%) and lowest in the LO treatments (41.8%). However, the survival rate was not statistically correlated with either the food concentrations (Rs=0.30, N=12, P=0.34) or initial densities (Rs=-0.15, N=12, P=0.63). In all food level treatments, an increase in mortality was not observed with an increase in the initial density. The highest mortality, 83.6%, was found in the lowest density and food concentration treatment, and the lowest mortality, 1.1%, was recorded in the OH treatment with a medium density. Similarly, low mortalities were observed in the OL treatment with the lowest density and the HO treatment with the lowest density (Table 2).
3.2 Growth performanceGenerally, both body and gonad length increased with the food concentrations, and decreased with final densities (Fig. 2). The body length of O. dioica was 145±17 μm on average after 15 h of metamorphosis, and there were no significant differences among aliquots (ANOVA: df=2, F=0.234, P=0.792). On average, body lengths of 324–549 μm were achieved at the end of the experiments. The shortest average gonad length, 70 μm, was recorded in the same treatment (H-LO) with the shortest body length. This treatment was medium in its initial cohort size but highest at the end. The highest values of body (549 μm) and gonad length (175 μm) were observed in the L-OH and L-HO, respectively. At each food level, both the final body and gonad length decreased on average with density. However, their increases with food concentration were observed only under comparatively high competition conditions, i.e. in high and medium density treatments. In low density treatments, body length in the LO condition was even longer than that in the HO condition.

|
| Fig.2 Body growth, expressed as the mean (±SD) body, gonad lengths and gonad/body volume ratio (GVR), as a function of food concentration (FC) and per capita food supply (PFS) Green, blue, and red circles represent high, medium, and low population density, respectively. |
The size difference among the density treatments at each food level decreased with the food concentration in body length (Fig. 2), but such a difference was not evident in the gonad length. On average, the body length difference decreased from 201 μm in the LO treatments to 23 μm in the HO treatments. In gonad length, the size difference was also highest (89 μm) in the LO treatments, but the lowest of 41 μm was observed in the OL treatments. In the LO treatments, the cohort with the lowest final population, 26 individuals, reached an average gonad length of 158 μm, but in the OL and OH conditions, the cohorts with final population of 82 and 91 individuals reached gonad lengths of 131 and 133 μm. The ANOVA further showed that population size in the HO treatment was still mainly responsible for the negative effect observed on gonad length (P < 0.05), but did not yield significant effect on body length (P > 0.05).
Despite food level and density, somatic growth, represented by body length, was saturated above the per capita food supply (PFS) of 8.1 μg C/ind. (Fig. 2). In saturation conditions, body length was longest in the OH treatments, with means of 530 and 549 μm recorded at PFSs of 8.1 and 13.7 μg C/ind., respectively. In the other food level treatments, the mean body length varied between 517 and 529 μm in the PFS range of 8.1–25.9 μg C/ind. Below this saturation PFS, a much shorter body length (324– 440 μm) was recorded in both the LO and OL treatments. Gonad length was also significantly shorter below the saturation PFS (70–96 μm) than above (131–175 μm), but it continued to increase even at the highest PFS. Similarly, the mean gonad/ body volume ratio increased significantly with the PFS compared to the food concentration (Fig. 2).
3.3 Maturation progressBased on visual observation, mature individuals were present at all food concentrations, but only above another PFS threshold, 4.5 μg C/ind. While non-mature individuals with different population sizes attained similar gonad lengths at a given body length in all treatments, growth performance of mature individuals differed among food and density treatments (Fig. 3). In the LO treatments, mature individuals presented only in low density condition, with mature size and gonad volume ratio similar to higher food condition treatments. At the OL food level, O. dioica matured in much shorter body length and lower gonad volume ratio in medium density comparing to low density condition. Early maturation (in short body length) was observed also in OH treatments with high density. Density effect on reproduction performance in the HO treatment was detectable only in large mature individuals, in which longer gonad length was achieved in low density.

|
| Fig.3 Relationships between gonad and body length of nonmature (primary coordinates, dashed lines) and mature (secondary coordinates, solid lines) O. dioica in lower than optimal (LO, 27 μg C/L) (a), optimal low (OL, 55 μg C/L) (b), optimal high (OH, 109 μg C/L) (c), and higher than optimal (HO, 219 μg C/L) (d) food treatments To determine the impact of population size on gonad-body length, the regression was performed for high (H, green lines), medium (M, blue lines) and low (L, red lines) population sizes. |
The size at maturation was not correlated with the food concentration but differed significantly across the PFS threshold of 5.0 μg C/ind. At each food level, the size at maturation was similar for medium- and low-density treatments but was significantly different between the high and either the medium or the low density treatments (Fig. 4). It was highest at a medium density in the OH treatment and at a low density in the OL treatment. Compared with the size at maturation, gonad volume at maturation differed significantly between high density and others in OL and OH treatments, but no significant differences in HO treatment.

|
| Fig.4 Mature individuals expressed as the mean (±SD) body lengths and gonad volume (GV) for each food treatment Black, gray and light gray bars represent high (H), medium (M) and low (L) population density, respectively. In each food treatment, medium and low population density treatments significantly different from high are indicated by asterisk. |
An exponential increase with the PFS was observed in the maturation rate (MR) (Fig. 5). In the LO treatments, a considerable proportion of the cohort (46.15%) developed beyond the gonad/body volume ratio threshold (0.3) only when the final standing stock was extremely low. When the food supply was doubled, a much lower maturation rate, 17.19%, was recorded in the OL treatment with the lowest final population, which was still 3 times that in the above LO treatment. Similarly, at the highest final population, 282 individuals, only 14 of them reached the threshold for maturation in the OH food regime. The MR was comparatively high and increased with a final population decrease in all HO treatments. Of those, the gonad/body volume ratio ranged from 0.16 to 0.72, and a vast majority had ratios higher than 0.3.

|
| Fig.5 $Maturation rate of O. dioica as a function of per capita food supply (PFS) |
Calculated with a fixed generation duration of 4.5 d, the mean maximal intrinsic rate of natural increase (rmax) varied between 0.25 and 0.65/d (Fig. 6). The rmax values from the high density in the OL and OH treatments were significantly lower than the others, while the values were saturated at any densities in HO treatment. Different with rmax estimates, the intrinsic rate of natural increase (r) was mainly dependent on density rather than the total amount of food. It decreased rapidly from 0.43 to -0.28/d when the abundance increased from 22 to 70 ind./L in the OH treatment. Correspondingly, the r value increased slowly from 0.29 to 0.5/d as the abundance decreased from 61 to 20 ind./L in the HO treatment.

|
| Fig.6 Mean (± SD) of maximal intrinsic rate of increase (rmax) and intrinsic rate of increase (r) as a function of per capita food supply (PFS) Green, blue, and red circles represent high, medium and low population density, respectively. Dotted line indicates that the negative intrinsic rate of increase. |
In general, the population growth was significantly regulated by the PFS (Fig. 6). The rmax was increased with the PFS and was saturated at values higher than 8.1 μg C/ind., the r increased slowly beyond this threshold but deceased rapidly below it. According to the size frequency distribution, the cohorts with a food supply beyond this threshold reached similar normal distributions, but negative skewness was recorded for those cultivated below this threshold (Fig. 7). The only exception was the treatment with the highest density under the highest food concentration, when a considerable proportion achieved body lengths greater than 800 μm, but the frequency was highest in the size range of 375–450 μm.

|
| Fig.7 Distribution of body length, expressed as the population density and per capita food supply (PFS, μg C/ind.), in the lower than optimal (LO, 27 μg C/L) (a), optimal low (OL, 55 μg C/L) (b), optimal high (OH, 109 μg C/L) (c), and higher than optimal (HO, 219 μg C/L) (d) food treatments Black, gray and light gray bars represent high, medium and low population density, respectively. |
In our study, both the somatic growth and maturation of O. dioica were observed to be density dependent. Along with the food-dependent growth performance established in previous studies, the effects of intraspecific competition make it possible to explain how natural populations maintain themselves when food is scarce, respond rapidly to phytoplankton blooms, and avoid over-proliferation at the end of bloom periods. It was shown that sudden collapses are unlikely to occur in natural populations owing to intrinsic growth rate regulation by intraspecific competition. More importantly, for the first time, a mechanism was proposed in this study for efficient responses to fluctuations in food availability. Moreover, a threshold per capita food supply (PFS) was proposed for growth limitation that considered both food concentration and population size.
4.1 Somatic growth saturationThe density-dependent growth performance was comparable to the performance that was attributed to the food concentration. First, a smaller body size was achieved at both a relatively lower food concentration and higher competition pressure. Considering food concentration effects (Lombard et al., 2009a), densitydependent body size was observed at all food concentrations. Second, negative impacts on somatic growth were observed only at low food concentrations (Troedsson et al., 2002), whereas in our study, the sensitivity of body size to competition was absent at the highest food level. Third, similar to the optimal food concentration, a threshold for normal development was observed in the PFS. This finding indicates that a minimum amount of energy is required for full somatic growth; maturation can also be reached below this threshold, but the size at maturation is much smaller.
Based on our results, even though the exact value could not be determined, the minimum food requirement for normal development should fall within the range of 4.5–8.1 μg C/ind. during a ca. 4.5- day generation duration, regardless of the absolute food concentrations. When the value exceeded 10 μg C/ind. at the highest food level, the animals were grown under food-satiating conditions, excluding the possibility of competition; however, a vast majority of the individuals achieved shorter body sizes with high population density condition (H-HO). Chemical interference may therefore have been an important factor affecting the performance of the population. Most marine species generally have reduced body size when cultured under mass culture conditions, even when the food resources are unlimited. In addition to the absence of competition effects, indicated by normality in the size frequency distribution, considerable proportions of cohorts matured on schedule above this threshold. It is suggested that this threshold applies to both somatic growth and maturing processes. In an individual growth model (Touratier et al., 2003), the food quantity of 1.3 μg C/ind. supplied each day, amounting to a PFS of 5.9 μg C/ind. during the 4.5- day generation duration, was not enough to trigger the release of gametes. Moreover, based on the established regression between body length and carbon weight (Lombard et al., 2009a), the individuals from normally developed cohorts in our experiments gained a carbon weight of approximately 2 μg·C. Assuming that the lifetime ingestion amount is 8.1 μg C/ind., the assimilation rate was calculated as 0.25, lower than the proposed constant of 0.33.
Based on their maintenance food concentration, it has been proposed that large O. dioica are less likely to experience food-limited growth than other mesozooplankton in natural environments (LópezUrrutia et al., 2003b). According to our results, foodlimited growth is also unlikely for small juveniles, which developed and matured normally at an initial food concentration of 13.0 μg C/L and a lifetime food supply of 8.1 μg C/ind. Considering the field observation that over 60% of ingested material could come from nonchlorophyll-containing prey (LópezUrrutia et al., 2003a), the PFS threshold proposed in our study can be satisfied more easily in natural environments than the subsistence food concentration range (20–30 μg C/L) provided in previous models (López-Urrutia et al., 2003b). This scenario is intuitive for this opportunistic metazoan species for two reasons. On the one hand, this animal has a perfect nutritional metabolism mechanism that can optimize resources for growth and gonad maturation. When experiencing low food conditions, this animal increases its clearance and ingestion rates as well as its assimilation efficiency, maximizing the collection and digestion of food (Acuña and Kiefer, 2000; Selander and Tiselius, 2003; Lombard et al., 2009a). Thus, somatic growth appears to be less sensitive to food concentrations. On the other hand, for a semelparous organism, O. dioica has evolved a lifehistory trait for maximizing reproductive success and minimizing generation time in variable environments. The gonad weight in mature animals represents 70.3% (±4.6) of the total body carbon weight (Lombard et al., 2009a). In addition to having a larger size at maturation, this species can mature at the same duration at both low and high food concentrations.
Though the mortality recorded in our experiments was generally higher at low food concentrations, it is uncertain whether mortality increased with increased competition stress. The body softness of this animal makes it susceptible to physical damage, which is the most important consideration during O. dioica collections for laboratory incubations. Here, we cannot be certain of the causes of mortality, but more individuals survived at high food concentrations (2/3 of the high concentration food treatments had densities over 43 ind./L), which may be due to weak competition when food resources are sufficient and strong competition in the food-limited treatments. However, only a small food effect was observed on adult mortality in a previous study, and successful juvenile development decreased at high food levels (Lobón et al., 2013).
4.2 Flexibility in the maturation processWhile the impact of competition pressure on somatic growth only resulted in a shortened body length, more flexible responses were presented in the maturation process. Compared with the regression established among different densities between body and gonad length, both mature and nonmature individuals in high densities achieved shorter gonad lengths at a given body length in saturated food condition. Similar to effects of food limitation (Troedsson et al., 2002), a decrease was more evident in gonad length than in trunk length.
Early maturation (shorter body size) was another response to high competition pressure. This result was observed only in two treatments when the PFSs (4.5 and 5.0 μg C/ind.) were lower than the proposed threshold for somatic growth saturation. This finding is consistent with a previous proposal, i.e., the shift from the somatic growth phase to the maturation phase occurred at a shorter body length under limited food conditions (Lombard et al., 2009a). Generally, higher temperature will get organisms growing faster (Troedsson et al., 2002; Lombard et al., 2009b) which of course implies that they also reach maturation at smaller size. However, compared to the results in laboratory conditions, early maturation was recorded more commonly in field environments with higher temperatures and population densities. A vast majority of the individuals in field samples at 25℃ were much shorter than 600 μm in the Inland Sea of Japan (Uye and Ichino, 1995), Jamaican waters (Hopcroft and Roff, 1995), Seto Inland Sea (Nakamura et al., 1997), and Jiaozhou Bay in China (Li et al., 2020). In contrast, individuals achieved body sizes longer than 1 000 μm at 15℃ in laboratory conditions (Paffenhöfer, 1973; López-Urrutia et al., 2004; Lobón et al., 2011). Most notably, natural populations with longer trunk lengths (approximately 600 μm, 15℃) were observed in less productive coastal frontal system (Spinelli et al., 2015) than in a eutrophic embayment. Indeed, most of those observations are certainly more a temperature effect than a food allocation effect.
Generation time is the most important parameter determining fitness for semelparous organisms, with the most rapid development rates (i.e., the shortest generation time) favoring greater lifetime reproductive fitness (Deibel and Lowen, 2012). As all treatments in our study were terminated at the same cut-off point, it remains uncertain whether the delayed cohorts could have achieved similar growth performance if the incubation period was lengthened. According to the model developed by Lombard et al. (2009b), the generation time decreased rapidly from 15 to 5 d as the temperature increased from 7 to 25 ℃ at the same food concentration of 100 μg C/L; however, the generation time increased less than 2 d at both decreasing and increasing food concentrations outside the optimum range of 80–120 μg C/L at a set temperature. Here, a fixed generation time was observed only if the minimum PFS was satisfied, regardless of the food concentration or cultivation density. In a previous report regarding density effects on spawning time, a relatively shorter generation time was observed at a lower density, which was based on the time at which 25% of the population had spawned (Gorsky and Palazzoli, 1989). As only one food level was included in the above mentioned study, the findings are consistent with our results and indicate that generation duration can be prolonged when the minimum food demand cannot be satisfied in a designated period. Indeed, for semelparous organisms, an important life history trait, lifespan, showed high heritability (0.89±0.47) and may therefore respond rapidly to selection pressure, either in the laboratory or in the wild (Lobón et al., 2011). In Jiaozhou Bay, mature individuals attained body lengths ranging from 114.92 to 619.11 μm during flood seasons (Li et al., 2020), providing a credible evidence for this fitness.
4.3 Implications on population size controlBased on mortality, population size is more likely to be controlled by fecundity in response to variations in food availability. When food was scarce, normal reproduction was still possible at a low population size. The notably low PFS threshold affords an explanation for O. dioica population maintenance in less productive seasons. Moreover, this threshold affords high proliferation potential once food availability is dramatically increased. However, at saturated food concentrations, the proliferation potential was further regulated by the maturation rate. The negative correlation between the maturation rate (MR) and cohort size as well as the positive correlation with the PFS provide a mechanism to catch blooms at low initial abundances and avoid over-proliferation at high densities.
The maximal intrinsic rate of natural increase (rmax, 0.25–0.65/d) in our study fell within the proposed range (Deibel and Lowen, 2012), and it was consistent with that obtained by Fenaux et al. (1986) at 18 ℃. Despite the absolute food concentration, the rmax was independent of food and density above a PFS threshold for somatic growth. However, considering the intrinsic rate of natural increase (r), calculated with the actual fecundity regulated by the MRs, a more realistic estimate of O. dioica population dynamics was achieved in this study. The r values, increased with the PFSs, were regulated by body sizes and MRs. The PFS-determined maturity rate and body size distribution appear to be the most likely explanation for the avoidance of overconsumption. Following an exponential increasing trend, the magnitude of population increase was determined by the size of the initial population. High population sizes mean that the next generation can easily exceed the environment carrying capacity in terms of the food supply. The lower maturation rate of the high abundance cohorts (H-HO) might decrease the intrinsic rate of increase. Moreover, the higher maturation rate when the abundance was low and the food concentration was high favored a rapid abundance increase to utilize the excessive food supply. In this regard, the PFS plays a role that is similar to the carrying capacity in population dynamic regulation but works more efficiently when food availability is variable. Considering the magnitude of variation, the r value should be more sensitive to changes in the MR than fecundity.
Both rmax and r can also be down-regulated by slowed development under high competition pressure. In contrast to the effects of temperature and food concentration, slowed development resulted from the fact that the minimum food demand could not be satisfied on schedule. Though it is unknown whether the threshold of lifetime food demand can be applied to such a prolonged generation time, late spawning has been recorded at high and low densities at the same food concentration (Gorsky and Palazzoli, 1989). According to our results, slowed development may occur even under favorable food conditions. This finding provides an explanation for population size regulation once over-proliferation occurred. To the original question, increased intraspecific competition pressure can potentially switch the population size increase from J- to S-shaped via a fecundity decrease, fewer spawning individuals, or a longer generation time.
5 CONCLUSIONFor O. dioica cohorts that were cultivated in various food and density regimes, normal growth and reproduction were achieved at all food concentrations only if individuals had access to enough food during the generation time. Both somatic growth and reproduction were determined by lifetime food access rather than the food concentration. Moreover, a surprisingly low threshold was suggested for the lifetime food demand by somatic growth saturation and scheduled maturation. Such a low threshold provides an explanation for the survivorship of O. dioica in food scarcity conditions, while intraspecific competition ensures population size regulation for coping with fluctuating food availability. In addition to fecundity, the intrinsic rate of natural increase can be regulated by the maturation rate and development duration.
6 DATA AVAILABILITY STATEMENTThe datasets generated during and/or analyzed during the current study are available from the corresponding author on reasonable request.
7 ACKNOWLEDGMENTWe thank the staffat Jiaozhou Bay Marine Ecosystem Research Station for their help collecting the wild animals. In addition, we are grateful to Q. LIU, Z. X. ZHAO, M. T. LIU, and A. Y. WAN for making the facilities and equipment available for this work.
Acuña J L, Kiefer M. 2000. Functional response of the appendicularian Oikopleura dioica. Limnology and Oceanography, 45(3): 608-618.
DOI:10.4319/lo.2000.45.3.0608 |
Aksnes D L, Giske J. 1990. Habitat profitability in pelagic environments. Marine Ecology Progress Series, 64: 209-215.
DOI:10.3354/meps064209 |
Alldredge A L. 2005. The contribution of discarded appendicularian houses to the flux of particulate organic carbon from oceanic surface waters. In: Gorsky G, Youngbluth M J, Deibel D eds. Response of Marine Ecosystems to Global Change: Ecological Impact of Appendicularians. Contemporary Publishing International, Paris. p. 309-326.
|
Amelina A B, Sergeeva V M, Arashkevich E G, Drits A V, Louppova N E, Solovyev K A. 2017. Feeding of the dominant herbivorous plankton species in the black sea and their role in coccolithophorid consumption. Oceanology, 57(6): 806-816.
DOI:10.1134/S000143701706011X |
Bouquet J M, Spriet E, Troedsson C, Ottera H, Chourrout D, Thompson E M. 2009. Culture optimization for the emergent zooplanktonic model organism Oikopleura dioica. Journal of Plankton Research, 31(4): 359-370.
DOI:10.1093/plankt/fbn132 |
Deibel D, Cavaletto J F, Riehl M, Gardner W S. 1992. Lipid and lipid class content of the pelagic tunicate Oikopleura vanhoeffeni. Marine Ecology Progress Series, 88: 297-302.
DOI:10.3354/meps088297 |
Deibel D, Lowen B. 2012. A review of the life cycles and life-history adaptations of pelagic tunicates to environmental conditions. ICES Journal of Marine Science, 69(3): 358-369.
DOI:10.1093/icesjms/fsr159 |
Fenaux R, Bedo A, Gorsky G. 1986. Premiéres données sur la dynamique d'une population d'Oikopleura dioica Fol, 1872 (Appendiculaire) en élevage. Canadian Journal of Zoology, 64(8): 1 745-1 749.
DOI:10.1139/z86-263 |
Fernández D, López-Urrutia A, Fernández A, Acuña J L, Harris R. 2004. Retention efficiency of 0.2 to 6 μm particles by the appendicularians Oikopleura dioica and Fritillaria borealis. Marine Ecology Progress Series, 266: 89-101.
|
Flood P R, Deibel D. 1998. The appendicularian house. In: Bone Q ed. The Biology of Pelagic Tunicates. Oxford University Press, Oxford. p. 105-124.
|
Ganot P, Bouquet J M, Kallesøe T, Thompson E M. 2007. The Oikopleura coenocyst, a unique chordate germ cell permitting rapid, extensive modulation of oocyte production. Developmental Biology, 302(2): 591-600.
DOI:10.1016/j.ydbio.2006.10.021 |
Gorsky G. 1980. Optimisation des cultures d'Appendiculaires, Approche du métabolisme de Oikopleura dioica. PhD thesis, University de Pierre et Marie Curie, Paris VI. 102 p.
|
Gorsky G, Palazzoli I, Fenaux R. 1987. Influence of temperature changes on oxygen uptake and ammonia and phosphate excretion, in relation to body size and weight, in Oikopleura dioica (Appendicularia). Marine Biology, 94(2): 191-201.
DOI:10.1007/BF00392931 |
Gorsky G, Palazzoli I. 1989. Aspects de la biologie de l'appendiculaire Oikopleura dioica Fol. 1872 (Chordata: tunicata). Oceanis, 15: 39-49.
|
Gorsky G, Fenaux R. 1998. The role of Appendicularia in marine food webs. In: Bone Q ed. The Biology of Pelagic Tunicates. Oxford University Press, Oxford. p. 161-169.
|
Gorsky M, Chrétiennot-Dinet M J, Blanchot J, Palazzoli I. 1999. Picoplankton and nanoplankton aggregation by appendicularians: fecal pellet contents of Megalocercus huxleyi in the equatorial Pacific. Journal of Geophysical Research: Oceans, 104(C2): 3 381-3 390.
DOI:10.1029/98JC01850 |
Hopcroft R R, Roff J C. 1995. Zooplankton growth rates: extraordinary production by the larvacean Oikopleura dioica in tropical waters. Journal of Plankton Research, 17(2): 205-220.
DOI:10.1093/plankt/17.2.205 |
Hopcroft R R, Roff J C, Bouman H A. 1998. Zooplankton growth rates: the larvaceans Appendicularia, Fritillaria and Oikopleura in tropical waters. Journal of Plankton Research, 20(3): 539-555.
DOI:10.1111/gcb.13955 |
Li S, Zhang G T, Zhao Z X. 2020. Growth performance of Oikopleura dioica during flood seasons in Jiaozhou Bay: implications on early maturation favored rapid response to environmental fluctuation. Regional Studies in Marine Science, 35: 101124.
DOI:10.1016/j.rsma.2020.101124 |
Livore J P, Connell S D. 2012. Reducing per capita food supply alters urchin condition and habitat. Marine Biology, 159(5): 967-973.
DOI:10.1007/s00227-011-1875-4 |
Lobón C M, Acuña J L, López-Álvarez M, Capitanio F L. 2011. Heritability of morphological and life history traits in a pelagic tunicate. Marine Ecology Progress Series, 422: 145-154.
DOI:10.3354/meps08923 |
Lobón C M, Bouquet J M, Reeve M, Novac A, Acuña J L, Thompson E M, Troedsson C. 2013. Response of the pelagic tunicate appendicularian, Oikopleura dioica to controlled simulations of a strong bloom condition: a bottom-up perspective. Limnology and Oceanography, 58(1): 215-226.
DOI:10.4319/lo.2013.58.1.0215 |
Lombard F, Renaud F, Sainsbury C, Sciandra A, Gorsky G. 2009a. Appendicularian ecophysiology I: Food concentration dependent clearance rate, assimilation efficiency, growth and reproduction of Oikopleura dioica. Journal of Marine Systems, 78(4): 606-616.
DOI:10.1016/j.jmarsys.2009.01.004 |
Lombard F, Sciandra A, Gorsky G. 2009b. Appendicularian ecophysiology. Ⅱ. Modeling nutrition, metabolism, growth and reproduction of the appendicularian Oikopleura dioica. Journal of Marine Systems, 78(4): 617-629.
DOI:10.1016/j.jmarsys.2009.01.005 |
López-Urrutia Á, Acuña J L, Irigoien X, Harris R. 2003b. Food limitation and growth in temperate epipelagic appendicularians (Tunicata). Marine Ecology Progress Series, 252: 143-157.
DOI:10.3354/meps252143 |
López-Urrutia Á, Harris R, Smith T. 2004. Predation by calanoid copepods on the appendicularian Oikopleura dioica. Limnology and Oceanography, 49(1): 303-307.
DOI:10.4319/lo.2004.49.1.0303 |
López-Urrutia Á, Irigoien X, Acuña J L, Harris R. 2003a. In situ feeding physiology and grazing impact of the appendicularian community in temperate waters. Marine Ecology Progress Series, 252: 125-141.
DOI:10.3354/meps252125 |
Martí-Solans J, Ferrández-Roldán A, Godoy-Marín H, Badia-Ramentol J, Torres-Aguila N P, Rodríguez-Marí A, Bouquet J M, Chourrout D, Thompson E M, Albalat R, Cañestro C. 2015. Oikopleura dioica culturing made easy: a low-cost facility for an emerging animal model in EvoDevo. Genesis, 53(1): 183-193.
DOI:10.1002/dvg.22800 |
Nakamura Y, Suzuki K, Suzuki S Y, Hiromi J. 1997. Production of Oikopleura dioica (Appendicularia) following a picoplankton 'bloom' in a eutrophic coastal area. Journal of Plankton Research, 19(1): 113-124.
DOI:10.1093/plankt/19.1.113 |
Paffenhöfer G A. 1973. The Cultivation of an Appendicularian through numerous generations. Marine Biology, 22(2): 183-185.
DOI:10.1007/BF00391782 |
Purcell J E, Sturdevant M V, Galt C P. 2004. A review of appendicularians as prey of fish and invertebrate predators. In: Gorsky G, Youngbluth M J, Deibel D eds. Response of Marine Ecosystems to Global Change: Ecological Impact of Appendicularians. Contemporary Publishing International, Paris. p. 359-435.
|
Robison B H, Reisenbichler K R, Sherlock R E. 2005. Giant larvacean houses: rapid carbon transport to the deep sea floor. Science, 308(5728): 1 609-1 611.
DOI:10.1126/science.1109104 |
Sato R, Tanaka Y, Ishimaru T. 2001. House production by Oikopleura dioica (Tunicata, Appendicularia) under laboratory conditions. Journal of Plankton Research, 23(4): 415-423.
DOI:10.1093/plankt/23.4.415 |
Selander E, Tiselius P. 2003. Effects of food concentration on the behavior of Oikopleura dioica. Marine Biology, 142(2): 263-270.
DOI:10.1007/s00227-002-0949-8 |
Sommer F, Hansen T, Feuchtmayr H, Santer B, Tokle N, Sommer U. 2003. Do calanoid copepods suppress appendicularians in the coastal ocean?. Journal of Plankton Research, 25(7): 869-871.
DOI:10.1093/plankt/25.7.869 |
Spinelli M, Derisio C, Martos P, Pájaro M, Esnal G, Mianzán H, Capitanio F. 2015. Diel vertical distribution of the larvacean Oikopleura dioica in a North Patagonian tidal frontal system (42°-45°S) of the SW Atlantic Ocean. Marine Biology Research, 11(6): 633-643.
DOI:10.1080/17451000.2014.978338 |
Stibor H, Vadstein O, Lippert B, Roederer W, Olsen Y. 2004. Calanoid copepods and nutrient enrichment determine population dynamics of the appendicularian Oikopleura dioica: a mesocosm experiment. Marine Ecology Progress Series, 270: 209-215.
DOI:10.3354/meps270209 |
Troedsson C, Bouquet J M, Aksnes D L, Thompson E M. 2002. Resource allocation between somatic growth and reproductive output in the pelagic chordate Oikopleura dioica allows opportunistic response to nutritional variation. Marine Ecology Progress Series, 243: 83-91.
DOI:10.3354/meps243083 |
Troedsson C, Bouquet J M, Lobon C M, Novac A, Nejstgaard J C, Dupont S, Bosak S, Jakobsen H H, Romanova N, Pankoke L M, Isla A, Dutz J, Sazhin A F, Thompson E M. 2013. Effects of ocean acidification, temperature and nutrient regimes on the appendicularian Oikopleura dioica: A mesocosm study. Marine Biology, 160(8): 2 175-2 187.
DOI:10.1007/s00227-012-2137-9 |
Touratier F, Carlotti F, Gorsky G. 2003. Individual growth model for the appendicularian Oikopleura dioica. Marine Ecology Progress Series, 248: 141-163.
DOI:10.3354/meps248141 |
Uye S I, Ichino S. 1995. Seasonal variations in abundance, size composition, biomass and production rate of Oikopleura dioica (Fol) (Tunicata: Appendicularia) in a temperate eutrophic inlet. Journal of Experimental Marine Biology and Ecology, 189(1-2): 1-11.
DOI:10.1016/0022-0981(95)00004-B |
Winder M, Bouquet J M, Bermúdez J R, Berger S A, Hansen T, Brandes J, Sazhin A F, Nejstgaard J C, Båmstedt U, Jakobsen H H, Dutz J, Frischer M E, Troedsson C, Thompson E M. 2017. Increased appendicularian zooplankton alter carbon cycling under warmer more acidified ocean conditions. Limnology and Oceanography, 62(4): 1 541-1 551.
DOI:10.1002/lno.10516 |