 2015, Vol. 33
Shanghai University
Article Information
- MENG Wei (孟玮), YANG Tianyan (杨天燕), HAI Sa (海萨), MA Yanwu (马燕武), CAI Lingang (蔡林钢), MA Xufa (马徐发), GAO Tianxiang (高天翔), GUO Yan (郭焱)
- Extensive genetic divergence among Diptychus maculatus populations in northwest China
- Chinese Journal of Oceanology and Limnology, 2015, 33(3): 577-584
- http://dx.doi.org/10.1007/s00343-015-4137-3
Article History
- Received Jun. 6, 2014
- accepted in principle Sep. 1, 2014;
- accepted for publication Oct. 23, 2014


2 Institute of Evolution & Marine Biodiversity, Ocean University of China, Qingdao 266003, China;
3 Fisheries College of Huazhong Agricultural University, Wuhan 430070, China
Schizothoracinae fi shes are a group of specialfi shes living in higher altitude of Asia(Zhu and Chen, 2009), which have both important economic and scientifi c research value. Schizothoracinae fi shesoriginated from primitive Barbinae fi shes distributedin Tibetan Plateau(Cao et al., 1981). In late Tertiaryperiod, due to the new environment of TibetanPlateau, they separated from the Barbinae fi shes and evolved into a more specialized group, gradually thefi shes spread from the Tibetan plateau to adjacentareas. According to different adaptation degree ofplateau environment, Cao et al. divided theSchizothoracinae fi shes into three evolutionarygrades: primitive, specialized, and highly specializedfi shes(Cao et al., 1981). The specializedSchizothoracinae fi shes include three genera:Diptychus, Ptychobarbus and Gymnodiptychus. D.maculates mainly distributes in Tarim River and Ili River system, it has been listed as protected animal inXinjiang China(Guo et al., 2012).
Tarim River system is located in south of TarimBasin, Kunlun Mountain lies to its south and TianshanMountain lies to its north. It contains the main stream and eight tributaries, four of which are the mostimportant sources: Aksu River, Hotan River, YarkantRiver, and Kaidu-Kongqi River. Aboriginal fi shes ofTarim River system are made up of Schizothoracinae and Triplophysa fi shes. Ili River system belonging toAsia inl and river system is located in Ili-Balkhashbasin, it is the largest international river in Xinjiangprovince of China. The main source Tekes Riveroriginates from the northern slope of Khan TengriPeak in Tianshan Mountain, flowing into China fromthe Republic of Kazakhstan, after converging withKunes River and Kashi River it is called Ili River. Itflows through Kapchagay reservoir and pours intoBalkhash Lake fi nally. There are four kinds ofSchizothoracinae fi shes in Ili River system.
Molecular genetic markers have played a majorrole in evolutionary biology(McKay and Latta, 2002). The most common used mitochondrial DNAanalysis has been widely applied in molecularsystematics of Schizothoracinae fi shes(He and Chen, 2006; Duan et al., 2009; Liu et al., 2009). Controlregion evolves more rapidly than other coding regionin mtDNA, it is very suitable for genetic analysis inpopulation level(Rosel et al., 1995; Kochzius and Blohm, 2005). In this research, control region wasused as a marker to investigate the genetic diversity and population structure of D. m aculates. Geneticdifferences among populations are often consideredworthy of conserving (Crandall et al., 2000), therefore, the conservation strategies were proposed based onthe genetic differentiation. Meanwhile, the geographiccontext of divergence is critical to underst and ing theevolutionary processes driving patterns of speciesdiversity(Knowles and Carstens, 2007), so therelationships of geological event and populationevolution were discussed in this study. Results frompresent study are expected to provide fundamentaldata and reference for biogeography and conservationof D. maculates. 2 MATERIAL AND METHOD 2.1 Sample collection
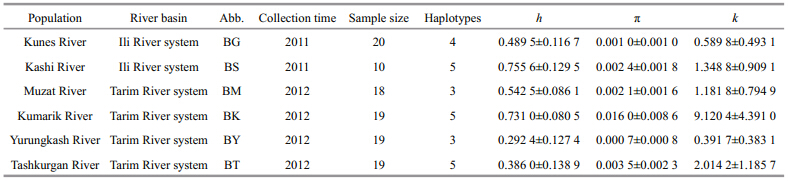
One hundred and fi ve specimens were collected bycast net from six locations in Xinjiang, NW Chinaduring 2011 to 2012(Fig. 1; Table 1). BG(43°19′N, 84°31′E) and BS(43°45′N, 83°13′E)population weresampled from Ili River system. BM(41°46′E, 81°00′E), BK(41°39′N, 79°33′E), BY(36°31′N, 79°54′E) and BT(37°53′N, 75°15′E)population weresampled from Tarim River system. A small piece ofthe caudal fi n in each individual was removed and preserved in 95% ethanol.
 |
| Fig. 1 Map of sampling locations corresponding to Table 1 |
Genomic DNA was isolated from fi n of D. maculatus by st and ard phenol-chloroform extractionprocedure. The primers used for amplifying D-loopwere GEDL200(5'-CAC CCC TGG CTC CCA AAGCCA G-3') and GEDH860(5'-AGG GGT TTG ACA AGA ATA ACA GGA-3'). PCR was carried out in avolume of 50 μL, The PCR reaction mixture consistedof 5.0 μL 10×buffer, 2.0 mmol/L Mg2+, 4 μL dNTP(2.5 mmol/L), 10 μmol/L each for the forward and reverse primers, 2 U Taq polymerase and 2 μLtemplate DNA. The PCR cycling profi le was 5 min at94°C, 35 cycles of 30 s at 94°C, 30 s at 50°C and 1 min at 72°C, followed by 10 min at 72°C. PCRproduct was purifi ed with a Gel extraction Kit(Tiangen Biotech, China). All samples were sequencedin both directions using the amplifi cation primers. 2.3 Data analysis
Sequences were edited, proofread, and alignedusing DNAstar software 7.1(DNASTAR, Inc).Molecular diversity indices such as number ofhaplotypes, polymorphic sites, transitions, transversions and indels were acquired usingDnasp5.0 and Arlequin(ver. 2.000)software(Schneider et al., 2000; Librado and Rozas, 2009).The neighbor-joining tree of the haplotypes wasconstructed using MEGA4.1 based on Tamura-Neimodel(Tamura et al., 2007). To detect the evolutionaryrelationships between the haplotypes, the medianjoining network was constructed using Network 4.0software(Bandelt et al., 1995). Genetic differentiationbetween each pair of populations was evaluated bypairwise fi xation index(Fst)calculated by Arlequin.The signifi cance of Fst was tested by 10 000permutations. An analysis of molecular variance(AMOVA)was used to assess the populationconfi guration and the geographical pattern for thedistribution of the main genetic variation. Geneticdistances used in Fst and AMOVA were calculatedusing TrN+G model given by modeltest 3.7(Posada and Crandall, 1998). Population demographic historywas examined by two different approaches. Fs test ofFu were used to test if the neutrality holds. Historicdemographic expansions were investigated byexamming frequency distributions of pairwisedifferences between sequences(mismatchdistribution). Goodness of fi t between mismatchdistribution and expectation distribution underpopulation expansion model was evaluated bysumming squares of deviations(SSD) and raggednessindex. For distribution that did not differ signifi cantly(P >0.05)from the expectation of sudden expansionmodel, population expansion time was estimatedusing the equation τ =2 ut, where u is the per-nucleotidemutation rate multiplied by the sequence length, and trepresents the number of generations since theexpansion(Rogers and Harpending, 1992). Expansiontime T equals t multiplies by generation time. 3 RESULT 3.1 Sequence variation and population geneticdiversity
A 570-bp sequence of the control region wasobtained for 105 specimens. Twenty-four haplotypeswere detected from six populations(GenBankaccession Nos. KP061812–KP061835). Amongpopulations, only Kunes River and Kashi Riverpopulation shared haplotypes with each other.Sequence comparisons revealed 48 variable sites, fi veof which were singleton variable sites with twovariants, the others were parsimony informative siteswith two variants(40 sites) and three variants(threesites). Forty-seven transitions and 7 transversionswere found in all the substitutions. The averagecontents of T, C, A, and G were 33.4%, 18.7%, 32.2%, and 15.8%, respectively.
Intrapopulation diversity indices are shown inTable 1. For all the population examined, thehaplotype diversity(h)was 0.904 8±0.012 6, nucleotide diversity(π)was 0.027 9±0.013 9, and average number of pairwise nucleotide differences(k)was 15.878 3±7.139 1. 3.2 Population genetic structure
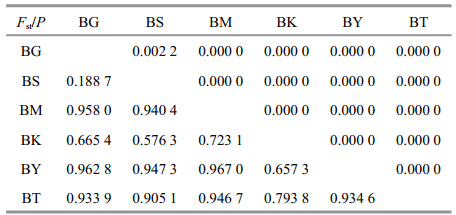
Population structure was evaluated with an analysisof molecular variance(AMOVA). The AMOVAanalysis showed that 86.31% of the total geneticvariation was apportioned among populations, thevariation within populations was 13.69%. Geneticdifferences among populations were highly signifi cant(Φst =0.863 1, P =0.000 0). The pairwise Fst valuesrevealed same conclusion with AMOVA(Table 2).All populations were signifi cantly divergent from each other(P <0.00). The largest Fst value was betweenBY population and BM population, the smallest Fstvalue was between BG population and BS population.
 |
Using G. eckloni and S. kialingensis as outgroups, NJ phylogenetic tree of D-loop haplotypes wasconstructed(Fig. 2). D. maculates was divided intotwo main clades. One clade includes all haplotypesfrom Ili River system and one haplotype fromKumarik River(Tarim River system). The other cladecomprises haplotypes coming from Tarim Riversystem, which cluster together according to theirgeographic locations respectively.
 |
| Fig. 2 Unrooted NJ tree for mtDNA control regionhaplotypes constructed under Tamura-Nei model |
The median joining network revealed similar resultto phylogenetic tree(Fig. 3), haplotypes from Ili Riversystem were closely related, the other haplotypesform independent lineages respectively, but onehaplotype from Kumarik River was close to Ili Riverpopulation. Most variations within populations wereunder 10 steps, while between populations were over10 steps.
 |
|
Fig. 3 Median joining network of D. maculates Sizes of circles are proportional to haplotype frequency, the number marks near the lines joining haplotypes represent the number of nucleotide substitutionsteps. |
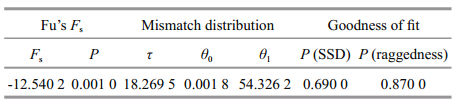
The results of the neutrality test are shown inTable 3. Fu’s Fs test was very sensitive to population expansion. The test for the total sample was negative and highly signifi cant, which indicated a recentpopulation expansion. The high level of haplotypediversity and low level of nucleotide diversity alsosupport this conclusion. The mismatch distributionwas not clearly unimodal, but not deviated signifi cantlyfrom expectations under the sudden expansion model(PSSD =0.69, Praggedness =0.87)(Fig. 4). A tenable averagedivergence rate for fi sh control regions of approximately3.6% per million years was applied in present study(Donaldson and Wilson, 1999), which was slightlyhigher than the divergence rate of combined controlregion and cytochrome b sequences in Gymnocyprisfish(Zhao et al., 2009). This is consistent with theactual situation, for control region usually evolvesfaster than Cytb. Assuming the generation time wasfour years(Romanovsky, 2002), according to theobserved value of expansion parameter τ, the expansiontime T was estimated at 3.561 3 Ma.
 |
| Fig. 4 The observed pairwise difference(bars) and expectedmismatch distribution under the sudden expansionmodel(solid line)of the control region haplotypes inD. maculates |
Compared with other specialized Schizothoracinaefishes such as G. chilianensis, G. eckloni, and G.przewalakii(Zhao et al., 2009, 2011), the geneticdiversity of D. maculates was higher, which could beattributed to the signifi cant divergence amongpopulations. Very few shared haplotypes resulted in ahigh number of haplotypes in total. In BS population, fi ve haplotypes were detected from 10 individuals, making its haplotype diversity(h)the highest. In BKpopulation, one haplotype was distinct from the otherfour and close to haplotypes from Ili River system, which led to its highest nucleotide diversity(π). Bothhaplotype diversity and nucleotide diversity of BYpopulation were the lowest, this might be associatedwith the aggravated impact of human activities inYurungkash River. In recent decades, it becomesmore convenient to approach the river owing to thenew road built along the riverside, large machineryhas been used in jade mining, which has changed thewatercourse in this area greatly and damaged theliving habitats of the fi sh severely. 4.2 Population genetic divergence
AMOVA analysis indicates signifi cant geneticdivergences among populations, which was alsosupported by signifi cant P values of Fst. Thehaplotypes from Ili River system had a tightrelationship and a shared haplotype, suggesting thatthe divergence within Ili River system was thesmallest, which coincided with the lowest Fst value.While the nonexistent shared haplotypes and morevariation steps among Tarim River system populationsshowed a higher genetic divergence. NJ phylogenetictree showed that Ili River and Tarim River populationsformed two distinct clades respectively, this was alsosupported by morphological evidence: the rows ofscales below lateral line in individuals from TarimRiver system were degenerated to 1–2 or even none;however individuals from Ili River system had morerows(Wu and Wu, 1992). Besides, it was worthmentioning that, the haplotypes from Kumarik Riverformed two groups both in network and phylogenetictree, indicating possible ancient relation between IliRiver and Kumarik River. The two rivers might beconnected before the uplift of Tianshan MountainRange, at that time a part of D. maculatus individualsspread from Ili River to Kumarik River and thenseparated by the Tianshan orogeny, these migratoryindividuals has closer genetic relationship with IliRiver populations than the original Kumarik Riverpopulations due to the shorter separation time. 4.3 Population demographic history
Past climatic and geological events can have aprofound impact on evolutionary change withinspecies(Johnson, 2002). Historical contingencies c and irectly affect evolution by altering levels of gene flow in species; historical events can also indirectlyshape evolution by altering the selective environmentsin which populations exist(Felsenstein, 1976; Endler, 1977; Schluter, 1998; Bernatchez et al., 1999). Thegeological change of Tibetan Plateau was the mostinfluential event in geologic history of China(Jiang et al., 1997). The geological studies indicated that theuplift of Tibetan Plateau included three major phases, the early stage, which was called ‘Qingzang(Tibet)Movement’, occurred between 3.6–1.7 Ma and included A, B and C phases commencing at 3.6, 2.5, and 1.7 Ma, respectively(Li et al., 1996). Theexpansion time of D. maculates populations was closeto the time of Qingzang(Tibet)Movement phase A.The rapid uplift of mountain changed the climate and natural environment of plateau dramatically, whichwould have great impact on the evolution of fi shfauna. The fi sh population went through a bottleneckeffect, and then increased rapidly under the newenvironment. 4.4 Wide genetic divergence in limited area
In general, physical barriers to adult movementwill be more pronounced in freshwater habitats thanin marine environment, freshwater species occupyingunconnected habitats will have very limited scope forgene flow(Ward et al., 1994). Geographic isolationhas been widely found in freshwater fi shes, and usually accompanied with intraspecifi cphylogeographic pattern. In this study, D. maculatusshowed genetic divergence and morphologicaldifferentiation between two river systems. Meanwhile, genetic differences also existed within Tarim Riverpopulations, especially in Tashkurgan and YurungkashRiver populations, which were quite different fromthe other two Tarim River populations. This may berelated to the unique geographical conditions.Tashkurgan was a part of Pamirs with a higher altitudethan the other sampling sites, previous studiessuggested that the evolution of Schizothoracinaefi shes was a process of adapting to higher altitude, thegenetic variations could also occur in this procedureaccordingly. During the sampling process inYurungkash River(one tributary of Hotan River), D. maculatus was not found in downstream until arrivingat a higher altitude. As another tributary of HotanRiver, Karakash River has lower altitude than theformer; the fi shes were not captured although the tworivers were connected. It was supposed that thedistribution of D. maculates was restricted strictly byaltitude, they would not spread to downstream even ifthe rivers were connected. Therefore, the fi shes ofdifferent populations did not mix with each otheralthough the geographic distance was not very far.This low gene flow was supported by the nonexistenceof shared haplotypes among Tarim River populationsin our results. In addition, the Tarim River system waslocated in arid region; its tributary was separated bythe Taklimakan Desert, the cutoff of river duringdrought period also imposed restrictions on the geneexchange of fi shes.
Additional to the factors mentioned above, thegeological changes of the mountains also contributedto the evolution of fi shes. The southern edge of theTarim River system adjoins the Kunlun Mountain thatuplifted with the rise of Tibet Plateau during theevolution history of Schizothoracinae fi shes. Thesechanges might cause a great impact on the fi shes ofTashkurgan and Yurungkash River that were distinctfrom other populations. The uplift of Tianshanpossibly led to the genetic differentiation between theIli River and northern Tarim River populations. Thetwo populations of Ili River system shared haplotypes and the genetic differentiation was small, whichprobably were caused by their short distance and similar environment such as altitude, climate and hydrology conditions. 4.5 Conservation strategies
The schizothoracinae species are characterized bylow growth rate, low fecundity and late sexualmaturity(Li and Chen, 2009), therefore, the resourcesare usually diffi cult to restore when overfi shing. Inthe past few decades, stock abundance of D. maculateshad declined under human impact and various factors, the resources are in urgent need of protection. Speciesthat have more genetic variations within populationoften have better adaptability to environment changes, species with low genetic variability might extinctmore easily(Richard et al., 2000). Despite the overallgenetic diversity was not low, the number ofhaplotypes was small for each separated population.It is conjectured that the low genetic diversity withinpopulations was related to the habitat fragmentation.The homogeneous environment in each patch ofhabitat resulted in a low genetic variation withinpopulation. In addition to natural factors, humanactivities also aggravated the habitat fragmentation, such as many hydropower stations were built up inthe river, which hindered the gene flow and larvaedispersal. Thus, environment evaluation and countermeasures such as fi sh passage and propagation station should be adopted during the procedure ofhydropower station construction. When managing aspecies as a resource, the ability to assess populationgenetic diversity and structure is a vital tool formaintaining a productive fi shery(Seeb et al., 1990).Conservation strategies should be carried out basedon their genetic relationships. In this research, wefound that BG and BS, BK and BM population hadclose genetic relationship, respectively. Meanwhile, in consideration of geographic environment, it wasproposed that D. maculates populations could bedivided into three groups: the Ili River system group(BG, BS), the northern Tarim River group(BK, BM) and the southern Tarim River group(BT, BY). 5 CONCLUSION
The phylogeographic pattern of D. maculatesdistributed in Xinjiang was investigated in this study, results showed extensive genetic divergencesoccurred among different geographic populations.This might be caused by two reasons: fi rstly, thegeological events of surrounding mountains result indramatic environment change; secondly, the barriereffect of Tianshan Mountain and the aridifi cation ofTarim Basin lead to the water system isolation. Theemergence of genetic divergences reflects theevolutionary process of how specializedSchizothoracinae fi shes adapt to high altitudeenvironments. This research provided helpful data fordeveloping conservation strategies of aboriginalfi shes. 6 ACKNOWLEDGEMENT
We are grateful to CHEN Peng, QI Feng, NIUJiangong, and LIU Jian for collecting samples fromTarim River and Ili River.
| Bandelt H J, Forster P, Sykes B C et al. 1995. Mitochondrial portraits of human populations. Genetics, 141 : 743-753. |
| Bernatchez L, Chouinard A, Lu G. 1999. Integrating molecular genetics and ecology in studies of adaptive radiation: whitefish, Coregonis, as a case study. Biological Journal of Linnean Society, 68 : 173-194. |
| Cao W X, Chen Y Y, Wu Y F et al. 1981. Origin and evolution of schizothoracine fishes in relation to the upheaval of the Xizang Plateau. In : Tibetan Expedition Team of the Chinese Academy of Science ed. Studies on the Period,Amplitude and Type of the Uplift of the Qinghai-Xizang Plateau. Science Press, Beijing, China. p.118-130. (in Chinese) |
| Crandall K A, Bininda-Emonds O R P, Mace G M et al. 2000.Considering evolutinary processes in conservation biology. Trends in Ecology & Evolution, 15 (7): 290-295. |
| Donaldson K A, Wilson Jr R R. 1999. Amphi-panamic geminates of snook (Percoidei: Centropomidae) provide a calibration of the divergence rate in the mitochondrial DNA control region of fishes. Molecular Phylogenetics and Evolution, 13 (1): 208-213. |
| Duan Z, Zhao K, Peng Z et al. 2009. Comparative phylogeography of the Yellow River schizothoracine fishes (Cyprinidae): vicariance, expansion, and recent coalescence in response to the Quaternary environmental upheaval in the Tibetan Plateau. Molecular Phylogenetics and Evolution, 53 (3): 1 025-1 031. |
| Endler J A. 1977. Geographic Variation, Speciation, and Clines. Princeton University Press, Princeton. |
| Felsenstein J. 1976 The theoretical population genetics of variable selection and migration. Annual Review of Genetics, 10 : 253-280. |
| Guo Y, Zhang R M, Cai L G et al. 2012. Fishes of Xinjiang.Xinjiang Science and Technology Press, Urumqi. p.125-128. (in Chinese) |
| He D, Chen Y. 2006. Biogeography and molecular phylogeny of the genus Schizothorax (Teleostei: Cyprinidae) in China inferred from cytochrome b sequences. Journal of Biogeography, 33 (8): 1 448-1 460. |
| Jiang Z G, Ma K P, Han X G. 1997. Conservation Biology.Zhejiang Science and Technology Press, Hangzhou, China. p.51-65. (in Chinese) |
| Johnson J B. 2002. Evolution after the flood: phylogeography of the desert fish Utah chub. Evolution, 56 (5): 948-960. |
| Knowles L L, Carstens B C. 2007. Estimating a geographically explicit model of population divergence. Evolution, 61 (3): 477-493. |
| Kochzius M, Blohm D. 2005. Genetic population structure of the lionfish Pterois miles (Scorpaenidae, Pteroinae) in the Gulf of Aqaba and northern Red Sea. Gene, 347 : 295-301. |
| Li J, Fang X, Ma H et al. 1996. Geomorphologic and environmental evolution in upper reaches of Yellow River during the late Cenozoic. Science in China, Ser. D, 39 (4): 380-390. |
| Li X, Chen Y F. 2009. Age structure, growth and mortality estimates of an endemic Ptychobarbus dipogon (Regan, 1905) (Cyprinidae: Schizothoracinae) in the Lhasa River,Tibet. Environmental Biology of Fishes, 86 : 97-105. |
| Librado P, Rozas J. 2009. DnaSP v5: A software for comprehensive analysis of DNA polymorphism data.Bioinformatics, 25 : 1 451-1 452. |
| Liu Q, Wang S, Zhang X et al. 2009. Limited genetic diversity of an endemic subspecies Schizopygopsis chengi baoxingensis as inferred from the mitochondrial DNA control region. Hydrobiologia, 632 (1): 371-376. |
| McKay J K, Latta R G. 2002. Adaptive population divergence: markers, QTL and traits. Trends in Ecology & Evolution, 17 (6): 285-291. |
| Posada D, Crandall K A. 1998. Modeltest: testing the model of DNA substitution. Bioinformatics, 14 : 817-818. |
| Richard P, Ji W Z. 2000. A primer of Conservation Biology.China Forestry Press, Beijing, China. p.89-91. |
| Rogers A R, Harpending H. 1992. Population growth makes waves in the distribution of pairwise genetic differences.Mol ecular Biol ogy and Evol ution, 9 : 552-569. |
| Romanovsky V V. 2002. Hydrobiology of Lake Issyk-Kul. In :Klerkx J, Imanackunov B eds. Lake Issyk-Kul: Its Natural Environment. Springer, Netherlands. p.27-43. |
| Rosel P E, Dizon A E, Haygood M G. 1995. Variability of the mitochondrial control in populations of the harhour porpoise Phocoerla phocoena on interoceanic and regional scales. Can adian J ournal of Fish eries and Aquat ic Sci ences, 52 : 1 421-1 429. |
| Schluter D. 1998. Ecological causes of speciation. I n : Howard D J, Berlocher S H eds. Endless Forms: Species and Speciation. Oxford University Press, New York. p.114-129. |
| Schneider S, Roessli D, Excoffier L. 2000. ARLEQUIN,Version 2.000: A Software for Population Genetic Data Analysis. University of Geneva, Geneva. |
| Seeb L W, Seeb J E, Polovina J J. 1990. Genetic variation in highly exploited spiny lobster Panulirus marginatus populations from the Hawaiian Archipelago. Fishery Bulletin, 88 : 713-718. |
| Tamura K, Dudley J, Nei M et al. 2007. MEGA4: Molecular Evolutionary Genetics Analysis (MEGA) Software Version 4.0. Mol ecular Biol ogy and Evol ution, 24 : 1 596-1 599. |
| Ward R D, Woodwark M, Skibinski D. 1994. A comparison of genetic diversity levels in marine, freshwater, and anadromous fishes. Journal of Fish Biology, 44 : 213-232. |
| Wu Y F, Wu C Z. 1992. The fishes of the Qinghai-Xizang Plateau. Sichuan Publishing House of Science & Technology, Chengdu. p.421-429. (in Chinese) |
| Zhao K, Duan Z, Peng Z et al. 2009. The youngest split in sympatric schizothoracine fish (Cyprinidae) is shaped by ecological adaptations in a Tibetan Plateau glacier lake.Molecular Ecology, 18 : 3 616-3 628. |
| Zhao K, Duan Z, Peng Z et al. 2011. Phylogeography of the endemic Gymnocypris chilianensis (Cyprinidae): sequential westward colonization followed by allopatric evolution in response to cyclical Pleistocene glaciations on the Tibetan Plateau. Mo lecular Phylogenet ics and Evol ution, 59 : 303-310. |
| Zhu X F, Chen Y F. 2009. Preliminary study on the age and growth characteristics of Schizothorax macropogon. Chinese Journal of Zoology, 44 (3): 76-82. (in Chinese) |