 2015, Vol. 33
Shanghai University
Article Information
- LI Yunkai (李云凯), ZHANG Miao (张妙)
- Ontogenetic changes in isotopic signatures of an omnivorous fish Cultrichthys erythropterus in East Lake Taihu, China
- Chinese Journal of Oceanology and Limnology, 2015, 33(3): 725-731
- http://dx.doi.org/10.1007/s00343-015-4146-2
Article History
- Received May 11, 2014
- accepted in principle Aug. 2, 2014;
- accepted for publication Sep. 6, 2014


The morphological changes that accompany growth and habitat use for feeding strategies may affect the dietary intake of fish species during their lifespan(Werner and Hall, 1976). A better underst and ing of shifts in diet and habitat use is essential for the ecological study and ecosystem structure of fish species, which is connected via interspecies interactions through competition and predation(Paine, 1980).
Traditional dietary investigations of fish are conducted using stomach content analyses. However, this method only provides a snapshot of a short feeding period and is unable to accurately describe long-term foraging strategies(Genner et al., 2003). Carbon and nitrogen stable isotope ratios(13 C and 15 N)are being increasingly used by ecologists to address trophic relationships, complementing traditional stomach content analyses(Post et al., 2000; Post, 2002; Fry, 2007; Guzzo et al., 2011). It is widely recognized that the isotopic composition of an organism is determined by the isotopic value of the food consumed(DeNiro and Epstein, 1978a, b, 1979). δ13C changes little as carbon moves up the food chain and can be used to evaluate the ultimate sources of energy of an organism, while the δ15N of an organism is typically enriched by 3.4‰(±1‰)relative to its diet, and provides a means to quantify the trophic position of an organism(Minagawa and Wada, 1984; Peterson and Fry, 1987; Cabana and Rasmussen, 1994; Fry, 2007; Guzzo et al., 2011). Thus, stable isotopes can provide a continuous view of trophic patterns during changes in diet and habitat use of an omnivorous fish(Vander Zanden et al., 1999). The combination of fish stomach content and stable isotope analyses has indicated that the body size of a predator and its prey should be signifi cantly correlated(Wang et al., 2011). Recent studies have employed stable isotopes to investigate ontogenetic diet shifts in, for example, lake trout(Grey, 2001; Zimmerman et al., 2009), cichlid fish(Genner et al., 2003), goatfish(Kolasinski et al., 2009), darkbarbel catfish(Wang et al., 2011), walleye(Overman and Parrish, 2001) and lake anchovy(Xu et al., 2007).
The present study focuses on a non-migratory species, the Redfi n Culter(Cultrichthys erythropterus), a small omnivorous fish of commercial importance widely distributed in East Lake Taihu, China. Its ecological function in the restoration of eutrophic lakes has been increasingly observed in recent years(Zhou et al., 2011). This fish breeds annually from May to July in aquatic zones with abundant submerged vegetation(Sun and Huang, 1993). Traditional stomach content analyses have revealed that this species shifts its diet from zooplankton to small fish and shrimp as it grows(Zhou et al., 2011).
The primary aim of this study was to examine the relationship between stable isotopic signatures and body size in C. erythropterus, and to determine if and how stable isotopic signatures indicate these dietary changes during its life history. 2 MATERIAL AND METHOD 2.1 Sampling
A lake survey was conducted in October 2011 and a total of 78 individual Redfi n Culter were captured in East Lake Taihu. Floating and submersed leaves of macrophytes were also collected by h and at each site. Phytoplankton and zooplankton samples were taken by hauling plankton nets(47 μm mesh size for phytoplankton and 64 μm for zooplankton)vertically through the entire water column. The faunal samples were identifi ed to species and kept overnight in distilled water to allow for gut evacuation. Fish were caught by fishermen using casting nets and standard length(SL)was recorded for each fish captured. All samples were frozen whole and transported to the laboratory in thermally sealed plastic bags. Based on survey results from 2009, two primary prey/consumer species with a high abundance and wide distribution were chosen as baseline species—the mussel Corbiculafluminea and the snail Bellamya aeruginosa. Mussel and snail samples were collected from three different sites(Fig. 1) and the foot tissue of both prey species was excised and used for stable isotope analysis(Michell et al., 1996). Mussels and snails of similar body weight(both were grouped by 1 g from their weight data)were pooled for processing. Since it shows less variability in terms of δ13C and δ15N than other tissues(Pinnegar and Polunin, 1999), the dorsal muscle(white muscle)of each fish was removed, rinsed with distilled water, placed in cryovials and frozen at -20°C for later stable isotope analysis. Sample sizes for stable isotopes ranged from 2–3 replicates per species.
 |
|
Fig. 1 Location of Lake Taihu, China Black dots represent the sampling sites for the baseline species snail Bellamya aeruginosa and mussel Corbicula fluminea. The triangle denotes the approximate location from which fish samples were collected. |
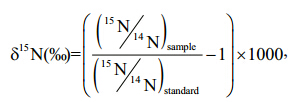
For stable isotope analyses, the tissue and muscle samples were dried at -55°C for ≥24 h using a Christ Alpha 1-4 LSC freeze dryer to a constant weight, ground to fi ne homogeneous powders in an agate mortar and pestle, and then fi ltered through a 150-μm fi lter for homogenization. Approximately 1–2 mg of each sample were weighed into 0.3-mg tin capsules and analyzed using an IsoPrime 100 isotope ratio mass spectrometer(Isoprime Corporation, Cheadle, UK) and a vario ISOTOPE cube elemental analyzer(Elementar Analysensysteme GmbH, Hanau, Germany). The isotopic composition of samples was expressed as δ13C and δ15N notation using the following equations:

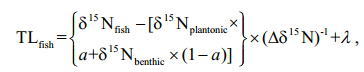
An isotope-mixing model was used to estimate the contribution of planktonic secondary production to the fish using the formula:
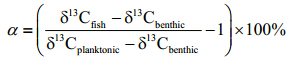
If the δ13C value of the fish fell beyond either end member in the mixing model(indicating >100% pelagic reliance or <0% pelagic reliance), values were set at either 100% or 0%(Vander Zanden et al., 2011; Wang et al., 2011).
All the statistical analyses were performed using the statistical package R(version 2.13.0; R Development Core Team 2011). Before analysis, all stable isotope data were tested for normality using the Shapiro-Wilk test(P >0.05) and transformed where appropriate. 3 RESULT
The standard length(SL) and weight(W)of C. erythropterus ranged from 8.5 to 23.5 cm and from 5.6 to 192.1 g, respectively, and they exhibited a typical length-weight relationship(W =0.002 8SL 3.553 3, R2 =0.963, n =78; Fig. 2a). The δ13C values ranged from -27.10‰ to -17.80‰(means±SD: -24.04±2.28‰) and showed a signifi cantly positive relationship with length(F1, 76 =68.42, P <0.000 1, R2 =0.469, n = 78; Fig. 2b) and weight(F1, 76= 39.71, P < 0.000 1, R2 =0.343, n = 78; Fig. 2c). However, the δ15N values ranged from 12.99‰ to 17.17‰(mean±SD: 15.10±0.83‰) and showed no relationship with length or weight [F1, 76= 0.015, P= 0.9, R2 =0.02, n = 78(Fig. 2d) and F1, 76= 0.112, P = 0.739, R2 =0.001, n = 78(Fig. 2e), respectively].
 |
|
Fig. 2 Relationship between Cultrichthys erythropterus weight and standard length(a), muscle δ13C and standard length and weight(b, c), and muscle δ15N and body length and weight(d, e)in East Lake Taihu Red lines represented the signifi cant relationships. |
The δ15N and δ13C signatures of the pelagic food chain baseline(mussels)were 10.52±0.80‰ and -27.47±1.33‰(n = 18), respectively, and those of benthic food chain baseline(snails)were 11.78±0.75‰ and -23.09±0.55‰(n =15), respectively.
The trophic level of C. erythropterus estimated from the two-source mixed model ranged from 2.17 to 3.93 with a mean of 3.17±0.33, and showed a signifi cantly negative relationship with body size(F1, 76=14.81, P < 0.001, n = 78 for length and F1, 76= 11.53, P < 0.01, n = 78 for weight). However, the pelagic reliance of C. erythropterus decreased signifi cantly with increasing body size(F1, 77=68.21, P < 0.000 1, R2 =0.473, n = 78 for length and F1, 77= 34.65, P < 0.000 1, R2 =0.313, n = 78 for weight)(Fig. 3).
 |
|
Fig. 3 Relationship between the pelagic contribution to Cultrichthys erythropterus body carbon and their(a)body length and (b)body weight(n =79)in East Lake Taihu Red lines represented the signifi cantly negative relationships(P <0.001). |
Compared with the highly temporal variations in the stable isotopic signatures of phytoplankton and periphyton, two long-lived macro-invertebrates—the freshwater mussel C. fluminea and the snail B. aeruginosa —showed less variation in stable isotope values. The averaged δ13C value for C. fluminea was 4.36‰ lower than that of B. aeruginosa, suggesting that δ13C in the base of the pelagic food chain was more depleted than that in the base of the littoral food chain, which is in agreement with the previous studies of France(1995) and Vander Zanden et al.(2011). The large differences between δ13C values for these two food chains allowed for the application of the two-end-member mixing model in this study.
Unlike other parts of Lake Taihu, East Lake Taihu has abundant macrophytes, which provide a habitat for fish such as C. erythropterus. Previous stomach content analyses have shown that C. erythropterus undergoes a diet shift from zooplankton to small fish and shrimp when their standard length reaches 10.5 cm(Zhou et al., 2011), representing a switch from a predominantly zooplanktivorous feeding mode to a more piscivorous benthic-feeding mode. Given that decreased planktivory results in enrichment of 13 C, our results are compatible with the diet being a proximate cause of the trajectory of carbon isotopic shifts, as the stable carbon isotopic signature fl ows through the food web with little enrichment(1‰)(Post et al., 2000; Genner et al., 2003; Fry, 2007).
It is recognized that differences in lipid content between organisms can infl uence the δ13C values of tissues and thereby complicate the interpretation of food pathways(France, 1996; Pinnegar and Polunin, 1999). We examined the C/N ratios of sampled fish and recorded no relationship between the C/N ratios(3.14–3.28)of C. erythropterus and those of δ13C(P=0.3, n =78). This may indicate that the ontogenetic variability of δ13C values in C. erythropterus refl ects dietary, and not biochemical, differences between individuals of different sizes and hence lipid extraction is unnecessary(Post et al., 2007). In addition, it is known that 93% of aquatic species in large lakes inhabit the near-shore littoral zone and 72% are completely restricted to the littoral zone, even though littoral habitats are a small fraction of the total lake area(Vadeboncoeur et al., 2011). This may also confi rm the change in the carbon source for this fish species, as spatial variations in δ13C were unable to explain the wide range of δ13C values(9.3‰). Moreover, the decreased reliance on pelagic resources with increasing body size provides further confi rmation of changes in the primary carbon source and a diet switch during the lifespan of a species(Vander Zanden et al., 1998, 2011).
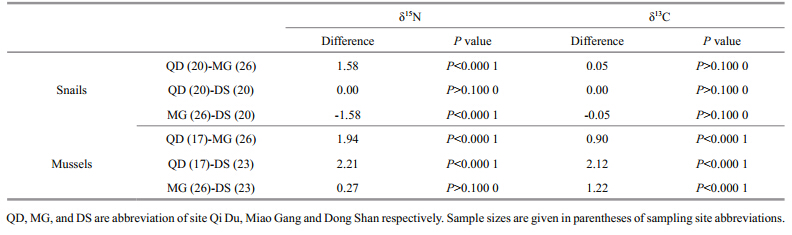
However, it is notable that the results revealed unexpected trends in δ15N values with body size, given the hypothesis that increased piscivory results in enrichment of 15 N(Genner et al., 2003). The δ15N pattern recorded here, with little fl uctuation, could be attributed to a number of ecological factors, including morphology, behavior, distribution, food availability and cost of competition, predation and parasitism(Grey, 2001; Genner et al., 2003). It is believed that increased gap size and improved locomotory skills in fish species facilitate their potential for migration between nursery grounds and new habitats with a different ecology and available prey species(Laegdsgaard and Johnson, 2001). With increasing body size of C. erythropterus, small fish such as Hemiculter leucisculus and shrimp such as Exopalaemon modestus increasingly appear in the stomach contents. As shown in the food web diagram based on stable carbon and nitrogen isotopic values(Fig. 4), zooplankton had a medium δ15N value compared with that of H. leucisculus and E. modestus. A positive relationship between the stable carbon and nitrogen isotopic signatures of fish with the trophic states of their habitats has been identifi ed in eutrophic lakes(Xu et al., 2005; Li, unpublished data). The results of a Tukey’s honestly signifi cant difference test(Table 1)showed signifi cant spatial variability in δ15N and δ13C values for snails and mussels between sites. This indicates that the δ15N pattern identifi ed in C. erythropterus could also be due to a switch in habitat and that this might be a direct response to physiological requirements or a strategy to lower competition intensity for shared resources and , therefore, increase individual fi tness(Paine, 1980; Genner et al., 2003). The increasing confi dence interval for both δ15N and δ13C values in C. erythropterus with increasing body size provided further evidence of habitat expansion.
 |
|
Fig. 4 Food web diagram of the East Lake Taihu Error bars represented the standard deviations. SS: Silurus spp. EI: Erythroculter ilishaeformis; SC: Siniperca chuatsi; CE: Cultrichthys erythropterus; PF: Pelteobagrus fulvidraco; OO: Odontobutis obscures; CA: Carassius auratus; EM: Exopalaemon modestus; SE: Seston; ZO: Zooplankton; BA: Bellamya aeruginosa; HL: Hemiculter leucisculus; HC: Hemiculter leucisculus; CF: Corbicula fluminea; LG: Lanceolaria glayana; UD: Unio douglasiae; AW: Anodonta woodiana; PH: Phytoplankton; VS: Vallisneria spiralis. |
 |
Another explanation for the δ15N pattern observed here could be that it is a consequence of isotopic turnover rates varying with metabolic rates of tissues and the growth rates of fish(Hobson and Clark, 1992). It is generally accepted that the isotopic signature of different diets or habitats is rapidly refl ected in changes in the isotopic composition of fish tissue, though it may take at least 3–6 months for nitrogen to be recorded in fish muscle(Fry et al., 1999; Church et al., 2009). Moreover, isotopic signatures in fish muscle may incorporate long-term feeding strategies and the isotopic features of different habitats(Fry, 2007). Vander Zanden et al.(1998)found that smallmouth bass(Micropterus dolomieu)began with the isotopic signature of the egg, but then the signature quickly shifted to refl ect their environment as they grew. Increased total nitrogen levels, due to sewage pollution, have been observed in Lake Taihu over the past 5 years and this may lower the weighted composition of the nitrogen isotopic signature in the muscle tissue of older fish as those of newborn fish refl ect the current isotopic value of the lake. At present, it is not possible to distinguish between these competing explanations. High metabolic-rate tissues, such as liver, could be used to detect short-term δ15N shifts(Vander Zanden et al., 1998), and this approach could be used as an indicator of cannibalism and predation upon larval fish and eggs, as long as the target prey item has a distinctive chemical signature in relation to other potential prey species.
In summary, the stable carbon isotopic signature found in this study confi rms the results of previous stomach content analyses in that C. erythropterus undergoes a diet switch, and are comparable to the results of recent studies showing that littoral-benthic resources can play an important role in supporting fish species in shallow lakes(Vander Zanden and Vadeboncoeur, 2002; Zanden et al., 2011). In contrast, the stable nitrogen isotopic signature exhibits an unusual pattern compared with other studies, indicating that an array of variables may infl uence the nitrogen isotopic signature of an organism(Harvey et al., 2002). Ecologists should consider these variables when analyzing intra-specifi c variations and the timing of life-history events, such as estimating the trophic position of fish species via their stable isotopic signatures. 5 ACKNOWLEDGMENT
The authors would like to thank Dr. MJ Vander Vander for his support and help with stable isotope data.
| Cabana G, Rasmussen J B. 1994. Modelling food chain structure and contaminant bioaccumulation using stable nitrogen isotopes. Nature, 372: 255-257. |
| Church M R, Ebersole J L, Rensmeyer K M, Couture R B,Barrows F T, Noakes D L G. 2009. Mucus: a new tissue fraction for rapid determination of fish diet switching using stable isotope analysis. Can. J. Fish. Aquat. Sci., 66 : 1-5. |
| DeNiro M J, Epstein S. 1978a. Influence of diet on the distribution of carbon isotopes in animals. Geochim.Cosmochim. Acta, 42 : 495-506. |
| DeNiro M J, Epstein S. 1978b. Influence of diet on the distribution of nitrogen isotopes in animals. Geochim.Cosmochim. Acta, 45 : 341-353. |
| DeNiro MJ, Epstein S. 1979. Relationship between the oxygen isotope ratios of terrestrial plant cellulose carbon dioxide and water. Science, 204: 51-53. |
| France R L. 1995. Differentiation between littoral and pelagic food webs in lakes using stable carbon isotopes. Limnol.Oceanogr., 40 : 1 310-1 313. |
| France R L. 1996. Ontogenetic shift in crayfish δ13C as a measure of land-water ecotonal coupling. Oecologia, 107 : 239-242. |
| Fry B, Mumford P L, Tam F, Fox D D, Warren G L, Havens K E, Steinman A D. 1999. Trophic position and individual feeding histories of fish from Lake Okeechobee, Florida.Can. J. Fish. Aquat. Sci., 56 : 590-600. |
| Fry B. 2007. Stable Isotope Ecology. Springer.Gabana G, Rasmussen J B. 1994. Modelling food-chain structure and contaminant bioaccumulation using stable nitrogen isotopes. Nature, 372 : 255-257. |
| Genner M J, Hawkins S J, Turner G F. 2003. Isotopic change through the life history of a Lake Malawi cichlid fish. J.Fish. Biol., 62 : 907-917. |
| Grey J. 2001. Ontogeny and dietary specialization in brown trout (Salmo tutta L.) from Loch Ness, Scotland, examined using stable isotopes of carbon and nitrogen. Ecol. Fresh.Fish., 10 : 168-176. |
| Guzzo M M, Haffner G D, Sorge S, Rush S A, Fisk A T. 2011.Spatial and temporal variabilities of δ15N and δ13C and δ15N within lower trophic levels of a large lake: implications for estimating trophic relationships of consumers. Hydrobiologia, 675 : 41-53. |
| Harvey C J, Hanson P C, Essington T E, Brown P B, Kitchell J F. 2002. Using bioenergetic models to predict stable isotope ratios in fishes. Can. J. Fish. Aquat. Sci., 59 : 115-124. |
| Hobson K A, Clark R G. 1992. Assessing avian diets using stable isotopes I: turnover of δ13C in tissues. Condor, 94 : 181-188. |
| Kolasinski K, Frouin P, Sallon A, Rogers K, Bruggemann H J,Potier M. 2009. Feeding ecology and ontogenetic dietary shift of yellowstripe goatfish Mulloidichthys flavolineatus (Mullidae) at Reunion Island, SW Indian Ocean. Mar.Ecol. Prog. Ser., 386 : 181-195. |
| Laegdsgaard P, Johnson C. 2001. Why do juvenile fish utilize mangrove habitats? J. Exper. Mar. Biol. Ecol., 257 : 229-253. |
| Minagawa M, Wada E. 1984. Step-wise enrichment of 15 N along food chains further evidence and the relation between 15 N and animal age. Geochim. Cosmochim., 48 : 1 135-1 140. |
| Mitchell M J, Mills E L, Idrisi N, Michener R. 1996. Stable isotopes of nitrogen and carbon in an aquatic food web recently invaded by Dreissena polymorpha (Pallas). Can.J. Fish. Aquat. Sci., 53 : 1 445-1 450. |
| Overman N C, Parrish D L. 2001. Stable isotope composition of walleye 15 N accumulation with age and area-specific differences in δ13C. Can. J. Fish. Aquat. Sci., 58 : 1 253-1 260. |
| Paine R T. 1980. Food webs: linkage, interaction strength and community infrastructure. J. Anim. Ecol., 49 : 667-685. |
| Peterson B J, Fry B. 1987. Stable isotopes in ecosystem studies. Annu. Rev. Ecol. Syst., 18 : 293-320. |
| Pinnegar J K, Polunin N V C. 1999. Differential fractionation of δ13C and δ15N among fish tissues: implications for the study of trophic interactions. Func. Ecol., 13 : 225-231. |
| Post D M, Pace M L, Hairston N Jr. 2000. Ecosystem size determines food-chain length in lakes. Nature, 405 : 1 047-1 049. |
| Post D M. 2002. Using stable isotopes to estimate trophic position: models, methods, and assumptions. Ecology, 83 : 703-718. |
| Post D M, Arrington D A, Layman C A, Takimoto G, Quattrochi J, Montaña C G. 2007. Getting to the fat of the matter: models, methods and assumptions for dealing with lipids in stable isotope analyses. Oecologia, 152 : 179-189. |
| Sun S, Huang Y P. 1993. Taihu Lake. China Ocean Publication,Beijing. (in Chinese). |
| Vander Zanden M J, Hulshof M, Ridgway M S, Rasmussen J B. 1998. Application of stable isotope techniques to trophic studies of age-0 smallmouth bass. Trans. Am.Fish. Soc., 127 : 729-739. |
| Vander Zanden M J Shuter B J, Lester N, Rasmussen J B. 1999. Patterns of food chain Length in lakes: a stable isotope study. Am. Nat., 154 : 406-416. |
| Vander Zanden M J, Vadeboncoeur Y. 2002. Fishes as integrators of benthic and pelagic food webs in lakes.Ecology, 83 : 2 152-2 161. |
| Vander Zanden M J, Vadeboncoeur Y, Chandra S. 2011. Fish reliance on littoral-benthic resources and the distribution of primary production in lakes. Ecosystem, 14 : 894-903. |
| Wang Y, Yu X, Xu J. 2011. Decreased trophic position as a function of increasing body size of a benthic omnivorous fish from the largest freshwater lake in China. Environ.Biol. Fish., 91 : 505-512. |
| Werner E E, Hall D J. 1976. Niche shifts in sunfishes: experimental evidence and significance. Science, 191 : 404-406. |
| Xu J, Xie P, Zhang M, Yang H. 2005. Variation in stable isotope signatures of seston and a zooplanktivorous fish in a eutrophic Chinese lake. Hydrobiologia, 541 : 215-220. |
| Xu J, Zhang M, Xie P. 2007. Size-related shifts in reliance on benthic and pelagic food webs by lake anchovy.Ecoscience, 14 : 170-177. |
| Zhou D, Ye J, Wang W, Liu W. 2011. Feeding habits and the relation to the size of Cultrichthys erythropterus in Meiliang Bay Lake Taihu: implication for biomanipulation and management. J. Lake. Sci., 23 (5): 796-800. (in Chinese with English abstract) |
| Zimmerman M S, Schmidt S N, Krueger C C, Vander Zanden M J, Eshenroder R L. 2009. Ontogenetic niche shifts and resource partitioning of lake trout morphotypes. Can. J.Fish. Aquat. Sci., 66 : 1 007-1 018. |
| Vadeboncoeur Y, McIntyre P B, Vander Zanden M J. 2011.Borders of biodiversity: life at the edge of the World's large lakes. BioScience, 61 (7): 526-537. |