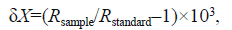
 2015, Vol. 33
Shanghai University
Article Information
- GUO Kai1, ZHAO Wen1, LI Wenkuan2, ZHAO Yuansong1, ZHANG Peng1, ZHANG Chen1_L
- Food web structure and trophic levels in polyculture ricecrab fields
- Chinese Journal of Oceanology and Limnology, 2015, 33(3): 735-740
- http://dx.doi.org/10.1007/s00343-015-4205-8
Article History
- Received Jul. 25, 2014;
- accepted in principle Sep. 9, 2014;
- accepted for publication Oct. 10, 2014


2 Freshwater Fisheries Science Institute of Liaoning Province, Liaoyang 111000, China
The river crab or Chinese mitten crab,Eriocheirsinensis(Crustacea,Decapoda,Grapsidae),iswidespread cultured in China(Wang and Zhao,1999;Yin,2008). It tests delicious and has highly nutritional,medicinal value and widely distributes. In China,crabs have been cultured in rice fields for more than30 years. Crab culture in rice fields can improve theecological environment and bring greater economicbenefi ts(Chen et al.,2001; Chen and Zhang,2002). Anumber of macrophytes and fish also occur naturallyin the rice-crab fields.
Most research on rice-crab fields in China(Li et al.,2009; Dong et al.,2010; Lu et al.,2011a,b; Dai et al.,2013),has focused on the ecology of the system,crabfeeding habits and culture techniques. However,littleis known about food web structure and trophic levelsof organisms in rice-crab fields.
Stable isotope analysis has become an importantmethod to identify the source and composition of food,and reveal food web paths and trophicrelationships between consumers and producers(DeNiro and Epstein,1978; Beaudion et al.,2001).The method has been used in many studies on foodwebs and trophic levels of natural and large-scaleaquatic ecosystems(Kim and Craig,1990; Vander and Zenand Joseph,2001; Hobson et al.,2002; Jepsen and Winemiller,2002; Hansson and Tranvik,2003;Thimdee et al.,2004; Takai et al.,2007; Vinagre et al.,2012). However,this technique has rarely been usedin the analysis of man-made,small-scale,enclosedaquatic ecosystems.
In this study,we analyzed stable carbon and nitrogen isotopes in organisms from rice-crabpolyculture fields,to identify trophic levels of allorganisms in the system,and underst and the relationship between rice(Oryzasativa) and the rivercrab(Eriocheir sinensis). The contribution of differentfood sources to the diet of E . sinensis was analyzed toinvestigate relationships among rice and crabs. Theresults of this study could be used to improve theecological environment in rice-crab fields and gaingreater economic benefi ts.2 MATERIAL AND METHOD 2.1 Sample collection
Samples for stable isotope analysis were collectedfrom the rice-crab polyculture experimental base ofFreshwater Fisheries Science Institute at Panjin(41°18′33.14′′N; 122°0′3.46′′E),in the LiaoningProvince of China. The area of each rice fi eld was0.15 ha,with a total area of 1.8 ha. Rice was plantedat a density of 1.2×10⁶ plants per ha and crabs werestocked at 2.7×10³ individuals per ha. Each crabweighed about 60 g and crab diets were supplementedwith formulated feed equating to 4% of crab weightevery day. 2.2 Sample treatment
In total,16 types of samples were collected fromrice fields. This included: eight macrophytes(Echinochloa crusgalli,Scirpus yagara,Phragmitescommunis,Polygonum hydropiper,Acorus calamus,Oenanthe javanica,Spirogyra sp.,Oryzasativa),fouranimals including the crab(Eriocheir sinensis),theoligochaete worm(Limnodrilus hoffmeisteri),and two fish species(Pseudorasbora parva and Misgurnusanguillicaudatus),zooplankton(dominant speciesDaphnia magna),sediment,suspended particulatematter(mainly consisting of phytoplankton,bacteria and humus) and formulated feed. Three to sixreplicates of each sample type were collected. Crab and two fish were collected by cage,and oligochaeteworm were picked from sediment in this rice fields.All the animal samples were anesthetized by coldshock,and stored in a refrigerator at -20°C for 24 h.
Macrophyte and animal samples were washed withdistilled water,dried at 60°C for 72 h,and then ground and passed through a 0.15 mm sieve. Samples werethen stored in glass vials at -70°C for isotope analysis.One liter water sample was collected for the analysisof suspended particulate matter and 50 L water samplewas collected for zooplankton. The zooplanktonsamples were filtered through a 64-μm mesh. Using avacuum pump,suspended particulate matter and zooplankton samples were filtered onto a Whatman™(GF/F)fiber filter,pre-combusted at 450°C for 6 h.Samples of suspended particulate matter on fiber filters were dried at 60°C for 72 h,acidifi ed(0.1 mol/L,HCl) and stored in plastic bottles at -70°C and fiber filters for zooplankton samples were acidifi ed(0.1 mol/L,HCl) and stored at -20°C. Sediments werecollected using sediment traps. Sediment sampleswere acidifi ed(0.1 mol/L,HCl),dried and ground forisotope analysis. 2.3 Stable isotope measurements
Carbon and nitrogen stable isotope ratios wereanalyzed using a mass spectrometer(Finnigan MATDelta V advantage). The mass spectrometer testaccuracy was <0.1‰ for δ13 C and <0.2‰ for δ15 N.Isotope ratios were expressed as parts per thous and (‰). Values of δ15 N results were referenced to N 2 and δ13 C to PeeDee Belemnite(PDB).
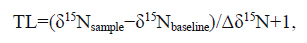
Trophic levelThe following equation was used to estimatetrophic level(TL):
Food composition
The contribution of different components of thefood web to the diet of the river crab Eriocheirsinensis and the fish Misgurnus anguillicaudatus,were analyzed using the software IsoSource(Phillips and Gregg,2003). Macrophytes,the worm(Limnodrilus hoffmeisteri),zooplankton,sediments,suspended particulate matter,formulated feed,and dead fish were used for calculating the food sourcesof the crab. The worm(Limnodrilus hoffmeisteri),zooplankton,sediments,formulated feed and crabwere used for calculating the food sources of the fish.3 RESULT
3.1 Carbon and nitrogen stable isotopes in ricecrab fields
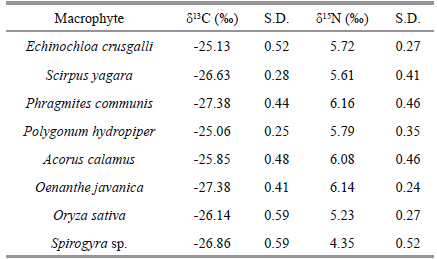
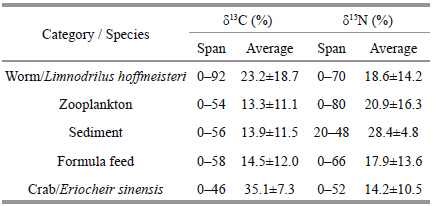
Stable isotope values in samples from rice-crabfields ranged from -27.38‰±0.44‰ to -18.34‰±0.26‰ for δ13 C and from 1.10‰±0.88‰ to 9.33‰±0.57‰ for δ15 N. Values for both isotopes were highlyvariable. The δ13 C and δ15 N values for the fishPseudorasbora parva were higher than those of allother organisms. The lowest δ13 C values were for themacrophytes,Oenanthe javanica and Phragmitescommunis . The lowest δ15 N value was for sediments(Fig. 1). The stable isotope values for the eightmacrophytes tested ranged from -27.38‰±0.44‰ to-25.06‰±0.25‰ for δ13 C and from 4.35‰±0.52‰ to6.16‰±0.46‰ for δ15 N. The mean δ13 C and δ15 Nvalues for macrophytes were -26.30‰±0.45‰ and 5.64‰±0.37‰,respectively(Table 1).
 |
| Fig. 1 Stable isotope δ13 C and δ15 N values(mean±SD)ofnine different types of samples from the rice-crabecosystem |
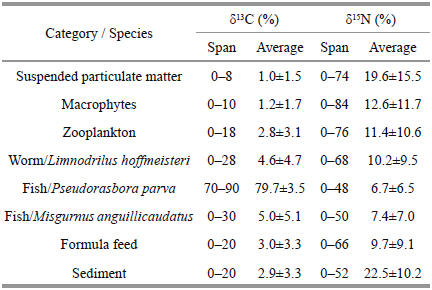
The omnivorous river crab,Eriocheir sinensis,isthe main aquaculture species in polyculture rice-crabfields. The diet of these crabs may includemacrophytes,the worm(Limnodrilus hoffmeisteri),zooplankton,sediments,suspended particulate matter,formulated feed,and dead fish. The contribution ofeach of these potential food sources in the diet ofcrabs was analyzed using the software IsoSource. Ithad been proved that there are limitations to using asingle stable isotope to identify the dominant nutrientpathways of animals(Kim and Craig,1990),in thisstudy,using two isotopes to calculate the foodcontributions to the crab and fish. The δ13 C resultsindicated that the fish P . parva made the largest contribution to the diet of E . sinensis(79.7%). Basedon δ15 N values,most of the food sources testedcontributed more than 10% to the diet of E . sinensis(Table 2). These values appear to correspond withother studies on crab diet(Yin et al.,2008),but wealso found that formulated feed form only a small partof the crab’s diet,and the worm(L . hoffmeisteri),formulated feed,zooplankton and sediments made alarger contribution to the diet of the groundfish,M . anguillicaudatus(Table 3)than to the diet of thecrab,E . sinensis(Table 2).
 |
 |
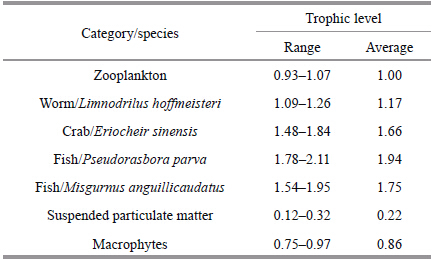
The trophic level of primary producers is 0,zooplankton is specifi ed as the baseline,and the δ15 Ntrophic enrichment factor is 3.4‰(Post,2002). Therewere three trophic levels identifi ed in samples frompolyculture rice-crab fields(levels 0–2). The two fishspecies,P . parva and M . anguillicaudatus,the wormL . hoffmeisteri,and the crab E . sinensis were at level2. Zooplankton were at trophic level 1,and themacrophytes and suspended particulate matter wereat level 0(Table 4).
Stable carbon and nitrogen isotopes of samplescollected from the rice-crab system varied widely;however there was a trend for values of δ13 C and δ15 Nto increase in samples from higher trophic levels.Phytoplankton and macrophytes primarily use 1212during photosynthesis,leading to low δ13 C values inprimary producers. Values of δ13 C and δ15 N were highin omnivores compared with macrophytes. Typically,energy is transferred from suspended particulatematter to zooplankton to omnivores in aquaticecosystems. Consistent with other studies(Hansson et al.,1997; Yang et al.,2012),the Δδ15 N value was2.65‰ between suspended particulate matter and zooplankton and 2.66‰ between zooplankton and omnivores,indicating that enrichment of δ15 N wasrelatively stable compared with δ13 C. Average δ13 C and δ15 N values for the eight macrophytes in thissystem were -26.30‰±0.45‰ and 5.64‰±0.37‰,respectively. The δ13 C and δ15 N values for themacrophytes and suspended particulate matter werelower than other organisms,the reason was that primary use of the 1212 of phytoplankton and macrophytes during photosynthesis leads to low δ13 Cvalues in phytoplankton(Leggett et al.,1999). Inaquatic ecosystem,macro- algae and micro-algaeshowed quite different δ13 C values due to thedifference in the CO2 absorption effi ciency and theresulted difference in the 13 C fractionation. The δ13 C and δ15 N values for the macrophytes in this studyvaried widely,and some macrphyte species showedso low δ13 C value,even lower than suspendedparticulate matter. Macrophytes typically have a widerange in stable isotope values(McMillan et al.,1980),the Δδ13 C values in this study were more than 2‰ and Δδ15 N values were 1.8‰.4.2 Trophic structure analysis
Research has indicated that the accumulation ofstable nitrogen isotopes rises at each trophic level by3‰ to 5‰ and therefore stable nitrogen isotopes canbe used to calculate trophic levels in ecosystems(Peterson and Fry,1987). Our results indicate thatthere are three trophic levels(levels 0–2)in the bioticcommunity of the rice-crab culture system. The crab(E . sinensis),worm(L . hoffmeisteri) and fish species(P . parva and M . anguillicaudatus)were at level 2.Yang et al.(2012)found that organisms at the secondlevel include herbivores(trophic level 1.0–1.3)whichfeed mainly on macrophytes and organic detritus,and omnivores(trophic level 1.4–1.9)which mainly feedon herbivores,macrophytes and organic detritus. Ourresults indicate that the worm,L . hoffmeisteri is aherbivore,while the crab,E . sinensis and two fishspecies,P . parva and M . anguillicaudatus areomnivores.4.3 Nutrient pathways
Stable isotope analysis has been used as a tool toidentify trophic relationships between consumers and producers(Vander Zandenand Joseph,2001; Hansson and Tranvik,2003; Thimdee et al.,2004),but thereare limitations to using a single stable isotope toidentify the dominant nutrient pathways of animals(Kim and Craig,1990). Different food items wereidentifi ed as being dominant in the diet of the crab(E . sinensis)using δ13 C and δ15 N values. The crab(E . sinensis) and two fish(P . parva and M . anguillicaudatus)in the rice-crab system areomnivores,and all occupy the same trophic level.These animals feed selectivity,but also consumesome food incidentally. The relationship between producers and consumers is not simply linear,butforms a complex network,and the degree of δ13 Cenrichment is variable. Using δ15 N values,our analysisindicated that most of the food sources analyzedcontributed more than 10% to the diet of the crab,which is consistent with previous research(Yin,2008). Yin found that the diet of E . sinensis includesomnivores,hydrophytes,zoobenthos,organic detritus and dead animals(Yin,2008). 4.4 Symbiotic relationships among rice and crab
Our results indicate that macrophytes are part ofthe diet of the crab,E . sinensis,which suggests thatrice may also be part of the crab’s diet. If the dailyfeeding rate of crabs is 4%,the contribution of rice tocrabs is 12.6%,the number of crabs stocked is 162 kg/ha; the crabs are consuming the total amount of rice(wet weigh of tstem or leaf)is approximately 0.82 kg/(ha·d). To ensure that rice crops are not destroyed bycrabs,an appropriate interval between rice planting and crab stocking is necessary. Crabs in this systemmay also eat weeds,is benefi cial as it reducescompetition between rice and weeds for space and nutrition,and it is known that the crab formulatedfeed added to rice fields also has a positive effect onthe growth of rice,there are a mutualistic relationshipamong rice and crabs in this system.
In this study,we found that formulated feed hadnot made a larger contribution to the diet of E .sinensis,and excess formulated feed added to therice-crab system sinks to the bottom of fi eld,whichmay lead to water pollution. Based on our fi ndings,the amount of formulated feed added to the rice fieldscould be adjusted,reduce the cost of feeding and improve the water quality by decreasing the quantitiesof formula feed. In addition,increasing the stockedamount of bottom feeding fish such as Misgurnusanguillicaudatus could improve the use of addedfeed,and resulting in economic and ecologicalbenefi ts. Crabs and fish benefi t the rice fields bycontrolling weeds and pests and by loosening the soil,while excess formulated feed and the feces of crabs and fish promote rice growth.5 CONCLUSION
Most of the food sources tested contributed morethan 10% to the diet of E . sinensis,but we also foundthat formulated feed form only a small part of thecrab’s diet,and the worm(L . hoffmeisteri),formulatedfeed,zooplankton and sediments made a largercontribution to the diet of the ground fish,M . anguillicaudatus than to the diet of the crab,E . sinensis,the amount of formulated feed added tothe rice fields could be adjusted,and stocking bottomfeeding fish such as Misgurnus anguillicaudatuscould improve the use of added feed. There were onlythree trophic levels in polyculture rice-crab fields.
| Beaudion C P, Prepas E E, Tonn W M. 2001. A stable carbon and nitrogen isotope study of lake food webs in Canada's Borcal Plain. Freshw ater Biol ogy, 46 : 465-477. |
| Chen F X, Zhang Z J. 2002. Ecological economic analysis of a rice-crab model. The J ournal of A pplied E cology, 13 (3): 323-326. (in Chinese with English abstract) |
| Chen L S, Wang W, Chen Z Z. 2001. Culture tendency of Eriocheir sinensis by mark analysis. Journal of Shanghai Fisheries University, 10 (1): 81-85. (in Chinese with English abstract) |
| Dai H X, Li Y S, Ma X Z, Wang W, Zhu X Y, Li Z J. 2013. The research of dissolved oxygen distribution in the crab ecological culture ponds. Journal of Shanghai Fisheries University, 22 (1): 66-73. (in Chinese with English abstract) |
| DeNiro M J, Epstein S. 1978. Influence of diet on the distribution of carbon isotopes in animals. Geochimica e Cosmochimica Acta, 42 (5): 495-506. |
| Dong Y, Jiang H W, Yu Y Q, Zhou S X, Sun B. 2010.Characteristics of water-temperature of rice field crab “Panshan mode”. Journal of Anhui Agricultural Sciences, 38 (23): 12 483-12485. (in Chinese with English abstract) |
| Hansson L A, Tranvik L J. 2003. Food webs in sub-Antarctic lakes: a stable isotope approach. Polar Biology, 26 (12): 783-788. |
| Hansson S, Hobbie J E, Elmgren R, Larsson U, Fry B,Johansson S. 1997. The stable nitrogen isotope ratio as a marker of food-web interactions and fish migration.Ecology, 78 (7): 2 249-2 257. |
| Hobson K A, Fiskb A, Karnovskyc N A. 2002. A stable isotope (13C,15N) model for the North Water food web: implications for evaluating trophodynamics and the flow of energy and contaminants. Deep Sea Research, 49 : 5 131-5 150. |
| Jepsen D R, Winemiller K O. 2002. Structure of tropical river food webs revealed by stable isotope ratios. Oikos, 96 : 46-55. |
| Kim K R, Craig H. 1990. Two-isotope characterization of N 2 O in the Pacific Ocean and constraints on its origin in deep water. Nature, 347 (6288): 58-60. |
| Leggett M, Servos M, Hesslein R, Johannsson O, Millard E,Dixon D. 1999. Biogeochemical influences on the carbon isotope signatures of Lake Ontario biota. Can adian J ournal of Fish eries and Aquat ic Sci ences, 56 : 2 211-2 218. |
| Li W K, Xiao Z G, Zhao X L, Yu Y Q, Jiang H, Sun Z S. 2009.Effect of initial size and stocking density on growth and yield of chinese mitten-handed crab eriocheir sinensis in rice fields. Fisheries Science, 28 (1): 36-39. (in Chinese with English abstract) |
| Lu D F, Wang W, Ma X Z, Chen Z Z, Bai G F, Chen W X, Yu Y Q. 2011a. Selectivity of Chinese mitten-handed crab for major weeds in the northern paddy fields. Journal of Dalian Ocean University, 26 (2): 188-192. (in Chinese with English abstract) |
| Lu D F, Wang W, Ma X Z, Wang Q, Wang A, Chen Z Z, Tang S Q. 2011b. Ecological prevention and control of weeds in rice-crab polycultured fields. Hubei Agricultural Sciences, 50 (8): 1 574-1 578. (in Chinese with English abstract) |
| McMillan C, Parker P L, Fry B. 1980.13C/ 12C ratios in seagrasses. Aquatic Botany, 9 : 237-249. |
| Morato T, Sola E, Grós M, Menezes G. 2003. Diets of thornback ray (Raja clavata) and tope shark (Galeorhinus galeus) in the bottom longline fishery of the Azores, northeastern Atlantic. Fishery Bulletin, 101 (3): 590-602. |
| Peterson B J, Fry B. 1987. Stable isotopes in ecosystem studies. Annual Review of Ecology and Systematics, 18 : 293-320. |
| Phillips D L, Gregg J W. 2003. Source partitioning using stable isotopes: coping with too many sources. Oecologia, 136 : 261-269. |
| Post D M. 2002. Using stable isotopes to estimate trophic position: models, methods, and assumptions. Ecology, 83 : 703-718. |
| Takai N, Hirose N, Osawa T, Hagiwara K, Kojima T, Okazaki Y, Kuwae T, Taniuchi T, Yoshihara K. 2007. Carbon source and trophic position of pelagic fish in coastal waters of south-eastern Izu Peninsula, Japan, identified by stable isotope analysis. Fisheries Science, 73 (3): 593-608. |
| Thimdee W, Deein G, Sangrungruang C. 2004. Analysis of primary food sources and trophic relationships of aquatic animals in a mangrove-fringed estuary, Khung Krabaen Bay (Thailand) using dual stable isotope techniques.Wetlands Ecology and Management, 12 : 135-144. |
| Vander Zanden M J, Joseph B R. 2001. Variation in the d 15 N and d13C trophic fractionation: implications for aquatic food web studies. Limnol ogy and Oceanogr aphy, 46 : 2 061-2 066. |
| Vinagre C, MÁguas C, Cabral H, Costa M. 2012. Food web structure of the coastal area adjacent to the Tagus estuary revealed by stable isotope analysis. Journal of Sea Research, 67 (1): 21-26. |
| Wang Y P, Zhao N G. 1999. The culture of Chinese mitten crab and the prospect of its development. Acta Hydrobiologica Sinica, 23 (6): 735-740. (in Chinese with English abstract) |
| Yang G H, Sun X L, Hou X Q, Chen C L. 2012. Measurement of the trophic level of fish in a coral reef ecosystem using stable isotopes. Journal of Fishery Sciences of China, 19 (1): 105-115. (in Chinese with English abstract) |
| Yin S R. 2008. Aquatic Animals and Human Health. China Agriculture Press, Beijing, China. (in Chinese with English abstract) |