Shanghai University
Article Information
- LI Ang (李昂), YU Fei (于非), DIAO Xinyuan (刁新源)
- Interannual salinity variability of the Northern Yellow Sea Cold Water Mass
- Chinese Journal of Oceanology and Limnology, 2015, 33(3): 779-789
- http://dx.doi.org/10.1007/s00343-015-4210-y
Article History
- Received Aug. 1, 2014;
- accepted in principle Sep. 30, 2014;
- accepted for publication Oct. 21, 2014
2 University of Chinese Academy of Sciences, Beijing 100049, China
The Yellow Sea(YS)is located at 31°40′–39°50′N,119°10′–126°50′E,between the Chinese mainl and and the Korean Peninsula. It is a semi-closed shallow sea shaped like a reverse “S”. The northwestern YS is linked with the Bohai Sea through the Bohai Strait, and the southern YS opens to the East China Sea. The mean depth of the YS is 44 m and the maximum depth is 140 m. A long and narrow depression,known as the YS Trough,is located at the center of the YS between 34°–38°N and 124°–125°E. A line from Chengshantou of the Sh and ong Peninsula to Jangsan of the Korean Peninsula divides the YS into a northern and southern section. With a mean depth of 38 m,the northern YS is shaped like a parallelogram basin that is flat in the center and inclines to the south. Because of the influence of the East Asian Monsoon,the north wind prevails in the winter and the south wind prevails in the summer over the YS area.
The Yellow Sea Cold Water Mass(YSCWM)is one of the prominent oceanographic phenomena in the YS. The two centers of the YSCWM are the Northern Yellow Sea Cold Water Mass(NYSCWM) and the Southern Yellow Sea Cold Water Mass(SYSCWM)(Tang,2005). With low temperature and high salinity,the YSCWM has a stronger temperature and salinity front in the YS, and usually occupies the deep and bottom layers of the trough of the central YS. The YSCWM has a great impact on the distribution of the biocenose and the acquisition of fishery resources(Du et al., 1996; Wang et al., 2003; Zhang et al., 2007).
The YSCWM has clear seasonal variability based on in-situ observations and numerical simulations. With the seasonal change of the thermocline,the YSCWM forms in the spring(approximately in May),matures in the summer(approximately in August),recedes in the autumn, and completely disappears in winter(Guan,1963; Chu et al., 1997; Yu et al., 2006; Zhang et al., 2008; Bao et al., 2009; Yao et al., 2012). During the cooler season(from September to February),changes in the heat content of the YS are caused by variations in latent and sensible heat fluxes at the surface,which are related to the East Asian Winter Monsoon and the Arctic Oscillation(Wei et al., 2013). In the early 1950s,He et al.(1959)first studied the formation mechanism and characteristics of the YSCWM concluding that the YSCWM forms in the local area of the YS in winter. The formation of the seasonal thermocline is an important mechanism for YSCWM(Yu et al., 2006)with numerical simulations also showing similar results(Ren and Zhan, 2005). Hur et al.(1999)found that surface cooling and strong mixing in winter is significant in the formation of the YSCWM. Moreover,tidal mixing(Zhao,1986; Lee and Beardsley, 1999)forms a strong temperature and salinity front between the YSCWM and coastal water.
Alongside the seasonal variation in the YS,there is also interannual variability. Because of the limited data availability,SST data are commonly used to analyze the interannual variability of the YS. Zhang et al.(2009)found a 5-year cyclicity in the SST of the Bohai Sea,YS, and the East China Sea,which is mainly influenced by the interannual variability of the East Asian Monsoon. Park and Oh(2000)also found a 5–6-year period of variation of the East Asian Marginal Sea, and the 2–3-year variability of the East Asian Marginal Sea SST is consistent with that of SSTa in the Niño 3.4 with a phase lag of 5–9 months. The SST of the China Sea has a warming trend,which is more obvious in winter. The China Sea has become much warmer since the mid-1980s(Meng et al., 2011). The temperature increase in the YS is consistent with the recent climate warming in northern China and the adjacent seas(Lin et al., 2005).
The distribution range(Weng et al., 1988; Song et al., 2009),position of the low temperature center,temperature, and salinity of the YSCWM all have interannual variability and could therefore be used to represent the strength of the YSCWM(Zhang and Yang, 1996). Using in-situ observations and numerical simulations,most oceanographers have tended to study the temperature variability of the YSCWM. Analyzing the Korea Oceanographic Data Center(KODC)dataset and climate signals,Park et al.(2011)attributed the interannual temperature variation of the SYSCWM to winter forcing,including the Siberian High,Aleutian Low,East Asian Jet Stream,Pacific Decadal Oscillation, and Arctic Oscillation. They also maintained that summer forcing could intensify the temperature anomaly of the SYSCWM,for example,the SST of the Kuroshio and sea level pressure over the Asian continent. Empirical orthogonal function(EOF)analysis results have shown that the position and intensity of the thermocline over the SYSCWM have interannual variability that is mainly caused by surface heating(Hu and Wang, 2004). In most El Niño years,the thermocline dome shifts eastward and the thermocline is at a shallower depth(Bai et al., 2004). Li(1991)pointed out that the YSCWM is in a warm phase in the year following a large me and er of the Kuroshio, and in a cold phase when El Niño events occur. However,some studies have concluded that the temperature of the SYSCWM is not directly related to El Niño(Jia and Sun, 2002; Bai et al., 2004). Furthermore,winter process plays an important role in the interannual variability of the YSCWM. Wei et al.(2013)found that the heat content of the deep region of the YS is mainly influenced by lateral heat transport controlled by the Yellow Sea Warm Current(YSWC),which also has a 4–7-year period of interannual variability(Wang et al., 2009).
Compared with the number of studies on the interannual temperature variability of the YSCWM,there is less research on the interannual salinity variability of the northern YS and further work is therefore urgently needed. Lv et al.(2009)found that the winter salinity of the northern YS at 0,10, and 20 m depth has showed an increasing trend since the 1950s. Ma et al.(2006)found that the mean salinity of the Dalian-Chengshantou section is increasing. Jiang et al.(2007)analyzed the bottom salinity of a station at the center of the Dalian-Chengshantou section and found no clear salinity changes in the NYSCWM. Wei et al.(2010)found that interannual changes in the summer bottom temperature and salinity correspond to the temperature and salinity changes of the YSWC in winter.
Compared with previous work,in this paper we focus on the interannual salinity variations in the core areas of the NYSCWM and the factors that influence the water mass in winter. Furthermore,we use the mean status of the NYSCWM center salinity to describe the interannual variability of the NYSCWM because the mean status has a better conservative property. In Section 2,we introduce the data used in this study. In Section 3,we discuss the changing characteristics of NYSCWM salinity,including mean salinity,the southern salinity front,the halocline, and influencing factors. Section 4 summarizes the interannual properties of NYSCWM salinity and the main factors that influence it,as found in this study. 2 DATA
We have applied the following data in this work:
(1)1976–2006 national st and ard section survey data: the Dalian-Chengshantou(DC) and the 36°N sections. These data were obtained and maintained by the State Oceanic Administration of China. The stations included in these sections are shown in Fig. 1. Summer(August)data are missing for 1993, and winter(February)is missing for 1976,1984, and 1996. The horizontal resolution of the data is approximately 25 km. The resolution of the 36°N section is 0.25° near the coast and 0.5° near the center of the YS. The vertical data levels are 0,5,10,15,20,25,30,35,50,75 m, and the bottom level;
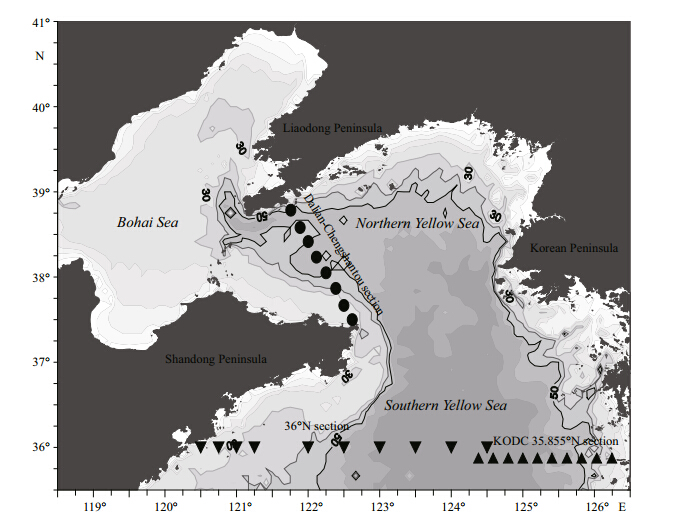 |
| Fig. 1 Location of survey stations
Circles: DC section; triangles: 35.855°N section; inverted triangles: 36°N section; and shading: depth of water. |
(2)1976–2006 KODC survey data at the 35.855°N section. The station positions are indicated in Fig. 1. The horizontal resolution of the data is approximately 0.21°. The vertical data levels are 0,10,20,30,50, and 75 m. No summer(August)or winter(February)data are missing. These data can be downloaded at http://kodc.nfrdi.re.kr;
(3)1979–2006 evaporation minus precipitation rate data from the European Centre for MediumRange Weather Forecasts(ECMWF)(Dee et al., 2011). The data were downloaded from http://www.filewatcher.com/b/ftp/ftp.cgd.ucar.edu/archive/BUDGETS/ ERAI-0.html. The data cover 37°–40°N and 121.5°–126°E, and were used to represent the E-P flux of the northern YS. The horizontal resolution of the data is approximately 0.7° and the temporal resolution is one month;
(4)1975–2006 International Comprehensive Ocean-Atmosphere Data Set(ICOADS)meridional wind speed data of the northern YS area(121°–129°E,35°–41°N). The horizontal resolution of the data is 1°×1°, and the temporal resolution is one month. The data were downloaded from http://icoads.noaa.gov/. 3 RESULT AND DISCUSSION 3.1 Salinity variation of the NYSCWM
Because of the changing shape of the NYSCWM center,we selected the mean value of the 10 highest salinity data points to represent the mean salinity of the NYSCWM center,as the high salinity center can represent the characteristics of the NYSCWM center. We sorted the DC section salinity data of each year in a descending order and selected the first 10 points to calculate the mean value. The NYSCWM salinity is always higher than that of the coastal water mass; therefore,the 10 highest salinity points are always in the central area of the NYSCWM. Figure 2 shows the positions of the 10 highest salinity points in 1977,1989, and 1994. The 10 points mainly occupied the high salinity center during these years.
The variation of the mean salinity of the NYSCWM center is shown in Fig. 3. The lowest mean salinity of 31.61 occurred in 1991, and the highest mean salinity of 32.43 in 1984 and 2002. Linear trend analysis shows that the mean salinity of the NYSCWM center has a slight decreasing trend of 1.4×10⁻³per year.
 |
| Fig. 2 Positions of the 10 highest salinity points(squares)in the DC section in(a)1994,(b)1989, and (c)1977; and salinity of the DC section(shading)in(a)1994,(b)1989, and (c)1977 |
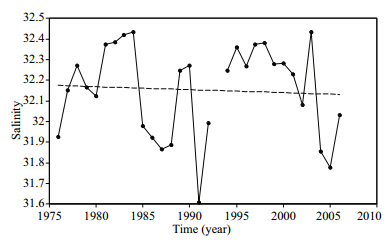 |
| Fig. 3 Mean salinity of the DC section center in summer(solid line with circles) and its linear trend(/a,dashed line) |
To further study the declining trend of the mean salinity of the center,the linear trends of the time series of all the DC section data points were calculated(Fig. 4). Because of the influence of the coastal and surface waters,the salinity of the southern and northern boundaries and the surface area of the section show increasing trends. This ascending trend in the surface salinity of this area has also been found in other studies(Lin et al., 2001; Ma et al., 2006; Lv et al., 2009), and Wu et al.(2004)concluded that the sustained and rapid reduction of Huanghe River runoff is a primary reason for the salinity increase in the Bohai Sea. The DC section is located close to the Bohai Sea and water mass exchange can bring salinity out of the Bohai Sea. Therefore,salinity increases in the Bohai Sea may affect the surface salinity of the DC section to some extent. The area of decreasing salinity occupies most of the high salinity center where the value may decrease to less than -0.005 per year. This result explains the slight decline of the mean salinity of the center. However,the center of decreasing salinity is not fully consistent with the center of high salinity. The trend in the southern part of the high salinity center(south of 38.4°N)is declining,while the trend in the northern section of the high salinity center(north of 38.4°N)is increasing. The northern area may be affected by surface layer salinity through mixing or water mass exchange. Furthermore,the increasing salinity at the northern boundary(near 38.7°N)may become greater than 0.015 per year,which is the highest increasing trend found in the DC section(Fig. 4).
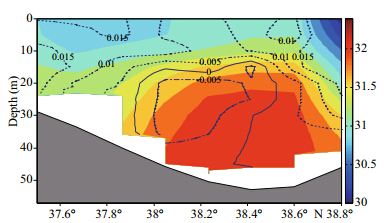 |
| Fig. 4 Mean salinity(shading) and the linear salinity trend(/a,contours)of the DC section in summer from 1976 to 2006 |
Based on 31 years of salinity data along the DC section,the first two modes of the EOF analysis are shown in Fig. 5. The missing data(1993)are replaced by the mean values of the data of the previous(1992) and the following(1994)years. These account for approximately 73% of the total variance with variances of 62% and 11%,respectively. The first mode shows the mean distribution of the salinity in the DC section. Along with the time series of the first EOF mode(Fig. 5b),this indicates that the increasing trend of the surface salinity occurs mainly at the upper level. The second mode has a maximum value in the northern surface level,which indicates increasing salinity at the northern boundary(Fig. 5c). This may result from increasing salinity in the northern surface layer water. Nevertheless,the largest part of this mode is negative. The negative center of the mode is in a similar position to the declining salinity center; therefore,the negative center may show the declining salinity to some degree. The increasing salinity of the surface and coastal waters is shown by the first mode, and the decreasing salinity of the NYSCWM is shown by the second mode. The two modes jointly result in the linear trend of the DC section salinity(Fig. 4). The EOF analysis results show that the salinity variation tendency of the coastal and surface waters is clearer than that of the NYSCWM. The salinity difference between the NYSCWM and the coastal water would decrease with this trend.
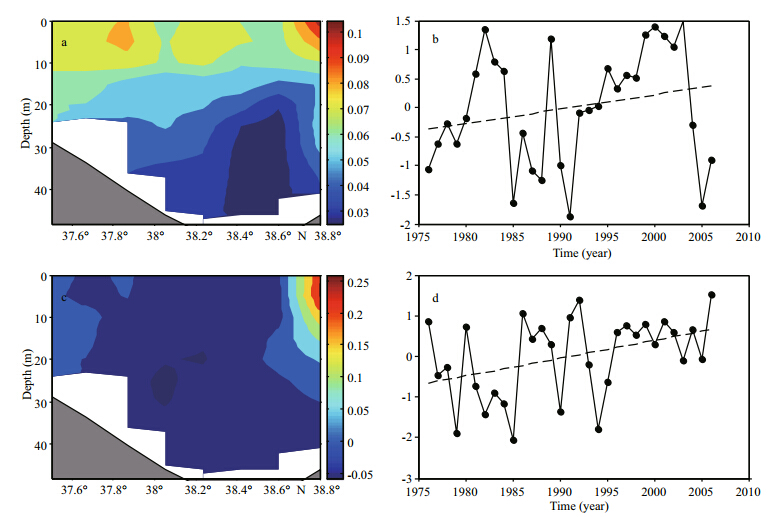 |
| Fig. 5 a and c. the spatial distribution of the first two EOF modes; b and d. time series(solid line with solid dots) and its linear trend(/a,dashed line)of the summer salinity of the Dalian-Chengshantou section |
The marine front represents the interface of two water masses. We calculated the maximum horizontal salinity gradient south of the salinity center where the salinity reaches its peak value(Fig. 6). The position where the highest salinity occurs can be taken as the salinity center. The maximum horizontal gradient was chosen from all gradient values in the area that range from the southern boundary of the DC section to the salinity center position in each year. This value shows the strength of the southern salinity front of the NYSCWM, and the salinity difference between the NYSCWM and the southern coastal water. The strongest front appeared in 1979 and 1981, and the weakest in 2006,with variability up to -2×10⁻⁴/km per year. The weakening southern salinity front demonstrates that the salinity difference between the NYSCWM and the coastal water mass south of the NYSCWM decreases.
 |
| Fig. 6 Maximum horizontal salinity gradient(/km)of stations south of the salinity center in summer from 1976 to 2006(solid line with dots) and its linear trend(/km/a,dashed line) |
The halocline strength represented by the highest vertical salinity gradient of the center survey station,at which the highest salinity occurs,is shown in Fig. 7. Higher values occurred in 1978 and 1996, and weaker haloclines appeared in 1982,1989, and 2001. Furthermore,the vertical gradient has become relatively weaker since 1998 by 2.5×10-3/m per year.
 |
| Fig. 7 Maximum vertical salinity gradient(/m)of the center station where the maximum salinity appeared in the summer from 1976 to 2006(solid line with dots) and its linear trend(/m/a,dashed line) |
The trend of the halocline strength also illustrates that the surface salinity is getting closer to NYSCWM salinity.
The trends of the southern front and the halocline also show that the salinity difference between the NYSCWM and the surrounding water mass is reducing. 3.4 Variation of winter salinity
The NYSCWM has a local water mass during winter,which remains at the bottom of the northern YS(He et al., 1959). This local winter water mass may influence the NYSCWM in the summer. The water at the center of northern YS can be seen as the source of the NYSCWM. Therefore,the salinity of the northern YS in winter is very important for researching the variability of NYSCWM salinity. We chose data from February to represent the winter conditions and data from August to show the summer conditions over a year. Therefore,winter occurs before summer in each year of data. We calculated the linear trends of the DC section salinity data points(Fig. 8). Apart from the southern coastal area,the salinity of the majority of the DC section has a declining trend of 0.005–0.01 per year. The decreasing trend in winter from 38.1°N to 38.4°N is similar to the salinity trend of the NYSCWM from 38.1°N to 38.4°N below 15 m(with a declining trend of 0.005 per year)during summer(Fig. 4). We also applied EOF analysis to the salinity of the DC section in winter to identify the spatiotemporal variability of the winter salinity of the northern YS. The missing data(1976,1984,1996)were replaced by the mean values of the data of the preceding(1975,983,1995) and the following(1975,1983,1995)years. The first mode accounts for 70% of the salinity variability(Fig. 9a & b). This shows that the variability of the coastal water mass is greater than that of the water mass at the center of the northern YS. The second mode(17%)presents a dipole pattern(Fig. 9c)showing that the southern coastal water has a trend opposite to the central water of the northern YS. The negative value of the second mode north of 38°N(Fig. 9c) and the rising time series of the second mode(Fig. 9d)show that the salinity of the DC section north of 38°N has a decreasing trend in winter. The salinity decrease is evident mainly at the second mode. To further study the winter salinity of the northern YS,the mean value of the highest 10 salinity data points(using the same selection as for the summer data)was calculated,which may identify the high salinity area in this section. The mean salinity of the high salinity area in winter is significantly correlated with the mean salinity of the center of the NYSCWM,with a correlation coefficient of 0.81(Fig. 10). The lowest salinity occurred in 1991. In the correlation analysis,the missing data are replaced with the mean values of the data of the previous and the following years. Similar to the summer situation,the winter mean salinity also shows a decreasing trend with a declining rate of 7.0×10⁻³per year. The high correlation and similar decreasing trend demonstrate the good conservative properties of the NYSCWM. The second EOF mode,the linear trend of the DC section salinity, and the mean value of the high salinity center all show the declining trend of the center water salinity of the northern YS in winter.
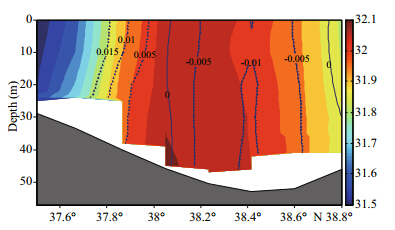 |
| Fig. 8 Mean salinity(shading) and linear salinity trend(contours,/a)of the DC section in winter from 1976 to 2006 |
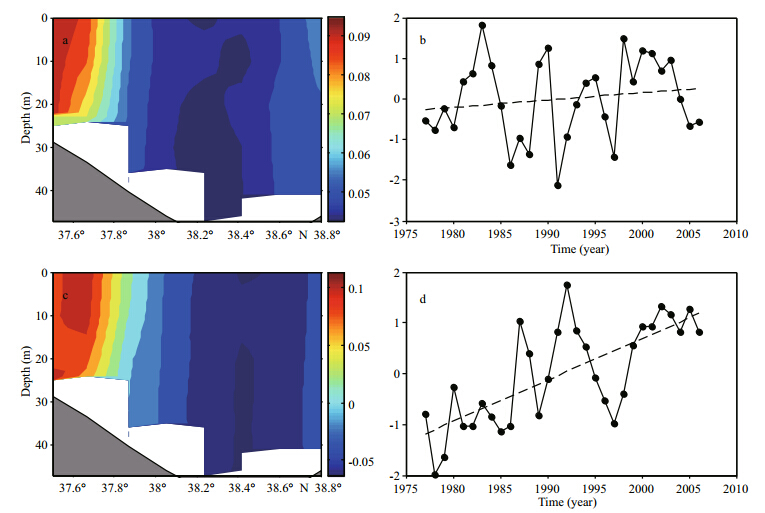 |
| Fig. 9 a and c. the spatial distribution of the first two EOF modes; b and d. time series(solid line with solid dots) and its linear trend(/a,dashed line)of the winter salinity of the Dalian-Chengshantou section |
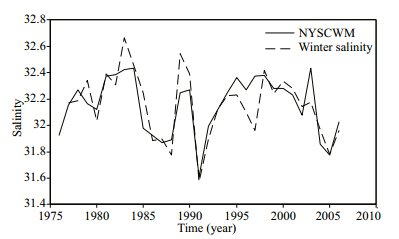 |
| Fig. 10 Mean salinity of the DC section center in summer(solid line) and winter(dashed line) |
The difference between NYSCWM salinity in summer and the winter salinity of the northern YS is very small(Fig. 10). The salinity of NYSCWM has good conservative properties; therefore,the winter processes are significant for the salinity conditions of the following summer. The YSWC matures in winter and is the only high salinity input from the Pacific to the YS. Therefore,the salinity input of the YSWC may be a significant factor influencing the NYSCWM. The 35.855°N section of the KODC salinity data and the 36°N section of the national st and ard section survey data were used to show the salinity of the YSWC because the high salinity tongue in the southern YS can indicate the salinity of the YSWC to some degree. We calculated the mean value of the 10 highest salinity data points of the 35.855°N(Fig. 11,dashed-dotted line) and 36°N(Fig. 11,dashed line)sections to represent the high salinity tongue of the YSWC each year. The mean values of these two sections indicate descending trends. The high salinity mean value of the 36°N section declines by 3.3×10 -3per year and the high salinity mean value of the 35.855°N section decreases by 8.6×10⁻³per year. This may indicate that the salinity of the water mass brought by the YSWC decreases. Further research is needed to underst and whether the strength of the YSWC becomes stronger or weaker. YSWC is a significant salinity input for the northern YS; the declining salinity trend could therefore affect the salinity variation of the NYSCWM. This trend may be a reason for the decline in the salinity of the NYSCWM. These two values show good correlation with the mean salinity of the central NYSCWM during summer(Fig. 11,solid line). The correlation coefficients for the 36°N and 35.855°N high salinity mean values are 0.58 and 0.42,respectively,with a confidence of 95%. Furthermore,the correlation analysis using the time series of the DC section data points shows similar results(Fig. 12). The high correlation coefficients of these two sections appear at the bottom of the salinity center, and the maximum values are greater than 0.45(Fig. 12a) and 0.4(Fig. 12b),respectively. Therefore,the strength of the YSWC in winter will influence the salinity of the NYSCWM by changing the salinity input of the northern YS in the previous winter.
 |
| Fig. 11 Mean salinity of the DC section center in summer(solid line), and mean salinity of the 36°N(dashed line) and 35.855°N(dashed-dotted line)section centers in winter |
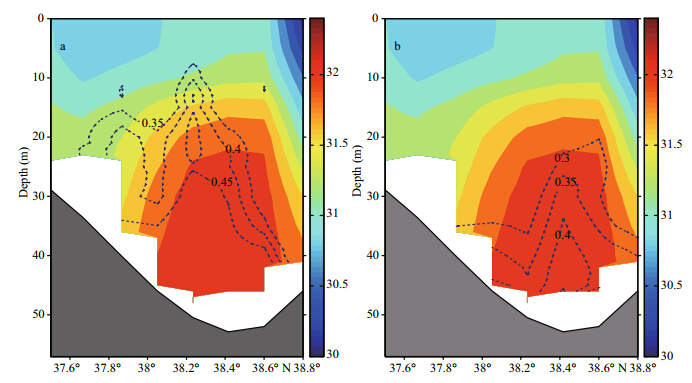 |
| Fig. 12 Mean salinity of the DC section(shading)in summer, and the correlation coefficients of the DC section with mean salinity of(a)the 36°N(contours) and (b)the 35.855°N(contours)section centers in winter from 1976 to 2006 |
The Northern YS is affected in winter by the local wind field, and thus the winter monsoon may correlate with the salinity of the NYSCWM. In this paper,the normalized mean meridional wind speed in winter(December,January, and February)of the northern YS(121°–129°E,35°–41°N)is calculated to describe the winter monsoon conditions in this area(Fig. 13,dashed line). The correlation coefficient between the mean meridional wind in winter and the mean salinity of the NYSCWM center is -0.37,with a confidence level of 0.95. This indicates that the stronger the north wind,the higher the salinity of the NYSCWM. The northerly wind in winter causes the sea surface height of the northern YS to decline, and the gradient of the sea surface level from south to north drives the YSWC to flow into the northern YS(Zhao et al., 2011). A stronger YSWC brings more salinity; therefore,the northerly wind component of the winter monsoon can be an influence on the NYSCWM salinity.
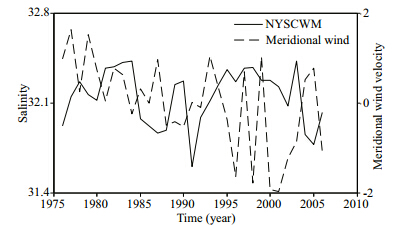 |
| Fig. 13 Mean salinity of the DC section center in summer(solid line) and normalized mean meridional wind speed(m/s)of the northern YS(121°–129°E,35°–41°N)from December to February(dashed line) |
Besides the YSWC and the winter monsoon,there is also a link between the E-P flux and NYSCWM salinity. The monthly mean of the evaporation minus the precipitation rate is used to represent the E-P flux of the northern YS. The total value of the evaporation minus the precipitation rate of each year from 1979 to 2005 was calculated, and then normalized for use in correlation analysis. The correlation coefficient of the total evaporation minus the precipitation rate of the previous year with the average of the high salinity center in summer can reach 0.64(Fig. 14,dashed line). This indicates that the E-P flux signal in the previous year accumulates at the surface level of the northern YS from spring to autumn, and then spreads to deeper levels during the winter through strong mixing caused by strong winds. The mixing process also requires the winter monsoon as a driving force.
 |
| Fig. 14 Mean salinity of the DC section center in summer(solid line) and the evaporation minus precipitation rate(kg/(m2∙s),dashed line) |
The strength of YSWC changes the salinity input of the previous winter,the evaporation and precipitation alter the freshwater flux, and the winter monsoon affects the salinity of the northern YS by controlling sea surface height and water mixing during winter. All these factors can influence the salinity of the NYSCWM in the summer. The winter process plays a significant role in changing the salinity of the NYSCWM in the following year. 4 CONCLUSION
1)During summer,the southern and central parts of the NYSCWM salinity have a slight decreasing trend,while the salinity of the coastal area and the sea surface increases. The area of decreasing salinity does not coincide with the high salinity center,which may be affected by surface layer salinity through mixing or water mass exchange; 2)EOF analysis shows that the variations between the coastal,surface, and central NYSCWM waters have the opposite variation trends and ,as a result,the southern salinity front and the NYSCWM halocline have declining trends. This means that the salinity difference between the NYSCWM and the coastal water decreases; 3)the salinity of the NYSCWM shows good conservative properties. Winter process plays an important role in the variability of the NYSCWM salinity. YSWC,the winter monsoon, and the local E-P flux of the northern YS will all influence the salinity of the NYSCWM in the following year.
| Bai H, Hu D, Chen Y, Wang Q. 2004. Statistic characteristics of thermal structure in the southern Yellow Sea in summer.Chinese Journal of Oceanology and Limnology, 22 (3): 237-243, http://dx.doi.org/10.1007/BF02842554. |
| Bao X W, Li N, Yao Z G, Wu D X. 2009. Seasonal variation characteristics of temperature and salinity of the North Yellow Sea. Periodical of Ocean University of China, 4 (39): 553-562, http://dx.doi.org/10.3969/j.issn.1672-5174.2009.04.001. (in Chinese with English abstract) |
| Chu P C, Wells S K, Haeger S D, Szczechowski C, Carron M. 1997. Temporal and spatial scales of the Yellow Sea thermal variability. Journal of Geophysical Research :Oceans (1978-2012), 102 (C3): 5 655-5 667, http://dx.doi. org/10.1029/96JC03428. |
| Dee D, Uppala S, Simmons A, Berrisford P, Poli P, Kobayashi S, Andrae U, Balmaseda M, Balsamo G, Bauer P. 2011.The ERA—Interim reanalysis: configuration and performance of the data assimilation system. Quarterly Journal of the Royal Meteor ological Society, 137 (656): 553-597. |
| Du B, Zhang Y, Shan Y, Wang H. 1996. The characteristics of cold water mass variation at the bottom of the north Yellow Sea and its hydrological effects on the mortality of shellfish cultured in the waters of outer Chang-Shan Islands. Marine Science Bulletin, 15 (4):17-28. (in Chinese with English abstract) |
| Guan B-X. 1963. A preliminary study of the temperature variations and the characteristics of the circulation of the cold water mass of the Yellow Sea. Oceanologia et Limnologia Sinica, 5 (4): 255-284.(in Chinese with English abstract) |
| He C B, Wang Y X, Lei Z Y, Xu S. 1959. A preliminary study of the formation of Yellow Sea cold mass and its properties. Oceanologia et Limnologia Sinica, 2 (1): 11-15.(in Chinese with English abstract) |
| Hu D, Wang Q. 2004. Interannual variability of the southern Yellow Sea cold water mass. Chinese Journal of Oceanology and Limnology, 22 (3): 231-236, http://dx. doi.org/10.1007/BF02842553. |
| Hur H, Jacobs G, Teague W. 1999. Monthly variations of water masses in the Yellow and East China Seas. Journal of Oceanography, 55 (2): 171-184, .http://dx.doi.org/10 1023/A:1007885828278. |
| Jia R, Sun L. 2002. Distribution features of the Yellow and Bohai Seas temperature in winter and summer. Marine Science Bulletin, 21 (4): 1-8, http://dx.doi.org/10.3969/j. issn.1001-6392.2002.04.001.(in Chinese with English abstract) |
| Jiang B J, Bao X W, Wu D X, Xu J P. 2007. Interannual variation of temperature and salinity of northern Huanghai Sea Cold Water Mass and its probable cause. Acta Oceanologica Sinica, 29 (04): 1-10, http://dx.doi.org/10. 3321/j.issn:0253-4193.2007.04.001.(in Chinese with English abstract) |
| Lee S H, Beardsley R C. 1999. Influence of stratification on residual tidal currents in the Yellow Sea. Journal of Geophysical Research : Oceans (1978-2012), 104 (C7): 15 679-15 701, http://dx.doi.org/10.1029/1999JC900108. |
| Li K P. 1991. The response of Yellow Sea Cold Water Mass to changes in ocean. Acta Oceanologica Sinica, 13 (6): 779-785. (in Chinese) |
| Lin C, Ning X, Su J, Lin Y, Xu B. 2005. Environmental changes and the responses of the ecosystems of the Yellow Sea during 1976-2000. Journal of Marine Systems, 55 (3): 223-234, http://dx.doi.org/10.1016/j.jmarsys.2004.08.001. |
| Lin C, Su J, Xu B, Tang Q. 2001. Long-term variations of temperature and salinity of the Bohai Sea and their influence on its ecosystem. Progress in Oceanography, 49 (1): 7-19, 1http://dx.doi.org/10.016/S0079-6611(01) 00013-1. |
| Lv C L, Bao X W, Wu D X, Chen X E, Yu H. 2009. Analysis of decadal variability and interannual variability of salinity field in Bohai and Northern Yellow Sea in winter. Periodical of Ocean University of China, 39 (Suppl.): 267-273.(in Chinese with English abstract) |
| Ma C, Wu D X, Lin X P. 2006. The characters of interannual and long-term variations of salinity in the Bohai and Yellow Seas. Periodical of Ocean University of China, 36 (Suppl.): 7-12.(in Chinese with English abstract) |
| Meng Q J, Shi J W, Liu N, Wang F. 2011. A comprehensive analysis of the long-term variation of sea surface temperature in the China seas based on historical and satellite data. Marine Sciences, 35 (12): 121-126.(in Chinese with English abstract) |
| Park S, Chu P C, Lee J-H. 2011. Interannual-to-interdecadal variability of the Yellow Sea Cold Water Mass in 1967-2008: characteristics and seasonal forcings. Journal of Marine Systems, 87 (3): 177-193, http://dx.doi.org/10. 1016/j.jmarsys.2011.03.012. |
| Park W-S, Oh I S. 2000. Interannual and interdecadal variations of sea surface temperature in the East Asian Marginal Seas. Progress in Oceanography, 47 (2): 191-204, http:// dx.doi.org/10.1016/S0079-6611(00)00036-7. |
| Ren H J, Zhan J M. 2005. A numerical study on the seasonal variability of the Yellow Sea cold water mass and the related dynamics. Journal of Hydrodynamics, 20 (Suppl): 887-896, http://dx.doi.org/10.3969/j.issn.1000-4874. 2005. z1.012. (in Chinese with English abstract) |
| Song X, Lin X, Wang Y. 2009. The preliminary study of longterm variability of the Yellow Sea cold water in summer and its possible reasons. Journal of Guangdong Ocean University, 29 (3): 59-63, (in http://dx.doi.org/10.3969/j. issn.1673-9159.2009.03.012.Chinese with English abstract) |
| Tang Y. 2005. Yellow Sea Cold Water Mass. In : J Su ed.Hydrography of China Offshore. Ocean Press, China. p.202-206. (in Chinese) |
| Wang H, Yu F, Lv L. 2009. Characteristics of spatial and interannual variation in the Yellow Sea Warm Current area in winter. Advances in Marine Science, 27 (2): 140-148, http://dx.doi.org/10.3969/j.issn.1671-6647.2009.02. 003. (in Chinese with English abstract) |
| Wang R, Zuo T, Wang K. 2003. The Yellow Sea cold bottom water—an oversummering site for Calanus sinicus (Copepoda, Crustacea). Journal of Plankton Research, 25 (2): 169-183, http://dx.doi.org/10.1093/plankt/25.2.169. |
| Wei H, Shi J, Lu Y, Peng Y. 2010. Interannual and long-term hydrographic changes in the Yellow Sea during 1977-1998. Deep Sea Research Part II : Topical Studies in Oceanography, 57 (11): 1 025-1 034, http://dx.doi.org/10. 1016/j.dsr2.2010.02.004. |
| Wei H, Yuan C, Lu Y, Zhang Z, Luo X. 2013. Forcing mechanisms of heat content variations in the Yellow Sea. Journal of Geophysical Research : Oceans, 118 (9): 4 504-4 513, http://dx.doi.org/10.1002/jgrc.20326. |
| Weng X, Zhang Y, Wang C, Zhang Q. 1988. The variational characteristics of the Huanghai Sea (Yellow Sea) Cold Water Mass. Oceanologia et Limnologia Sinica, 19 (01): 368-379. (in Chinese with English abstract) |
| Wu D, Mou L, Li Q, Bao X, Wan X. 2004. Long-term variation of salinity of Bohai Sea and its probable primary cause.Progress in Natural Science, 14 (02): 191-195, http://dx. doi.org/10.3321/j.issn:1002-008X.2004.02.012. (in Chinese with English abstract) |
| Yao Z G, Bao X W, Li N, Li X B, Wan K, Song J. 2012.Seasonal Evolution of the Northern Yellow Sea Cold Water Mass. Periodical of Ocean University of China, 42 (6): 9-15, http://dx.doi.org/10.3969/j.issn.1672-5174. 2012.06.002.(in Chinese with English abstract) |
| Yu F, Zhang Z, Diao X, Gou J, Tang Y. 2006. Analysis of evolution of the Huanghai Sea Cold Water Mass and its relationship with adjacent water masses. Acta Oceanologica Sinica, 28 (5): 26-34, http://dx.doi.org/10. 3321/j.issn:0253-4193.2006.05.003. (in Chinese with English abstract) |
| Zhang G T, Sun S, Yang B. 2007. Summer reproduction of the planktonic copepod Calanus sinicus in the Yellow Sea: influences of high surface temperature and cold bottom water. Journal of Plankton Research, 29 (2): 179-186, http://dx.doi.org/10.1093/plankt/fbm005. |
| Zhang S, Wang Q, Lü Y, Cui H, Yuan Y. 2008. Observation of the seasonal evolution of the Yellow Sea Cold Water Mass in 1996-1998. Continental Shelf Research, 28 (3): 442-457, http://dx.doi.org/10.1016/j.csr.2007.10.002. |
| Zhang S, Yu F, Diao X, Guo J. 2009. The characteristic analysis on sea surface temperature inter-annual variation in the Bohai Sea, Yellow Sea and East China Sea. Marine Sciences, 33 (8): 76-81. (in Chinese with English abstract) |
| Zhang Y, Yang Y. 1996. Analyses of the variational characteristics of the North Huanghai Sea Cold Water Mass. Marine Forecasts, 13 (4): 15-21. (in Chinese with English abstract) |
| Zhao B R. 1986. The fronts of the Huanghai Cold Water Mass (HCWM) induced by tidal mixing. Chinese Journal of Oceanology and Limnology, 4 (2): 159-170, http://dx.doi. org/10.1007/BF02850432. |
| Zhao S, Yu F, Diao X Y, Si G C. 2011. The path and mechanism of the Yellow Sea Warm Current. Marine Sciences, 35 (11): 73-80. (in Chinese with English abstract)" |
 2015, Vol. 33


