 2015, Vol. 33
Shanghai University
Article Information
- LI Yongping (李永平), ZHENG Yunxia (郑运霞)_L
- Analysis of atmospheric turbulence in the upper layers of sea fog
- Chinese Journal of Oceanology and Limnology, 2015, 33(3): 809-818
- http://dx.doi.org/10.1007/s00343-015-4030-0
Article History
- Received Apr. 21, 2014;
- accepted in principle May 28, 2014;
- accepted for publication Oct. 16, 2014


Fog can be a disastrous weather phenomenon,occurring in the atmospheric boundary layer. Fog is categorized as radiation fog or advection fog,over l and or sea,respectively. Many physical factors affect formation and dissipation of fog,including stable atmospheric stratification,air saturation,wind speed,air-sea temperature difference, and turbulence intensity,as summarized by Zhang and Bao(2008) and Ren and Zhang(2011). Atmospheric turbulence within the boundary layer is crucial for the exchange of material and energy,important for developing and dissipating fog(Duynkerke,1999; Zhang et al., 2005). Previous studies of turbulence in fog focused on indoor experiments and numerical simulations because of inadequate field devices. Bott et al.(1990),Nakanishi(2000), and Huang et al.(2010)found that turbulent transport was important for the occurrence and dissipation of radiation fog through numerical simulation,later verified by Zhou and Ferrier(2008)using a theoretical analysis. Zhou and Ferrier(2008)showed that radiation fog occurs and persists only when turbulence intensity is below a threshold value; the thicker the fog,the larger this threshold value. If the turbulence intensity exceeds the threshold,then the fog dissipates. Turbulence has also been investigated in sea fog. Zhang et al.(2010)found that air temperature inversion and strong turbulence are conducive to the development of a sea fog of a certain thickness.
In recent years,the use of ultrasonic anemometers with high temporal data resolution has greatly assisted the study of atmospheric turbulence in sea fog. Wu et al.(2010,2011)studied advection fog using ultrasonic anemometer data collected on a 40-m tower in Beijing. They found that the spectral energy density of turbulence was high in frequency during fog formation,but low in frequency before and after the fog. Although the average kinetic energy was relatively small during the fog,turbulence increased and the direction of turbulent energy transport became vertical. Thus,the average kinetic energy and turbulent kinetic energy increased abnormally before fog formation,signaling the beginning of advection fog. Numerical results by Li(2011)showed that the height of fog depends on the intensity of turbulence; the stronger the turbulence,the higher the top of the sea fog. In addition,the intensity of turbulence in the boundary layer is related to vertical wind shear and air temperature stratification; the larger the vertical wind shear,the stronger the turbulence. However,an inversion of air temperature can neutralize turbulence after the sea fog forms.
Previous field studies were limited by the height of ultrasonic anemometers,typically less than 100 m above ground and well within the constant flux layer,where the vertical turbulence fluxes of momentum and heat are invariable in layers of different heights. In addition,most field observations were conducted over l and ,rarely over sea. Since sea fog is typically 300–400 m thick(Zhou,1981),much thicker than over l and ,few studies have looked at turbulence in the upper layers of sea fog. In this study,we use data from ultrasonic anemometers on a wind tower atop a mountain on Yushan Isl and about 14 km off the coast of north Fujian Province,South China. We studied atmospheric turbulence between 390–450 m above ground during a heavy sea fog event. We evaluate the relationship between turbulence and formation/dissipation of sea fog, and characterize the turbulent structure of sea fog at its upper boundary. 2 OBSERVATION
We analyzed turbulence data measured by ultrasonic anemometers installed on a wind tower on Yushan Isl and (26°57′N,120°21′E),14 km from the coast of north Fujian Province,China. The wind tower base is at 355 m AMSL; it has four ultrasonic anemometers installed at heights of 35,55,75, and 95 m,i.e.,390,410,430, and 450 m AMSL,respectively.
The WindMaster 3-D ultrasonic anemometer(Gill Instruments Ltd.,UK)consists of three pairs of ultrasonic transmitters and receivers,perpendicular to each other. Thus,the ultrasonic anemometer can measure 3-D wind speed and air temperature at very high frequency; its temporal resolution is 0.05 s,with resolution to ±0.01 m/s for wind speed,±0.1 for wind direction, and ±0.1°C for air temperature. In addition to reviewing the automatic validation codes generated by the anemometer,we carried out additional data quality control after Chen et al.(2000); some data were discarded for intervals with unstable power supply or other unknown reasons. The revised dataset was completed using linear interpolation.
Visibility and other meteorological data are from Xiapu Weather Station,located near the coast,about 23 km from the observation tower. Since terrain is relatively flat between Xiapu Weather Station and the seashore, and the tower is close to the isl and coast,terrain has a very small influence on the local sea fog.
A sea fog event covering the whole coast of northern occurred in this area from 02:00 BT(Beijing Time)to 11:00 BT on March 21,2011. Table 1 lists relevant atmospheric parameters recorded at Xiapu Weather Station. FY-2E satellite remote sensing images were used to validate the consistency of fog evolution and fog homogeneity at and Xiapu Weather Station. Satellite images,as well as surface-air element analyses showed that both locations were in the same fog region during this period.
 |
Although,local atmospheric visibility was good from 20:00 to 23:00 on March 20,fog occurred from early morning to noon on March 21,causing visibility to reduce to 1.0 to 2.0 km. Lowest visibility was 700 m from 8:00 to 12:00 on March 21. Visibility returned from 14:00 pm on March 21. The variation in visibility measured at the weather station is consistent with changes in grayscale on satellite images. S-SE winds at 2–6 m/s prevailed during the fog episode,i.e.,airflow was from the ocean for coast orientated SW-NE.
Before the fog appeared,air temperature in the lower atmosphere(up to 2 km altitude)decreased steadily with altitude,i.e.,there was no inversion layer; the 3°C difference between air and dew point temperature indicated unsaturated air conditions(Fig. 1). At 08:00 on March 21,an inversion layer developed from 300 to 800 m altitude during the fog episode; the difference between air and dew point temperature was below 1.5°C,indicating nearly saturated air conditions. At 20:00 on March 21,after the fog dissipated,air temperature below 800 m decreased slightly with altitude,while the boundary layer of the lower atmosphere became unstable, and the inversion height rose to 850 m.
 |
| Fig. 1 GPS sounding profiles at Xiapu Weather Station
Profiles recorded at(a)20:00 on March 20;(b)08:00 on March 21; and (c)20:00 on March 21. Solid line is air temperature; dottedline is dew point temperature. |
Temperature measured on the wind tower at Yushan Isl and showed changes consistent with changes to atmospheric stability described above.
The time series of 2-min average air temperatures at 390 m and 450 m AMSL show that on March 20,from 20:00 to 23:00,average temperature at 390 m height was 0.48°C higher than that at 450 m,simply reflecting a decrease in air temperature with altitude(Fig. 2). From 23:00 on March 20 until 10:00 on March 21,temperature decreased consistently in these two layers,but more slowly at 450 m,causing an inversion in the temperature structure. Notably,visibility also decreased during this period. From 10:00 to 18:00 on March 21,temperature continued to decrease slowly in the both layers,but more slowly at 390 m,dissipating the inversion layer during the later stage of the fog episode. Overall,temperature stratification observed near the top of the fog layer by the ultrasonic anemometers was consistent with sounding data from Xiapu Weather Station.
 |
| Fig. 2 two-min-average air temperature at 390 m(dot) and 450 m(solid)above the sea surface; b. two-min-average air temperature difference between 390 m and 450 m above the sea surface
The triangles indicate the beginning and end of the fog episode |
The time series of 2-min average wind speeds at 390 m and 450 m altitude show that from 20:00 to 22:00 on March 20,before fog formation,wind velocity was only 1–4 m/s(Fig. 3). After 23:00,as fog appeared,wind velocity increased rapidly to 8–10 m/s,but no obvious vertical shear existed between layers. Before the fog dissipated on March 21,both wind speed and its vertical shear component increased. 3 CHARACTERISTICS OF TURBULENCE
To analyze turbulence characteristics of wind,the x-axis is assigned as the average wind direction, and turbulent fluctuation values are determined using average wind speed.
 |
| Fig. 3 Two-min-average wind speed at 390 m(dotted line) and 450 m(solid line)above the sea surface |
The turbulent fluctuation values for wind can be expressed as:
where U and W are the average wind speed and vertical speed over 30-min; θ is the rotation angle; and u',v', and w' are turbulent fluctuation values alongthree perpendicular directions. 3.1 Turbulent kinetic energy
The total turbulent kinetic energy(TKE)can be expressed as E= u'Ω+ v'Ω+ w'Ω,which comprises a horizontal TKE component Eh= u'Ω+ v'Ω and a vertical one Ez= w'Ω. Time series of 2-min average Evalues for all four anemometer heights are shown from 20:00 on March 20 to 18:00 on March 21(Fig. 4).
 |
| Fig. 4 Two-min-average E values at 390 m,410 m,430 m, and 450 m AMSL from 20:00 on March 20 until 18:00 on March 21 |
From 20:00 to 23:00 on March 20,before fog formation,the total TKE was small in all layers,consistent with low wind speed. At fog onset,the total TKE increased obviously in all layers. For example,at a height of 390 m it increased from 0.5 to 2.5 m2/s2, and at 450 m from 0.3 to 2.0 m2/s2. Our measurements of TKE indicate it decreased vertically within the sea fog. Nakanishi’s large eddy simulation revealed similar features for TKE in radiation fog(Nakanishi,2000).
Here,we determine the critical TKE parameter Ec. As a first step,we require the critical turbulent exchange coefficient Kc for deep fog. Proposed by Zhou and Ferrier(2008),it defines the upper limit of turbulence intensity that a persisting fog can withst and :
In our study,the gravitational settling parameter α=0.062; β=1.02 when T=20°C and P=1 000 mb; Ct(degree per hour)is the cooling rate,equal to 0.5/3 600(calculated from Fig. 2a,where temperature at 450 m decreased by 5°C in about 10 h); and His the fog depth,taken here to be 450 m. These parameter values give kc39.6 m2/s,which is high compared with Kcvalues for mature stage radiation fog of around 1.0–2.0(Zhou and Ferrier, 2008). The main reason for such a high Kcvalue is that the sea fog was 10 times higher than regular ground fog.
The second step converts the Kcvalue to a “critical TKE” or Ec,using the relationship kc0.25 L×Ec1/2(Musson-Genon,1987),where Lis a scale length related to the mixing length in fog,estimated with 1/ L=1/(0.35 z)+1/ λ(Blackadar,1962). Here,z is height and λ is a layer range above the ground. For this sea fog episode,both z and λcan be estimated by fog depth H(~450 m),giving L=0.26 H. Thus,Ec=[ Kc/(0.06H)] 2or about 2.2 m2/s2. This TKE value is much larger than for typical radiation fog(around 0.1 m2/s2)(see Fig. 6; Nakanishi,2000).
Although the TKE remained high in upper levels of the fog bank during the fog episode,from 08:00 to 11:00 on March 21 and coincident with lowest visibility,the TKE weakened in lower levels(390 m and 410 m),while it remained high in the upper levels. When the fog began to dissipate,after 14:00 on March 21,TKE increased again in all layers. We calculated a critical Ec of 3.1 m2/s2was calculated for fog recede. Our study suggests that a moderate TKE favors sustaining the fog,but if TKE increases,the fog recedes. In addition,the TKE is anisotropic,with the largest component along downwind direction,followed by crosswind and vertical directions. 3.2 Turbulent momentum flux
The vertical turbulent momentum flux( F)can be expressed as:
where pais air density, and u′, v′, and w′are the turbulence fluctuations along three perpendicular directions. A positive F/ paindicates upward transport of momentum,while a negative one means downward transport. Generally,the value ofu′ w′is larger than v′ w′.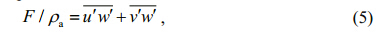
Figure 5 shows the temporal evolution of the vertical turbulent momentum flux in 2-min averages for the four heights monitored.
Obviously,from 20:00 to 23:00 on March 20,the turbulent momentum flux was close to zero in all four layers,while visibility was good. During the onset and mature stages of the fog,the moment fluxes at 390 and 410 m were mostly negative,indicating downward transport. While in uppermost layers,there was positive-negative alternation,with no obvious net contribution to flux.
The contribution of the vertical turbulent momentum flux to the mean flow can be expressed as(Stull,1991):
where u is the wind speed in two minutes,tis the time and zis the vertical coordinate. According to Eq.6,the curves in Fig. 5a,b show that the turbulent momentum flux increased with altitude from 23:00 on March 20 to 12:00 on March 21. Since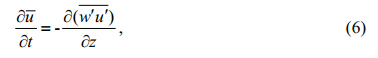
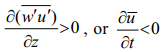 for levels at 410 m and 430 m,then the distribution of turbulent momentum flux was conducive to lowering average wind speed in these layers,balancing the positive contribution to momentum transport from mean air flow from the uppermost layers. Therefore,the average wind speed during this period was relatively stable(Fig. 3).
  |
| Fig. 5 a. vertical turbulent momentum flux in 2-min averages at four levels: 390,410,430 and 450 m above sea surface; b. gradient of vertical turbulent momentum flux in 2-min averages between heights of 410 and 430 m |
From 12:00 to 18:00 on March 21,the momentum fluxes at 390 and 410 m remained negative; the momentum fluxes in upper layers also became negative,Thus,the momentum flux in all layers was downwards,with kinetic energy moving steadily from upper to lower layers,maintaining relatively large wind speeds near the top of the fog. This vertical distribution of turbulent momentum flux favored the rapid increase in average wind speed in these layers(Fig. 3). 3.3 Turbulent sensible heat flux
The turbulent sensible heat flux(F H)can be expressed as:
where T′is the turbulent pulsation of air temperature,Cpis the specific heat at constant pressure. The sensible heat transport is upwards,if T'wis positive,or downwards,if negative.
Figure 6 shows the temporal evolution of the vertical turbulent sensible heat flux in 2-min averages at four heights.
 |
| Fig. 6 a. sensible heat flux in vertical turbulence in 2-min averages at levels 390,410,430, and 450 m above the sea surface; b. gradient of vertical turbulent sensible heat flux in 2-min averages between layers at 410 and 430 m |
Before fog onset,turbulent sensible heat flux wasclose to zero in all layers. During fog,from 23:00 on March 20 to 09:00 on March 21,sensible heat flux was mostly negative in the lower layers at 390 and 410 m,indicating downward transport of sensible heat. Net fluxes were not obvious in the uppermost layer at 450 m,when the inversion layer was present at this height. Thus,sensible heat flux transport took place along the gradient of mean temperature. The contribution from sensible heat flux associated with vertical turbulence to the mean temperature variation can be described by the following equation(Stull,1991):
Figure 6a,b shows that heat flux increased with altitude during fog,from 23:00 on March 20 to 09:00 on March 21. In other words,when ∂x/∂t<0,heat flux results in cooling. Hence,the mean temperature decreased gradually in this period(Fig. 2).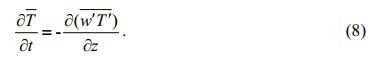
After 09:00 on March 21,positive sensible heat flux occurred in the uppermost layers from 430 to 450 m,exp and ing to the lower layers after 13:00. Hence,upward sensible heat flux occurred in all layers during this time,causing the inversion layer to vanish. Thus,turbulent sensible heat flux was along the temperature gradient in this period. From Eq.7,vertical movement of sensible heat flux decreases the mean air temperature because the upward sensible heat flux in the upper layer was greater than that for the underlying layers. This type of vertical distribution of heat flux implies that more heat was stored in the upper layers than in the lower layers,prompting the disappearance of the inversion layer(Fig. 2). 3.4 Spatial and temporal scales of turbulence
Integrated spatial and temporal scales of turbulence reflect the average size and average life expectancy of eddies. A method involving the autocorrelation function(Flay and Stevenson, 1984)is used to calculate the turbulence integral scales:
where Vis the average wind speed over 30 min,x( t)is the turbulence time series from the ultrasonic anemometers, L is the spatial scale of turbulence, and T is the temporal scale of turbulence. Hence,Rx( τ)isthe autocorrelation function of x(t),giving:where Sx2is the variance of the time series of turbulent fluctuation. Figures 7 and 8 show the hourly average spatial and temporal scale time series for u ' and w 'from Eq.1 and Eq.3 at heights 390 and 450 m,respectively.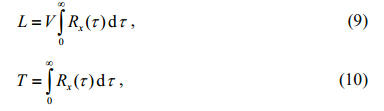

The spatial and temporal scales of turbulence fluctuation in the downwind direction are clearly greater than those in the vertical direction(Figs.7 and 8). The spatial scales range from tens to hundreds of meters along the downwind direction,with temporal scales from a few to tens of seconds. While the spatial scales along the vertical direction are from a few to tens of meters,with temporal scales of a few seconds. Notably,the spatial and temporal scales of turbulence in lateral directions were smaller than for the downwind direction,but larger than for the vertical direction. The spatial and temporal scales were larger before fog onset and after fog dissipation than during the fog episode. Figures 7 and 8 also show that in most cases,spatial and temporal scales in the downwind direction were slightly larger in the uppermost layers.
 |
| Fig. 7 Hourly average spatial scale series along u(a) and w(b)directions at heights of 390 m(solid line) and 450 m(dashed line) |
 |
| Fig. 8 Hourly average temporal scale series along u(a) and w(b)direction in 390 m(solid lines) and 450 m(dashed lines) |
Previous observational studies of turbulence effects on fog focused on near-ground levels,leading to a lack of information on the turbulence characteristics near the top of the fog. We present a diagnostic analysis with very high frequency observation data for a sea fog,focused on the turbulence characteristics at heights around 400 m AMSL. We described changes to upper layer turbulence as the fog developed and subsided. We found that turbulence near the top of the fog layer showed some similarity to near-ground layers studied by other researchers. The TKE varied frequently during the fog episode. A rapid increase in total TKE took place prior to the onset of fog; while during its maintenance stage,turbulence remained at levels necessary for cooling. This “dual-role” of turbulence,dissipating and generating droplets,appears to be unique to sea fogs,differing markedly from its “solo-role” in radiation fogs,where it dissipates the fog deck. In radiation fog,radiation cooling is only one source of liquid water generation. In contrast,we found that a steady high turbulence level,not exceeding its critical threshold Ec,was crucial for continuous generation of liquid water droplets inside the sea fog. However,the sea fog dissipated,when TKE continued to increase. Accordingly,we determined two thresholds for TKE,important for developing and dissipating sea fog,respectively. These thresholds varied with height because TKE also varied with height. In addition,TKE was anisotropic with its largest component in the downwind direction,followed by lateral and vertical directions.
Turbulence also infl uenced the average atmospheric conditions during sea fog,affecting its evolution. The average wind speed and air temperature were both changed by the vertical distribution of momentum flux and sensible heat flux. We showed that the vertical distribution of momentum and sensible heat fluxes contributed to reduction in mean wind speed and cooling during the onset of fog. The vertical distribution of sensible heat flux caused the temperature inversion to disappear,just before fog dissipation. During this time,the momentum fluxincreased,with downward transport in all upper layers,resulting in an increase in mean wind speed at lower layers,further favoring fog dissipation.
Further analysis showed that the spatial and temporal scales of turbulence fluctuation varied as the fog evolved. The average spatial scale of turbulence was largest with the longest lifespan during the dissipation stage,followed by stages before, and during the fog episode. The spatial and temporal scales of turbulence were largest in the downwind direction,followed by lateral and vertical directions. The spatial and temporal scales were slightly larger in uppermost layers.
This work highlights the effects of turbulence near the top of a sea fog. However,the process of sea fog formation,development, and dissipation is a very complicated,related not only to the complex interplay of external factors,such as meso-scale airflow,solar radiation heating,etc.,but also to internal factors,such as turbulence,fog the depth, and the vertical distribution of liquid water content,etc. More studies are clearly needed to underst and the dynamics of sea fog. 5 ACKNOWLEDGMENT
We acknowledge the valuable and extensive comments from two anonymous reviewers.
| "Blackadar A K. 1962. The vertical distribution of wind and turbulent exchange in a neutral atmosphere J. Geophys.Res., 67 (8): 3 095-3 102. |
| Bott A, Sievers U, Zdunkowski W. 1990. A radiation fog model with a detailed treatment of the interaction between ratiative-transfer and fog microphysics. Journal of the Atmospheric Sciences, 47 (18): 2 153-2 166. |
| Chen H Y, Hu F, Zeng Q C. 2000. Dealing with imperfect data to improve estimation precision of turbulence flux.Climatic and Environmental Research, 5 (3): 304-311. (in Chinese with English abstract) |
| Duynkerke P G. 1999. Turbulence, radiation and fog in Dutch stable boundary layers. Boundary-Layer Meteorology, 90 (3): 447-477. |
| Flay R G J, Stevenson D C. 1984. Integral length scales in strong winds below 20 m. J. Wind Engineer Indust.Aerodynami, 28 (1-3): 21-30. |
| Huang J, Wang B, Zhou F X et al. 2010. Turbulent heat exchange in a warm sea fog event on the coast of the South China. Chinese Journal of Atmospheric Sciences, 34 (4): 715-725. (in Chinese with English abstract) |
| Li P Y. 2011. An Observational and Modeling Study of Sea Fogs over the Yellow Sea Based upon WRF Model. Ph.D.Thesis, Ocean University of China. (in Chinese with English abstract) |
| Musson-Genon L. 1987. Numerical simulation of a fog event with a one-dimensional boundary layer model. Mon. Wea.Rev., 115 : 592-607. |
| Nakanishi M. 2000. Large-eddy simulation of radiation fog.Boundary-Layer Meteorology, 94 (3): 461-493. |
| Ren Z P, Zhang S P. 2011. Structure characteristics of the Yellow Sea summer fog in the boundary layer and the comparison with spring fog. Periodical of Ocean University of China, 41 (5): 23-28. (in Chinese with English abstract) |
| Stull R B. 1991. An Introduction to Boundary Layer Meteorology.Qingdao Ocean University Press, Qingdao, China. (in Chinese translated by Xu Jingqi and Yang Dianrong) |
| Wu B G, Zhang H S, Wang Z Y, Zhu H, Xie Y Y. 2011. Study on turbulent structures and energy transfer during an advective fog period. Acta Scientiarum Naturalium Universitatis Pekinensis, 47 (2): 295-301. (in Chinese with English abstract) |
| Wu B G, Zhang H S, Zhang C C. 2010. Characteristics of turbulent transfer and its temporal evolution during an advection fog period in North China. Chinese Journal of Atmospheric Sciences, 34 (2): 440-448. (in Chinese with English abstract) |
| Zhang G Z, Bian L G, Wang J Z et al. 2005. The boundary layer characteristics in the fog formation process over Beijing and its surrounding areas. Science in China (Series D), 35 (Suppl. I): 73-83. (in Chinese with English abstract) |
| Zhang S P, Bao X W. 2008. The main advances in sea fog research in China. Periodical of Ocean University of China, 38 (3): 359-366. (in Chinese with English abstract) |
| Zhang S P, Ren Z P. 2010.The influence of the thermal effect of underlaying surface on the spring sea fog over the Yellow Sea: observations and numerical simulations. Acta Meteorologica Sinica, 68 (4): 439-449. (in Chinese with English abstract) |
| Zhou B, Ferrier B S. 2008. Asymptotic analysis of equilibrium in radiation fog. Journal of Applied Meteorology and Climatology, 47 (6): 1 704-1 722. |
| Zhou F X. 1981. Fog. China Ocean Press, Beijing, China. p.40. (in Chinese)" |