 2015, Vol. 33
Shanghai University
Article Information
- PU Fei(濮菲), YANG Bingye(杨丙晔), KE Caihuan(柯才焕)
- Characterization of reference genes for qPCR analysis in various tissues of the Fujian oyster Crassostrea angulata
- Chinese Journal of Oceanology and Limnology, 2015, 33(4): 838-845
- http://dx.doi.org/10.1007/s00343-015-4078-x
Article History
- Received Mar. 22, 2014
- accepted in principle Jun. 23, 2014
- accepted for publication Nov. 11, 2014


2 College of Ocean and Earth Science, Xiamen University, Xiamen 361102, China;
3 Xiamen Medical College, Xiamen 361008, China
Real-time quantitative PCR(qPCR)is an effective method for quantifying mRNA transcription levels because of its reproducibility, high sensitivity and large dynamic range. Additionally, qPCR is high throughput, providing simultaneous measurements of gene expression in a large number of samples for a defi ned set of genes. To take advantage of qPCR, there are a variety of methods to analyze the experimental data(Vu et al., 2000). The two most commonly used methods to detect gene expression are absolute quantitative and relative quantitative methods. Absolute quantitation needs other means and methods to calibrate the absolute quantity of RNA, and then, by building standard curves, analyzes and quantifi es the template samples(Vu et al., 2000; Niesters, 2001). However, this method is complicated, time consuming and expensive, and has rarely been used in the analysis of differential gene expression. Generally, researchers do not pay close attention to the copy number of target transcripts; they focus on alterations of gene expression under different external processes and physiological states. Therefore, certain hypotheses and special formulas to deduce the changes in gene expression directly will greatly simplify the research method in the case where the absolute copy number of the samples is unknown. At present, the most commonly used relative quantitative method is 2-ΔΔCt(Livak and Schmittgen, 2001). One of the crucial steps when comparing the generated transcriptional profi les is accurate normalization. For this reason, variables such as the initial material mass, enzyme effi ciencies, variations in transcriptional activity and the extracted mRNA quality need to be taken into account. To reduce such variations, appropriate endogenous reference genes with theoretically stable expression patterns, independent of cell/tissue type or experimental conditions, are commonly used for accurate and dependable normalization(Bustin, 2002). However, some studies have revealed variations in the expression levels of certain reference genes, caused by factors such as different developmental stages and varied experimental treatments(Olsvik et al., 2005; Dondero et al., 2006). Therefore, the stability of c and idate reference genes must be determined before use in qPCR normalization.
Several mathematical approaches have been proposed to evaluate the relative stability of gene expression to identify optimal reference genes (Vandesompele et al., 2002; Andersen et al., 2004). The most commonly used software, geNorm, is based on the hypothesis that the expression ratio of two ideal control genes should be identical in all samples and under all experimental conditions. The algorithm provides a measure of gene expression stability(M) by calculating the mean pairwise variation between an individual gene and all other chosen c and idate genes, offering systematic variation of reference gene selections. Numerous c and idate reference genes have been evaluated to identify controls for qPCR normalization under specifi c conditions and in various organisms, including humans, animals, microbes, and various plants(Nygard et al., 2007; Setiawan andLokman, 2010; Leelatanawit et al., 2012; Wang et al., 2012 ; Zhang et al., 2012; Zhai et al., 2013). Reference genes are generally divided into the following categories, based on the cellular processes implicated, such as cell structure(ACT and TUB), protein synthesis and degradation(EF - 1α, EF - 1β and UBQ), ribosomal components(18S rRNA) and glycolysis (GAPDH).
The Fujian oyster, Crassostrea angulata, is one of the most economically important bivalves(ranked third worldwide), in addition to serving as an ideal model for biochemical, molecular and genetics research. In September 2012, the oyster genome was published, bringing oysters into the post-genomic era and increasing the levels of genome-based studies. The availability of this genome presents an urgent need for the validation of suitable reference genes for transcript analysis in C . angulata. However, systematic reference gene data are not available; therefore, our research focused on the identifi cation of reference genes in C . angulata suitable for comparative expression profi ling.
2 MATERIAL AND METHOD 2.1 Animal material and samplingsMarket oysters from the coastal culture zones of Tongan were purchased before the experiment, rinsed with distilled water and precautions taken to exclude any contaminations. Six oysters(40.25–59.60 g)were dissected to obtain different tissue pools, including the mantle, gill, adductor muscle, labial palp, visceral mass, hemolymph and gonad tissues, after washing with normal saline. To obtain hemocyte samples, the oysters were washed with normal saline several times to ensure no impurities on the surface. The blood sinus was punctured and the liquid pumped immediately with into an Eppendorf tube. The blood samples were centrifuged at 3 000×g for 5 min to collect the hemocytes and the supernatant was discarded. Intact mantle, gill, adductor muscle, labial palp, visceral mass, hemolymph and gonad tissues were sampled, and 50–100 mg samples were excised with sterile scissors. Samples were combined with Trizol before total RNA extraction. Three independent biological replicates were performed.
2.2 RNA preparation and cDNA synthesisSamples(50–100 mg)were homogenized adequately in Trizol using a Retsch MM400 tissue disruptor(Retsch, Germany), and then incubated at room temperature for 5 min. Two hundred μL chloroform was added to the sample, which was vortexed for 15 s, and left at room temperature for 2–3 min. Samples were centrifuged at 12 000×g for 15 min at 4°C, and the supernatant extracted. 500 μL isopropanol was added to the supernatant and incubated at 4°C for more than 1 h. Following incubation, samples were centrifuged at 12 000×g for 10 min at 4°C and the supernatant discarded. The RNA pellet was washed with 75% EtOH and vortexed, centrifuged at 7 500×g for 5 min at 4°C, and the supernatant was discarded and the remaining EtOH allowed to evaporate for 2–3 min before adding 20 μL DEPC water to resuspend the pellet. Extracted RNA quantifi cation and qualifi cation was detected at 260 and 280 nm using a ND-1000 ultraviolet spectrophotometer(NanoDrop, ThermoFisher Scientifi c, USA), and RNA integrity examined via 1.2% agarose gel electrophoresis.
Five hundred nanograms of extracted RNA to be used for qPCR was reverse transcribed using a PrimeScript RT reagent Kit(TaKaRa, Dalian, China), according to the manufacturer’s protocol. The cDNA mix was stored at -20°C, while the remainder of the extracted RNA was stored at -80°C.
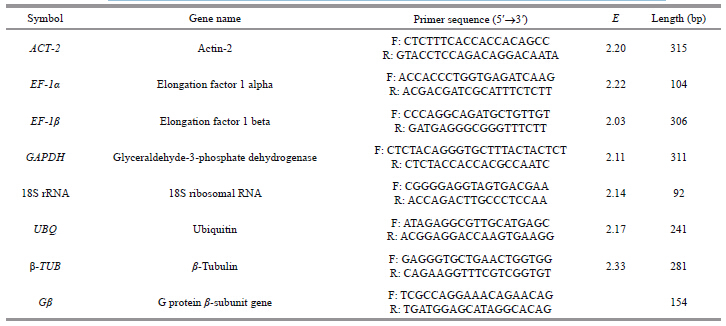
2.3 Primer design and qPCR analysisSeven commonly used reference genes were selected: actin-2, two elongation factors, ubiquitin, tubulin, glyceraldehydes-3-phosphate dehydrogenase, and ribosomal RNA 18(Table 1). All the qPCR primers were designed using Primer Premier 5.0, with cDNA sequences based on the Crassostrea gigas database(NCBI) and the transcriptome library of C . angulata . The primers were synthesized by Invitrogen Trading Co., Ltd.(Shanghai, China).
 |
The mantle, gill, adductor muscle, labial palp, visceral mass, hemolymph and male and female gonad tissues of C . angulata were sampled, and three independent biological replicates performed. cDNA obtained from the extracted mRNA templates was diluted 1:10 and 2 μL was used for qPCR, using the ABI 7500 fast Real-Time PCR System(Applied Biosystems, Foster City, CA, USA)with the SYBR green qPCR kit(ThermoFisher Scientifi c, Waltham, MA, USA). The reaction system included 2 μL of 1:10 diluted cDNA template, 10 μL master mix, 6 μL double-distilled water and 1 μL each primer. Dissociation curves were created to ensure specifi c amplifi cation, with all reactions completed in triplicate; Ct values were generated from the ABI 7500 software v2.0.6(Applied Biosystems)(Tang et al., 2007).
A standard curve was generated using a 10-fold serial dilution of cDNA for each primer pair to determine the PCR efficiencies(E). All PCR experimentation was carried out in triplicate and standard curves were constructed for each reference cDNA sample using Microsoft Office Excel 2007. The primers’ efficiencies were determined by the slope of the standard curve, using the following formula: E=(10-1/slope)(Ståhlberg et al., 2003), with an amplification efficiency of each primer pair ≥ 90% being selected.
2.5 Data analysesAfter qPCR analysis and data collection, two different software packages were used to calculate the expression stability of the chosen genes. GeNorm was used to calculate the expression stability value(M)for the reference genes and to sort the most stable genes. The original datum of Ct values for each gene was transformed to a relative quantity(Q)using genespecifi c effi ciencies(E) and the difference between the lowest Ct value and the Ct value of each gene, according to the equation: Q=E(min Ct – sample Ct) . Q was then converted to the required fi le type for analysis by the geNorm software and the M value was calculated by determining the average pairwise variation(V)for a given gene relative to another chosen reference gene. The larger the M value, the lower the stability of each gene.
Last, to demonstrate the effect of reference gene selection on the interpretation of a target gene expression dataset, we analyzed the mRNA expression of the G protein β-subunit gene Gβ, a key player in various signal transduction pathways, via qPCR, using the comparative ΔΔCt method of relative gene quantifi cation(Pfaffl, 2001; Siah et al., 2008). A probability(P)value ≤0.05 was deemed signifi cant, in addition to at least a two-fold increased or decreased expression relative to the calibrator tissue sample.
3 RESULT3.1 Establishment of qPCR assays
Before proceeding with qPCR, PCR effi ciencies for these genes were tested by a serial dilution of cDNA samples to display reproducible standard curves, where the coeffi cient of determination(R2)for all standard curves was above 0.990. The primer amplifi cation effi ciency of each c and idate gene was calculated from the slope of the standard curve (Table 1).
3.2 Expression of c and idate genes and selection of internal controlsAfter the optimum qPCR conditions were established, examination of the transcription levels of the seven c and idate genes in the seven tissues was performed, and the raw Ct values determined(Fig. 1). In general, the seven c and idate genes showed a wide expression range, with Ct values ranging from 11.73 to 26.26. The 18S rRNA transcripts exhibited the lowest Ct values under 17 cycles, exhibiting slight variations in the seven tissue samples. ACT-2 and EF-1α came in second with Ct values below 23, while GAPDH exhibited the most unstable expression, with Ct values varying from 19.04 to 26.26, with dramatically high expression noted in the visceral mass. By contrast, the expression of UBQ, β-TUB and EF-1β were correspondingly stable.
 |
| Fig. 1 The transcription levels of the seven c and idate genes shown as relative Ct values in seven tissue samples
from C . angulate The absolute quantifi cation assay measured triplicate data sets and data were analyzed using the 7500 Software v2.0.6(Applied Biosystems) and displayed as mean values. Templates were the 10×diluted cDNA reverse transcribed from each RNA sample. |
Next, geNorm was used to evaluate the optimal internal control among the seven reference genes, with the M values for 18S rRNA, ACT-2, GAPDH, EF-1α, β-TUB, EF-1β and UBQ in the seven tissues being 2.938, 1.972, 3.365, 1.469, 1.425, 1.404, and 1.425, respectively(Fig. 2a). UBQ and β-TUB exhibited the lowest M values, making them the most stable genes, with GAPDH exhibiting the highest M value and thus the lowest expression stability. In general, the expression stabilities among these genes were ranked as follows: UBQ/β-TUB>EF-1β>EF-1α>ACT-2>18S rRNA>GAPDH . Moreover, the optimal number of reference genes for accurate normalization was established by geNorm according to the default cut-off V value of 0.15(the point at which it is not necessary to include other genes in a normalization strategy), revealing that the use of two of the three most stable genes would provide an adequate basis for normalization(Fig. 2b).
 |
| Fig. 2 Selection of the ideal reference genes for qPCR normalization using geNorm analysis a. x -axis shows the ranking of the genes based on their expression stability. The average expression stability(M)of the reference genes was calculated over the course of gradually excluding the least stable genes, with data obtained from three biological replicates and three technical replicates. The larger the M value, the more unstable the expression, with a smaller M value indicating higher stability; b. determination of the optimal number of control genes for normalization. Vn/Vn+1 is the pairwise variation between normalization factors of n and n+1 genes. The geNorm algorithm proposes a default cut-off V value of 0.15, under which the inclusion of an additional reference gene is not required. |
reference gene For verifi cation of the most stable reference genes identifi ed from geNorm analysis, we tested the gene Gβ via qPCR analysis, followed by reference gene normalization(Fig. 3). The expression pattern of Gβ normalized to UBQ expression levels showed that the transcription levels of Gβ were the highest in the labial palp, followed by the hemolymph, adductor muscle, gill, mantle, gonad, and visceral mass, with a similar trend noted following normalization to β-TUB expression levels(Fig. 3). When combining UBQ and β-TUB as reference genes, the results were consistent with the use of UBQ or β-TUB alone, confi rming these genes as effective internal controls.
 |
| Fig. 3 Validation of the expression pattern of G protein β-subunit gene, Gβ, in C . angulata tissues by qPCR analysis Relative quantifi cation was calculated using the comparative Ct method. The raw qPCR data of the Gβ transcript were normalized to the expression levels of UBQ and β-TUB, and a combination of UBQ and β-TUB as the internal control, with the visceral mass sample considered a calibrator. The mean relative expression values are shown in the columns. Mean and error bars were calculated from three independent replicates. |
For non-model species, such as those used for aquaculture, minimal or no genomic information pertinent to gene expression quantifi cation is available. Thus, the isolation of potential reference genes exhibiting stable expression patterns for accurate gene expression normalization across varying samples and tissue types is required. The optimal reference gene should be highly transcribed in all cell types and all developmental stages. In addition, the expression of such a gene should not be affected by internal or external infl uences beyond the general variation in RNA synthesis. Accurate normalization of gene expression with an adequate set of reference genes is imperative to generate reproducible data sets, which has led to an increase in research focusing on reference gene identifi cation (Cho et al., 2008; Janská et al., 2013 ; Vorachek et al., 2013 ; Zhang et al., 2013; Zhu et al., 2013). It is diffi cult to fi nd an all-purpose reference gene exhibiting a stable expression pattern regardless of cell/tissue type, and it is especially diffi cult to fi nd reference genes that maintain stability between samples taken at different times or under different experimental conditions. Our primary objective was to identify genes with stable expression patterns across cell types, because many qPCR studies are conducted on cDNA extracted from tissues with a mixed cell population. There have been some studies relating to reference gene selection in other marine invertebrates(Siah et al., 2008; Leelatanawit et al., 2012). In the Pacifi c oyster(Crassostrea gigas), Adpribosylation factor 1(arf1)appeared to be the most robust reference for normalizing gene expression data across different tissues, making it potentially relevant in C . angulata and worth examination(Dheilly et al., 2011). There was little information concerning selection of reference genes in C . angulate . Thus, in the current study, we evaluated seven c and idate genes in different C . angulata tissues for qPCR normalization after a battery of strict quality controls, RNA quality assessment and consistent sample h and ling to reduce variability among triplicates. The reference genes obtained via geNorm analysis were effective internal controls for the normalization of the target Gβ gene, providing further validity for this analytical approach. The results showed that UBQ and β-TUB were the most robust reference genes for normalizing gene expression data in C . angulate .
Reference genes are ordinarily differentially regulated, especially among different marine invertebrates. In this study, we analyzed the expression stability of seven reference genes and found that most of the genes exhibited differential expression in various C . angulata tissues(Fig. 1). GAPDH displayed the highest expression variability, discouraging its use as an internal control(Tang et al., 2007). In molluskan studies, ACT is a commonly used reference gene (Castro et al., 2007; Sternberg et al., 2008); however, in this study, ACT- 2 ranked poorly, with low stability, thus limiting its use as an internal control(Fig. 2a). Similar results were noted during experimentation with E2-exposed mussels, with HEL(helicase) and ACT mRNA expression levels being highly affected by the stage of gametogenesis(Cubero-Leon et al., 2011). Likewise, a study examining O. edulis showed that β-actin was a less stable gene(Morga et al., 2010).
EF-1α and UBQ are involved in protein metabolism, and are widely used as internal controls for transcript profi ling(Zhong et al., 2008; Mallona et al., 2010). In O. edulis, GAPDH and EF-1a were combined as reliable reference genes when studying expression levels in hemocytes in contact with the parasite Bonamia ostreae and in hemocytes alone(Morga et al., 2010). Additionally, other studies have shown EF-1α to be well suited as a reference gene during temperature stress(Aursnes et al., 2011); however, our study showed that the expression of EF - 1α was less stable in various C . angulata tissues, making it less useful as a reference gene in this system. In the Yesso scallop(Patinopecten yessoensis), for different tissues, DEAD-box RNA helicase(HELI), ubiquitin (UBQ), and 60S ribosomal protein L16(RPL16)were the optimal combination of reference genes(Feng et al., 2013). In our study, UBQ was highly ranked, displaying a stable gene expression pattern, with a moderately high abundance, thus demonstrating the applicability of UBQ as a good internal control. Taken together, these fi ndings suggested that reference gene expression can vary during specifi c experimental conditions and among different species, thus requiring specifi c consideration for optimal data normalization. The fact that reference genes are not only involved in basal cell metabolism but are also involved in specifi c cellular functions may partly account for this point (Thellin et al., 2009).
The rRNA genes, especially 18S rRNA, are the mostly commonly employed reference genes for qPCR data normalization, yet our experiments showed that the 18S rRNA had low expression stability. However, some studies have shown that expressions of these genes can vary depending on developmental stages or in response to external treatment(Olsvik et al., 2005; Araya et al., 2008). By contrast, the 18S rRNA and rp-l8 displayed considerable expression stability during gonad development in both male and female hermaphrodite Nodipecten subnodosus(Llera-Herrera et al., 2012). In C . angulata, the 18S rRNA showed a varying expression pattern and exhibited inappropriate stability in the tissues analyzed by geNorm(Fig. 2a), which agreed with the previous reports(Araya et al., 2008). These fi ndings are not surprising, because the expression stability of a given reference gene may vary among different species. Hence, it is likely that 18S rRNA may not serve as a good internal control for gene profi ling in C . angulata ; however, its potential as an internal control in other organisms would require further investigation using analytical tools like geNorm.
Most research examining gene expression via qPCR analysis only uses one reference gene for normalization, although normalization using two or more reference genes appears to be more reliable(Vandesompele et al., 2002). In our study, geNorm analysis demonstrated that two genes would be required for accurate normalization(Fig. 2b). However, the number of reference genes used needs to balance accuracy and practical considerations, thus the default cut-off V value of 0.15 proposed by geNorm should not be taken too strictly, as suggested by the geNorm manual itself. The V3/4 value of 0.157 was slightly higher than the geNorm cut-off value, and thus three of the four most stable genes would be suggested for normalization. However, the expression of EF-1β varied across the samples(Fig. 1) and therefore could not be recommended as an internal control, leaving UBQ and β-TUB as the suitable internal controls for qPCR normalization in C. angulata.
For validation, we examined the expression of the Gβ gene in various C. angulata tissues by qPCR, using UBQ and β-TUB as the internal controls. The results were highly reproducible, demonstrating the reliability of UBQ and β-TUB as internal controls for normalization during expression analysis of C . angulata tissues(Fig. 3). Heterotrimeric GTP-binding proteins(G proteins, consisting of subunits Gα, Gβ, and Gγ)are signaling molecules found in a variety of eukaryotic organisms. GTP-binding proteins mediate lig and -binding signals from G protein-coupled receptors(GPCRs)to downstream pathways, and are involved in diverse cellular processes, such as visual photoreception, olfaction, taste, inflammation and secretion(Watson et al., 1994; Tsugama et al., 2013). In Pinctada fucata, in situ hybridization and northern blot analysis of pfGβ in five different tissues revealed that the pfGβ mRNA was expressed in many tissues (gill, gonad, mantle and digestive gl and )(Chen et al., 2005). Similarly, the Gβ mRNA was observed in all seven tissues tested, with no tissue specifi city noted in this study(Fig. 3)or in other studies( Lamsam-Casalotti et al., 1993). The expression of Gβ was the highest in the labial palp, followed by the hemolymph, adductor muscle, gill, mantle, gonad and visceral mass. The labial palp controls the amount of food ingested, and also sorts food by size or chemical composition before ingestion. The elevated expression of Gβ mRNA in the labial palp is consistent with these important functions. Additionally, Gβ mRNA is also expressed in other tissues, implying that the Gβ signal transduction pathway is widely used in C . angulata. However, unveiling the signaling architecture regulating physiological changes in C . angulata needs extensive investigation at the transcriptome and biological level.
5 CONCLUSIONTo the best of our knowledge, this is the fi rst study to evaluate c and idate Fujian oyster reference genes for qPCR. The most appropriate were UBQ and β-TUB. This study also demonstrated the importance of determining the statistical stability of reference genes in each experimental set, because the experimental conditions used may affect gene expression, as a reference for future studies.
| Andersen C L, Jensen J L, Ørntoft T F. 2004. Normalization of real-time quantitative reverse transcription-PCR data: a model-based variance estimation approach to identify genes suited for normalization, applied to bladder and colon cancer data sets. Cancer Research, 64 (15): 5 245- 5 250. |
| Araya M T, Siah A, Mateo D, Markham F, McKenna P, Johnson G, Berthe F C J. 2008. Selection and evaluation of housekeeping genes for haemocytes of soft-shell clams (Mya arenaria) challenged with Vibrio splendidus. Journal of Invertebrate Pathology, 99 (3): 326-331. |
| Aursnes I A, Rishovd A L, Karlsen H E, Gjøen T. 2011. Validation of reference genes for quantitative RT-qPCR studies of gene expression in Atlantic cod (Gadus morhua L.) during temperature stress. BMC Research Notes, 4 : 104. |
| Bustin S A. 2002. Quantification of mRNA using real-time reverse transcription PCR (RT-PCR): trends and problems. Journal of Molecular Endocrinology, 29 (1): 23-29. |
| Castro L F C, Melo C, Guillot R, Mendes I, Queirós S, Lima D, Reis-Henriques M A, Santos M M. 2007. The estrogen receptor of the gastropod (Nucella lapillus): modulation following exposure to an estrogenic effluent? Aquatic Toxicology, 84 (4): 465-468. |
| Chen L, Xie L P, Xiong X H, Dai Y P, Fan W M, Zhang R Q. 2005. Cloning and characterization of a novel G protein β-subunit of pearl oyster (Pinctada fucata), and its interaction sites with calmodulin. Comparative Biochemistry and Physiology Part B : Biochemistry & Molecular Biology, 142 (2): 142-152. |
| Cho Y S, Lee S Y, Kim K H, Nam Y K. 2008. Differential modulations of two glyceraldehyde 3-phosphate dehydrogenase mRNAs in response to bacterial and viral challenges in a marine teleost Oplegnathus fasciatus (Perciformes). Fish & Shellfish Immunology, 25 (5): 472- 476. |
| Cubero-Leon E, Ciocan C M, Minier C, Rotchell J M. 2011. Reference gene selection for qPCR in mussel, Mytilus edulis, during gametogenesis and exogenous estrogen exposure. Environmental Science and Pollution Research, 19 (7): 2 728-2 733. |
| Dheilly N M, Lelong C, Huvet A, Favrel P. 2011. Development of a Pacific oyster (Crassostrea gigas) 31, 918-feature microarray: identification of reference genes and tissueenriched expression patterns. BMC Genomics, 12 (1): 468. |
| Dondero F, Dagnino A, Jonsson H, Caprì F, Gastaldi L, Viarengo A. 2006. Assessing the occurrence of a stress syndrome in mussels (Mytilus edulis) using a combined biomarker/gene expression approach. Aquatic Toxicology, 78 (1): S13-S24. |
| Feng L Y, Yu Q, Li X, Ning X H, Wang J, Zou J J, Zhang L L, Wang S, Hu J J, Hu X L, Bao Z M. 2013. Identification of reference genes for qRT-PCR analysis in Yesso scallop Patinopecten yessoensis. PloS One, 8 (9): e75609. |
| Janská A, Hodek J, Svoboda P, Zámečník J, Prášil I T, Vlasáková E, Milella L, Ovesná J. 2013. The choice of reference gene set for assessing gene expression in barley (Hordeum vulgare L.) under low temperature and drought stress. Molecular Genetics and Genomics, 288 (11): 639-649. |
| Lamsam-Casalotti S, Onoda M, Papadopoulos V, Dym M. 1993. Developmental expression of GTP-binding proteins in rat testes. Journal of Reproduction and Fertility, 99 (2): 487-495. |
| Leelatanawit R, Klanchui A, Uawisetwathana U, Karoonuthaisiri N. 2012. Validation of reference genes for real-time PCR of reproductive system in the black tiger shrimp. PloS One, 7 (12): e52677. |
| Livak K J, Schmittgen T D. 2001. Analysis of relative gene expression data using real-time quantitative PCR and the 2-ΔΔCt method. Methods, 25 (4): 402-408. |
| Llera-Herrera R, García-Gasca A, Huvet A, Ibarra A M. 2012. Identification of a tubulin -α gene specifically expressed in testis and adductor muscle during stable reference gene selection in the hermaphrodite gonad of the lion's paw scallop Nodipecten subnodosus. Marine Genomics, 6 : 33- 44. |
| Mallona I, Lischewski S, Weiss J, Hause B, Egea-Cortines M. 2010. Validation of reference genes for quantitative realtime PCR during leaf and flower development in Petunia hybrida. BMC Plant Biology, 10 (1): 4. |
| Morga B, Arzul I, Faury N, Renault T. 2010. Identification of genes from flat oyster Ostrea edulis as suitable housekeeping genes for quantitative real time PCR. Fish & Shellfish Immunology, 29 (6): 937-945. |
| Niesters H G M. 2001. Quantitation of viral load using realtime amplification techniques. Methods, 25 (4): 419-429. |
| Nygard A B, Jørgensen C B, Cirera S, Fredholm M. 2007. Selection of reference genes for gene expression studies in pig tissues using SYBR green qPCR. BMC Molecular Biology, 8 (1): 67. |
| Olsvik P A, Lie K K, Jordal A E, Nilsen T O, Hordvik I. 2005. Evaluation of potential reference genes in real-time RTPCR studies of Atlantic salmon. BMC Molecular Biology, 6 : 21. |
| PfafflM W. 2001. A new mathematical model for relative quantification in real-time RT-PCR. Nucleic Acids Res., 29 (9): e45. |
| Setiawan A N, Lokman P M. 2010. The use of reference gene selection programs to study the silvering transformation in a freshwater eel Anguilla australis: a cautionary tale. BMC Molecular Biology, 11 (1): 75. |
| Siah A, Dohoo C, McKenna P, Delaporte M, Berthe F. 2008. Selecting a set of housekeeping genes for quantitative real-time PCR in normal and tetraploid haemocytes of soft-shell clams, Mya arenaria. Fish & Shellfish Immunology, 25 (3): 202-207. |
| Ståhlberg A, Åman P, Ridell B, Mostad P, Kubista M. 2003. Quantitative real-time PCR method for detection of B-lymphocyte monoclonality by comparison of κ and λ immunoglobulin light chain expression. Clinical Chemistry, 49 (1): 51-59. |
| Sternberg R M, Hotchkiss A K, Leblanc G A. 2008. The contribution of steroidal androgens and estrogens to reproductive maturation of the eastern mud snail Ilyanassa obsoleta. General and Comparative Endocrinology, 156 (1): 15-26. |
| Tang R, Dodd A, Lai D, McNabb W C, Love D R. 2007. Validation of zebrafish (Danio rerio) reference genes for quantitative real-time RT-PCR normalization. Acta Biochimica et Biophysica Sinica, 39 (5): 384-390. |
| Thellin O, ElMoualij B, Heinen E, Zorzi W. 2009. A decade of improvements in quantification of gene expression and internal standard selection. Biotechnology Advances, 27 (4): 323-333. |
| Tsugama D, Liu S, Takano T. 2013. Arabidopsis heterotrimeric G protein βsubunit, AGB1, regulates brassinosteroid signalling independently of BZR1. Journal of Experimental Botany, 64 (11): 3 213-3 223. |
| Vandesompele J, De Preter K, Pattyn F, Poppe B, Van Roy N, De Paepe A, Speleman F. 2002. Accurate normalization of real-time quantitative RT-PCR data by geometric averaging of multiple internal control genes. Genome Biology, 3 (7), http://dx.doi.org/10.1186/gb-2002-3-7-research0034. |
| Vorachek W R, Hugejiletu, Bobe G, Hall J A. 2013. Reference gene selection for quantitative PCR studies in sheep neutrophils. International Journal of Molecular Sciences, 14 (6): 11 484-11 495. |
| Vu H L, Troubetzkoy S, Nguyen H H, Russell M W, Mestecky J. 2000. A method for quantification of absolute amounts of nucleic acids by (RT)-PCR and a new mathematical model for data analysis. Nucleic Acids Res., 28 (7): e18. |
| Wang T, Liang Z A, Sandford A J, Xiong X Y, Yang Y Y, Ji Y L, He J Q. 2012. Selection of suitable housekeeping genes for real-time quantitative PCR in CD4+ lymphocytes from asthmatics with or without depression. PloS One, 7 (10): e48367. |
| Watson A J, Katz A, Simon M I. 1994. A fifth member of the mammalian G-protein β-subunit family. expression in brain and activation of the β2 isotype of phospholipase C. The Journal of Biological Chemistry, 269 : 22 150-22 156. |
| Zhai Z C, Yao Y C, Wang Y J. 2013. Importance of suitable reference gene selection for quantitative RT-PCR during ATDC5 cells chondrocyte differentiation. PloS One, 8 (5): e64786. |
| Zhang G, Zhao M M, Song C, Luo A X, Bai J F, Guo S X. 2012. Characterization of reference genes for quantitative realtime PCR analysis in various tissues of Anoectochilus roxburghii. Molecular Biology Reports, 39 (5): 5 905-5 912. |
| Zhang K, Niu S F, Di D P, Shi L D, Liu D S, Cao X L, Miao H Q, Wang X B, Han C G, Yu J L, Li D W, Zhang Y L. 2013. Selection of reference genes for gene expression studies in virus-infected monocots using quantitative real-time PCR. Journal of Biotechnology, 168 (1): 7-14. |
| Zhong Q W, Zhang Q Q, Wang Z G, Qi J, Chen Y J, Li S, Sun Y Y, Li C M, Lan X. 2008. Expression profiling and validation of potential reference genes during Paralichthys olivaceus embryogenesis. Marine Biotechnology, 10 (3): 310-318. |
| Zhu J F, Zhang L F, Li W F, Han S Y, Yang W H, Qi L W. 2013. Reference gene selection for quantitative real-time PCR normalization in Caragana intermedia under different abiotic stress conditions. PloS One, 8 (1): e53196. |