 2015, Vol. 33
Shanghai University
Article Information
- SAYEED Md. Abu, HOSSAIN Mostafa Ali Reza, WAHAB Md. Abdul, HASAN Md. Tawheed, SIMON Kumar Das, MAZUMDER Sabuj Kanti
- Water and sediment quality parameters in the Chalan Beel, the largest wetland of Bangladesh
- Chinese Journal of Oceanology and Limnology, 2015, 33(4): 895-904
- http://dx.doi.org/10.1007/s00343-015-4176-9
Article History
- Received Jul. 11, 2014
- accepted in principle Oct. 14, 2014
- accepted for publication Nov. 19, 2014


2 Faculty of Fisheries, Bangladesh Agricultural University, Mymensingh-2202, Bangladesh;
3 School of Environmental and Natural Resource Sciences, Faculty of Science and Technology, Universiti Kebangsaan Malaysia, 43600 UKM Bangi, Selangor, D. E., Malaysia;
4 Marine Ecosystem Research Center, Faculty of Science and Technology, Universiti Kebangsaan Malaysia 43600 UKM Bangi, Selangor, D. E., Malaysia
Beel is a Bengali term used for large,static waterbodies that accumulate surface run-off through one ormore internal drainage channels(Sirajul,2003). Thistype of shallow,seasonal water body is common inlow-lying floodplain areas throughout Bangladesh(Hossain et al., 2009). A Beel ecosystem isextraordinarily complex with wide temporal and spatial variations in many key parameters,includingdepth,nature of the catchment area or river basin,precipitation and duration of connection to a river(Sugunan and Bhattacharjya, 2000). Beels are oneimportant sources of fish supplies.
Chalan Beel is the largest of its kind in Bangladesh.It comprises a series of depressions interconnected byvarious channels to form one continuous sheet ofwater in the rainy season(July–November),when itcovers an area of about 375 km2(Hossain et al., 2009).During the dry winter and summer,the water areadecreases to 52–78 km2 and looks like a cluster ofBeels of different sizes(Shahnaz,2005; Hossain et al., 2009),providing excellent alluvial crop l and inthe post monsoon season. Now nearly deserted due todifferent Flood Control Drainage and Irrigation(FCDI)facilities and siltation,the originally largenumber of fish and aquatic organisms in this waterbody has diminished. About 100 000 fishermen livingin and around the Beel have been severely impacted owards loss of livelihood.
Bottom sediments and water are an importantfactor for its fertility and productivity. Soil is a majorcomponent of any aquatic environment,which notonly holds water for aquatic animals but also enrichesthe water body with the various nutrients required forbiological production(Saha,2003). Physico-chemicalproperties of water are very important as they serve asthe medium for living of all aquatic organisms. Thephysical and chemical reactions take place in theaquatic environment with the biotic communitiesboth individually and synergistically. A shift in thedesired level of physico-chemical properties affectsthe productivity chain adversely and as a result,theentire aquatic productivity equilibrium is disrupted.Major or rapid changes in these parameters may resultin fish kills. Fishes are more dependent on watertemperature,pH,dissolved oxygen,free carbondioxide,alkalinity,hardness, and salinity for growth and development. Any change of these parametersmay affect the growth,development and maturity offish(Jhingran,1991).
At present,Chalan Beel,like many other beels,isat the risk of partial or total degradation due tomanifold reasons like agricultural encroachmentincluding pesticide use,siltation and otheranthropogenic activities. However,it is difficult tosay how much degradation has occurred and howthese problems can be solved. Therefore,acomprehensive study on the Chalan Beel seems to bevery timely and necessary. The objective of this studyhas been to elucidate the water and sediment qualityparameters of Chalan Beel,the largest wetl and ofBangladesh.
2 MATERIAL AND METHOD 2.1 Study areaThe Chalan Beel is situated at 24.35°–24.70°N and 89.10°–89.35°E(Fig. 1). Historically,Chalan Beelwas spread over the Upazilas(Sub-districts)of thedistricts of Rajshahi(Paba,Bagmara and Mohonpur),Pabna(Chatmohor,Bhangura and Faridpur),Sirajgong(Tarash,Ullapara,Raigonj, and Shahjadpur),Natore(Sadar,Singra,Gurudaspur, and Baraigram),Naogoan(M and a,Raninagar, and Atrai) and Bogra(N and igram). However,presently the beelhas been squeezed and now lies only in the districts ofPabna,Sirajgonj, and Natore due to crisscross roads,embankments, and other infrastructural development.Therefore,the research was conducted in threerepresentative cluster sites in the above districts. Atthe experimental site,three cluster sites covering ariver,a canal, and a beel were selected for this study.The cluster sites were the Gumani and its adjacentfloodplains as(CS1: the Gumani)under Natore,theKatagang and its adjacent floodplains as(CS2: theKatagang)under Sirajgong and the Baral, and itsadjacent floodplains as(CS3: the Baral)under Pabnawhere the sampling for CAS and FES were performed(Fig. 1). The water and sediment samples werecollected from these sites and quality parameters wereanalyzed. GIS mapping was carried out covering allthe areas.
 |
| Fig. 1 The study site Chalan Beel showing in the map of Bangladesh(Source: Hossain et al., 2009) |
Water and soil samples were collected monthly.Samples were taken from three places and were mixedto make one sample with three replicates for eachcluster site over one year. On the sampling date,someparameters were measured in the field and otherparameters samples were measured in the laboratoryof the Faculty of Fisheries(FoF),BAU and in the SoilResource Development Institute(SRDI)regionaloffice,Dhaka. The sediments were analyzed in fourmajor seasons,namely in the months of August,October,January, and April. The physico-chemicalparameters of water such as surface water temperature,transparency,depth,pH,conductivity,total dissolvedsolids(TDS),total alkalinity(TA),nitrate nitrogen(nitrate-N),phosphate phosphorus(phosphate-P) and ammonia nitrogen(NH3-N)were monitored monthly.The sediment properties included pH,organic matter(%),total nitrogen(%),available phosphorous(available-P) and exchangeable potassium(exchangeable-K).
On each sampling date,water samples werecollected from three sites with three replicates and were stored in clean white plastic bottles. One hundredml of water samples from each of the bottles werefiltered through 47-μm glass fiber paper(WhatmanGF/C) and were acidified(pH≤2)for nutrient analysesfollowing the methods described by Stirling(1985).The beel sediment samples were collected forlaboratory analyses at the time of water samplecollection from the cluster sites at each season at0–15 cm depth. The samples were then air-dried at room temperature and the stones,gravel,plant roots,leaves etc. were picked up and removed, and thenground and sieved through a 20-μm size sieve.Finally,these samples were preserved in polythenebags for laboratory analysis.
2.3 Methods for water and sediment analysesSurface water temperature was recorded using athermometer. Transparency was measured by ast and ard Secchi disc of 25 cm diameter and waterdepth was measured by graduated bamboo pole fixingto the bottom soil in every sampling spot. The waterpH value was determined by a digital pH meter(Model-HANNA-HI-9142) and pH of the sedimentwas measured by a glass electrode pH meter usingsediment: water suspension ratio of 1:2.5 as describedby Jackson(1962). Conductivity and total dissolvedsolids(TDS)were measured through a conductivitymeter(JENWAY Model 4200). Surface watertemperature,transparency,water depth,pH,conductivity,total dissolved solids(TDS)wererecorded on the spot in the sampling sites.Determination of nitrate-N(NO3-N),phosphate-P(PO4-P) and ammonia nitrogen(NH3-N)wereperformed on filtered neutral samples(pH≤7)by aHach kit(DR/2010 Spectrophotometer)in the waterquality laboratory,Bangladesh Agricultural University,Mymensingh. Total alkalinity was determinedfollowing the methods described by Stirling(1985)inthe same laboratory. The percent organic carbon ofsediment was determined volumetrically by wetoxidation methods of Walkley and Black(1935). Totalnitrogen of sediment was estimated by Micro-Kjeldahlmethod(Page et al., 1989). Available-P was extractedfrom the sediment by shaking 0.5 mol/L NaHCO3solution(pH 8.5)following the method Olsen et al.(1954). Exchangeable-K was estimated with the helpof flame photometer following the method describedby Jackson(1962).
2.4 Statistical analysisFor statistical analysis of water and sedimentquality parameters,one-way analysis of variance(ANOVA)was performed and also compared in arepeated measure ANOVA. If the main effect wasfound significant,the ANOVA was followed byDuncan’s Multiple Range Test(DMRT)to comparethe variations among the treatments means. Allstatistical tests were carried out at a 5% significancelevel using SPSS software.
3 RESULT 3.1 Physico-chemical parameters of the waterThe mean values of physico-chemical parameters atthree sites in the Chalan Beel were determined(Table 1) and the seasonal trends of each parameter at threesites and their interactions and effects in the ChalanBeel are shown in different figures(Figs.2–11).
 |
| Fig. 2 Monthly variations of water depth at three sites during study period |
 |
| Fig. 3 Monthly variations of water temperature at three sites during study period |
 |
| Fig. 4 Monthly variations of total transparency at three sites during study period |
 |
| Fig. 5 Monthly variations of water pH at three sites during study period |
 |
| Fig. 6 Monthly variations of total alkalinity at three sites during study period |
 |
| Fig. 7 Monthly variations of conductivity at three sites during study period |
 |
| Fig. 8 Monthly variations of total dissolved solids at three sites during study period |
 |
| Fig. 9 Monthly variations of ammonia-N at three sites during study period |
 |
| Fig. 10 Monthly variations of nitrate-N at three sites during study period |
 |
| Fig. 11 Monthly variations of phosphate-P at three sites during study period |
Among the three sites,the average maximum waterlevel(452±14 cm)was observed during September(post monsoon) and the average minimum level(83±25.86 cm)during late February in the Katagang.The seasonal pattern was that the water level at threesites increased from the end of pre-monsoon(June)until October(early post-monsoon),then decreasing until the pre-monsoon(Table 1 and Fig. 2). Water temperature showed similar variations in differentmonths of the year at different sites. The recordedtemperature of water in the study sites over the periodfrom July 2007 to June 2008 was found to vary from19°C to 33°C. The highest water temperature(33.5°C)monitored in September at the Gumani was closelyfollowed by the Katagang(32.8°C) and at the Baral(32.3°C)whereas the lowest temperature(19.5°C)was observed in the month of January at the Katagangsite followed by the Gumani(19.7°C) and the Baral(20.7°C). The average values of water temperatures atthe three different sites were 27.9±4,27.7±4.2 and 27.5±4.1 in the Baral,Gumani and Katagangrespectively(Table 1 and Fig. 3).
 |
Mean values of transparency and pH observed atthe different sites in the Chalan Beel varied seasonally(Table 1). The highest Secchi depth was(278 cm)measured at Baral site in October followed by theGumani and the Katagang in October and August,respectively. The minimum transparency was 45 cmexhibited by the Baral site during March,that wasclosely followed by the Katagang and the Gumanisite,respectively in February(Fig. 4). The maximumwater pH value was recorded at the Gumani site inFebruary, and the minimum value was recorded at theBaral site in October(Fig. 5). Fluctuating trends of pHin different sites of the Chalan Beel indicated that pHvalue gradually increases after November and continues up to March,again decreasing until June. The water of the beel remained alkaline throughoutthe study period within a range favorable for goodbiological production.
The mean values of alkalinity and conductivity arepresented in Table 1. The values of total alkalinity asrecorded from the Gumani,the Katagang, and theBaral sites were found to range from 68.00 to226.00 mg/L. The maximum value of total alkalinity(226.00 mg/L)was recorded from the Katagang duringMarch, and the least(68.00 mg/L)from the same sitein July. The seasonal trend of total alkalinity wasalmost similar except for two distinct peaks observedat the Katagang and Baral sites in March and May(Fig. 6). Conductivity of the water at the different sitesof Chalan Beel ranged from 111.10 to 710.00 μs/cmduring the study period. The highest value ofconductivity(710.00 μs/cm)was recorded in Aprilfrom the Katagang site and the lowest conductivity(42.25 μs/cm)in September from the same site.Conductivity showed significant(P<0.05)differenceamong the sites and months studied. A more or lesssimilar trend of conductivity exhibited by all the sitesexcept for one prominent peak in May, and twomoderate peaks in November and January at theKatagang site,two moderate peaks in April and May atthe Baral site,one in April at the Gumani site and in theChalan Beel recorded during the study period(Fig. 7).
The mean values of total dissolved solids(TDS)atthe different sites in the Chalan Beel were within thesuitable range which showed significant(P<0.01)difference(Table 1). It ranged between 68.10 and 425.30 mg/L and exhibited more or less similar trendat all the sites except for one prominent peak in May,two moderate peaks in November and January at theKatagang site and one moderate peaks in April at theBaral site and one in April at all three sites(Fig. 8).The maximum value of ammonia(1.89 mg/L)wasrecorded from the Baral site during October,whereasthe lowest(0.01 mg/L)was from the Gumani in July,from the Katagang in July and April and from theBaral site in August,November,December and April.The seasonal trend of ammonia nitrogen was almostsimilar except for two distinct peaks observed at theKatagang site in October and May and at the Baralsite in June,at the Gumani site a moderate peak inOctober and at the Baral site in March,while a moreor less similar trend was observed also except for apeak in March in the Chalan Beel(Fig. 9).
The nutrient concentrations,as nitrate-N(NO3-N),ranged between 0.01 and 0.33 mg/L at the differentsites. The mean values at the Gumani,the Katagang and the Baral site are shown in Table 1. The highestnitrate-N concentration(0.33 mg/L)was found inMarch and lowest one observed in January and Juneat all three sites. The nitrate-N concentrations followed a more or less similar pattern from July to January and then increased gradually until Mayexcept for an abnormal peak in March and sudden fallin October at all the sites(Fig. 10). The values ofPO4-P ranged between 0.13 to 9.12 mg/L at theGumani,the Katagang and the Baral sites. The highestconcentration(9.27 mg/L)of phosphate-P wasrecorded in April at the Katagang site,followed by theBaral(9.12 mg/L) and the Gumani site(8.32 mg/L),whereas the lowest(0.13 mg/L)occurred in Octoberat the Gumani site(Fig. 11). The concentrations ofphosphate-P in water in all the sites showed more orless similar trend except one abnormal peak inOctober and two moderate peaks in November and December at the Gumani site,one abnormal peak inMay and moderate in June at the Katagang and oneabnormal peak in June and two moderate peaks inMarch and May at the Baral site.
3.2 Sediments quality parametersChemical parameters of bottom sediment includingpH,organic matter(OM%),total nitrogen(TN%),available phosphorus(available-P),potassium(exchangeable-K)were recorded at the three sites inthe Chalan Beel during the study period(Table 2).
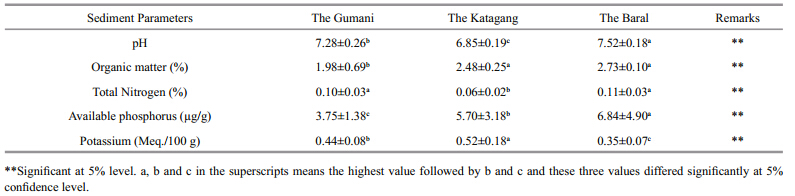 |
The pH values of sediment at the different sites ofthe Chalan Beel were found to range from 6.50 to7.80. The mean values at the Gumani,the Katagang and the Baral site in the Chalan Beel are presented inTable 2. The mean values of pH differed significantly(P<0.05)among the sites and showed more or lesssimilar trends throughout the study period(Fig. 12).The highest pH value observed at the Baral site inApril and the lowest at the Katagang site in January. Organic matter(%)varied from 1.12% to 2.90% atdifferent sites in the Chalan Beel. The mean values ofOM(%)differed significantly(P<0.05)among sites(Table 2). The mean OM(%)values showed more orless similar trends throughout the study period exceptfor two abnormal drops in October and January at theGumani site(Fig. 13).
 |
| Fig. 12 Trends of soil pH values at three sites in Chalan Beel during study period |
 |
| Fig. 13 Trends of organic matter(%)at three sites in Chalan Beel during study period |
The concentrations of total nitrogen(TN)in theBeel sediment at different sites varied from 0.07% to0.16%,0.04% to 0.08% and 0.06% to 0.15%, and their mean values are shown in Table 2 and Fig. 14.The values of TN(%)at the Katagang site were lowestin dry season and highest in the monsoon. The valuesof available-P are ranged from 2.07 to 5.94,2.19 to10.21 and 2.01 to 14.25 Meq./100 g at the Gumani,the Katagang and the Baral sites,respectively and differed significantly(P<0.05) and exhibited more orless similar trends except for an abnormal peak inJanuary at the Baral site(Fig. 15).
 |
| Fig. 14 Trends of total nitrogen at three sites in Chalan Beel during study period |
 |
| Fig. 15 Trends of available phosphorus at three sites in Chalan Beel during study period |
Concentrations of sediment exchangeable-Kvaried from 0.34 to 0.57,0.33 to 0.75 and 0.25 to0.45 Meq./100 g at the Gumani,the Katagang and theBaral site,respectively. The amount ofexchangeable-K showed more or less similar trendsthroughout the study period except for two abnormalpeaks in August and October at the Katagang site and for two moderate peaks in August and April at theGumani site(Fig. 16).
 |
| Fig. 16 Trends of exchangeable potassium at different sites during study period |
Water quality parameters play an important role inthe primary productivity of any aquatic ecosystem.The total biological productivity is directly influencedby the primary productivity. The existence,growth,production and well-being of aquatic life are mediatedthrough a chain of interacting physical and chemicalparameters of the water. Aquatic organisms boomwell under congenial physico-chemical conditions.Water quality is represented by some chemicalparameters that regulate aquatic life within favorableranges. Major and rapid changes of these parametersmay result in fish kills. Any change of parametersmay affect the growth,development and maturity offish(Jhingran,1991).
The maximum water level in the Chalan Beel isattained during October(post monsoon) and remainedat a minimum level during late February until June.This is caused by levels of rainfall and flood water,which gradually increase water levels in the Beelduring monsoon flood which once again continuesuntil post monsoon. This concurs with the findings of Saha(2007)at Boro Beel in the North West region, and Hasan(2008)in the old Bhramaputra River,Bangladesh. According to Santhosh and Singh(2007)the fluctuations of water temperature were in the suitable range(24 and 30°C)for fisheries in the Chalan Beel. Higher temperatures observed fromJune to September and lower ones in the month ofDecember and January concur with an earlier report(Ehshan et al., 1996). It is established that a watertemperature in the range of 25 to 32°C is optimal forgrowth of fish. However,in cold seasons fromDecember to February fish can survive,but theirgrowth becomes slower as they take less food(Santhosh and Singh, 2007). Thus,considering watertemperature,the Chalan Beel is suitable for optimalgrowth and survival of fish. Secchi depth is considereda relatively reliable indicator of biological productivityin low productivity water bodies(Hasan and Middendorp, 1998). A marked seasonal difference inwater transparency as the highest Secchi depth(278 cm)in October and the minimum(45 cm)inFebruary was measured in Chalan Beel. Watertransparency after summer(April–May)graduallyincreased to attain a maximum in winter(NovemberDecember),which was due to settling of suspended particles coupled with lesser disturbances in waterbecause of tranquil condition prevailing in thereservoir(Sukumaran and Das, 2005). The water ofBeels remained slightly alkaline in reaction throughoutthe period,which was favorable for good biologicalproduction. Boyd(1982)concluded that fishes and prawns grow well at pH 6.0 to 9.0; they die at pH 4.0 and show distress at 10.0 to 11.0. The pH of water asobserved in the present study fluctuated within anarrow range and always remained neutral tosufficiently alkaline,which agreed with the findingsof Saha and Hossain(2002), and Sukumaran and Das(2005). The values of total alkalinity as recorded torange from 68.00 to 226.00 mg/L. The higheralkalinity may be due to higher carbon dioxideconcentration and release of bicarbonates ions in thedry season by sediments. Alikunhi(1957)stated thatin highly productive ponds the alkalinity should beover 100 mg/L. Sugunan(1995)reported that totalalkalinity above 40 mg/L is indicative of highproductivity. Thus,the beel will support good fishproduction.
Conductivity of the beel water are ranged from111.10 to 710.00 μs/cm where the highest value(710.00 μs/cm)was recorded in May and the lowest(111.7 μs/cm)was noted in September. According to Boyd(1982)conductance of freshwaters often rangesfrom 25 to 500 μs/cm,which also indicates that theBeel is in a suitable range except in May at Katagangsites,where there may be excess organic loading and excess use of calcium- and magnesium-enriched products in the surrounding cropl and s. Mustapha(2008)reported that the low conductivity might beresponsible for the soft nature of the water. Increasedconcentration of cations such as calcium,magnesium, and sulfate during the rains might be responsible forhigher conductivity of the water at that period. Pescod(1992)grouped domestic wastewaters depending onthe total dissolved concentration as strong(more than850 mg/L),medium(up to 700 mg/L) and weak(lessthan 250 mg/L). TDS values were observed rangingfrom 68.0 to 425.0 mg/L with significant(P<0.05)difference among the sites and months and exhibitedmore or a less similar trend in all the sites throughoutthe study period except for one prominent peak inMay. The highest values might be due to sedimentationof unused agrochemicals from the high yielding ricecrops and driven by run-off after rains(Mishra et al., 2008). Mustapha(2008)reported that high values ofTDS in the rains might be attributed to run-off fromsediment and the catchment watershed. The values ofammonia nitrogen as recorded from Chalan Beelranged from 0.01 to 1.89 mg/L at different sites withmean values less than or equal to 0.33 mg/L. Themaximum value of ammonia(1.89 mg/L)wasrecorded during October and the lowest(0.01 mg/L)in April. The seasonal trend of ammonia nitrogen wasalmost similar except for two distinct peaks observedin October,May, and June. The higher values mightbe due to run-off from sugar-mill effluents and thehuman activities from upstream. The nutrientconcentrations as nitrate-N(NO3-N)ranged from0.01 to 0.33 mg/L at different sites in Chalan Beel, and agreed with the findings of Halder et al.(1992)inKaptai Lake,Bangladesh. Saha(2007)obtained thenutrient concentration as nitrate nitrogen ranged from1.12 to 3.17 mg/L in three Beels in NorthernBangladesh. The NO3-N content indicated that Beelwas in productive status.
In most natural surface water,phosphorus rangesfrom 0.005 to 0.020 mg/L(Chapman,1992).Banerjea(1967)reported that more than 0.2×10⁻⁶ ofnitrate and phosphate is characteristic of productivewaters. The ranges of phosphate-P were 0.13 to9.27 mg/L at different sites in the Chalan Beel. Theaverage concentrations of phosphate phosphorus ofwater in all the sites of Chalan Beel remained highbecause of agricultural encroachment and sewageunoff from the surroundings,which was supportedby the previous documented report(Mustapha,2008).
4.2 Sediment quality parametersSoil is a major component of any aquaticenvironment,which not only holds water for aquaticanimals but also enriches the water body withvarious nutrients required for biological production(Saha,2003). However,the exchange rate ofnutrients from bottom soil to water depends upontemperature,pH, and nutrients in the water(Oppenheimer et al., 1978). The pH value ofsediment is an important factor for regulating waterquality for aquaculture. The pH values of sedimentat different sites of the Chalan Beel varied aroundneutral,ranging from 6.50 to 7.80 and differedsignificantly(P<0.01)among the sites and more orless similar values were observed throughout thestudy period which indicated that the habitat wasfree of major pollution. The highest pH value wasobserved in April,which might have been due tosettlement of the pollutants in the sediment in thedry season(Alam et al., 2007; Saha,2007). Organicmatter(%)varied between 1.12% and 2.90% in theChalan Beel and it was more or less similarthroughout the study period except a fewer abnormaldrops in October and January which might be due todecomposition of organic matter in nature whichwas in agreement with Saha(2007). The observedconcentration of total nitrogen(TN)in the Beelsediment at different sites varied from 0.04% to0.15% in the Chalan Beel,which agrees with Saha(2007). The observed value was low throughout thestudy period. The reason behind this might be due toless nitrifying bacteria or the right conditions forreleasing nitrogen(Mishra et al., 2008). Available-Pis ranged from 2.01 to 14.25 Meq./100 g with a meanvalue of 5.43±3.60 Meq./100 g in the Chalan Beel,which differs significantly(P<0.01)at differentsites, and exhibits more or less similar valuesthroughout the study period with a few exception indry season(January) and in summer(April)which isin agreement with Alam et al.(2007). Concentrationsof exchangeable-K in sediment at different sites inthe Chalan Beel were found in a suitable range(from0.25 to 0.75 Meq./100 g),which differs significantlyamong sites and the amount of exchangeable-K wasmore or less similar over the study with a fewexceptions in wet season. These abnormalities mightbe due to polluted run-off water from upstream millsin the wet season and the cause of abnormal peak inthe dry season(April)might be due to sudden shower and run-offs of agricultural fields.
5 CONCLUSIONThe physicochemical properties of Chalan Beel arewithin the tolerance limits with a few excessive valuesmainly for ammonia and phosphate as recordedduring July 2007 to June 2008. Therefore,the waterof Chalan Beel is suitable for irrigation and for thegrowth of aquatic fauna and flora. No parasitic orfungal infection was found on prawns or aquaticplants or even on fish during the study period. Fewdeveloping unplanned and unregulated mills on theupstream may create problem in the near future.Presently it had no observable significant impact onthe flora and fauna. However,fluctuations in physicochemical parameters,if they continue,would result inimbalance in the ecosystem in long run. Thus,caremust be taken not to destroy the natural ecosystem and disturb the ecological balance by developinghuge numbers of unplanned industrial establishments and agricultural development in this area. Suggestionssolicited by the stakeholders most dependent on theresource in relation to habitat restoration,biodiversityconservation,as well as increased fish production,asrational use of pesticides,inorganic fertilizers and proper management of industrial effluents;maintenance of minimum 1 m water depth duringwater extraction from critical water bodies;establishment of more Community-BasedOrganizations(CBO). Finally,it is imperative thatefforts must be taken to develop ecosystem-basedmanagement strategies with inputs from scientists,resource managers,policy makers,government and non-government organizations and other stakeholders,with the objectives of enhancing production,maintaining biodiversity in a sustainable manner and improving the livelihoods of the remaining highlymarginal fishermen in the largest wetl and ofBangladesh—the Chalan Beel.
| Alam A A, Mustafa M G, Azad M A K. 2007. Water and sediment quality and plankton diversity of Posna Beel, Tangail. Bangld. J. Fish., 30 (S): 177-188. |
| Alikunhi K H. 1957. Fish Culture in India. Farm Bulletin No. 20. Indian Council Agricultural Research, New Delhi, India.144p. |
| Banerjea S M. 1967. Water quality and soil condition of fish ponds in some states of India in relation to fish production. Ind. J. Fish., 14 (1-2): 115-144. |
| Boyd C F. 1982. Water Quality Management for Pond Fish Culture. Elsevier Science Publication, The Netherlands.318p. |
| Chapman D. 1992. Water Quality Assessment. Chapman and Hall, London. p.51-119. |
| Ehshan M A, Hossain M S, Mazid M A, Mollah M F A, Rahman S, Razzaque A. 1996. Limnology of Chadna beel. Banglad esh J. Fish. Res., 1 : 31-40. |
| Halder G C, Mazid M A, Ahmed K K. 1992. Limnology and primary production of Kaptai Lake, Bangladesh. In : de Silva S S ed. Reservoir fisheries of Asia. Proc. of the Second Asian Reservoir Fisheries Workshop, Hangzhou, China. IDRC, Ottawa. p.2-11. |
| Hasan M A N G M. 2008. Hydrographic Status, Natural Food Abundance and SIS Biodiversity in Matshyarani Fish Sanctuary. MS Thesis, Bangladesh Agricultural University, Mymensingh. 46p. |
| Hasan M R, Middendorp H A J. 1998. Optimising stocking density of carp fingerlings through modelling of the carp yield in relation to average water transparency in enhanced fisheries in semi-closed water bodies in western Bangladesh. In : Petr T ed. Inland Fishery Enhancements, Dhaka, Bangladesh. FAO Fisheries Technical Paper. No. 374, Rome, Italy. p.159-168. |
| Hossain M A R, Nahiduzzaman M, Sayeed M A, Azim M E, Wahab M A, Olin P G. 2009. The Chalan beel in Bangladesh: Habitat and biodiversity degradation, and implications for future management. Lakes & Reservoirs : Research & Management, 14 (1): 3-19. |
| Jackson M L. 1962. Soil Chemical Analysis. Constable and Co. Ltd., London. 498p. |
| Jhingran V G. 1991. Fish and Fisheries of India. 2nd edn. Hindustan Publishing Corporation, New Delhi, India. 727p. |
| Mishra R R, Rath B, Thatoi H. 2008. Water quality assessment of aquaculture ponds located in Bhitarkanika mangrove ecosystem, Orissa, India. Turk. J. Fish. Aquat. Sci., 8 : 71- 77. |
| Mustapha M K. 2008. Assessment of the water quality of Oyun Reservoir, Offa, Nigeria, using selected physico-chemical parameters. Turk. J. Fish. Aquat. Sci., 8 : 309-319. |
| Olsen S R, Cole C V, Watanabe F S, Dean L A. 1954. Estimation of available phosphorus in soils by extraction with sodium bicarbonate. U. S. Dep t. of Agriculture.929p. |
| a> |
| Oppenheimer J R, Ahmed M G, Huq A, Haque K A, Alam A K M A, Aziz K M S, Ali S, Haque A S M M. 1978. |
| Limnological studies of three ponds in Dhaka. Bangl adesh J. Fish., 1 (1): 1-28. |
| Page A L, Miller R H, Kenney D R. 1989. Methods of Soil Analysis. Part-II, 2nd edn, American Society of Agronomy. Inc. Madison, Wisconsin, USA. p.403-430. |
| Pescod M B. 1992. Wastewater Treatment and Use in Agriculture. University of Newcastle-upon-Tyne Newcastle-upon-Tyne, UK. p.3-4. |
| Saha B K, Hossain M A. 2002. Saldu beel fishery of Tangail. Bangladesh J. Zool., 30 (2): 187-194. |
| Saha J K. 2007. Assessment of Aquatic Biodiversity in Three Beels of Bangladesh and Its Relationship with Environmental Parameters. Bangladesh Agricultural University, Mymensingh. 275p. |
| Saha P K. 2003. Soil characteristics of importance in aquatic ecosystem in relation to fish health. In : Sugunan V V, Das M K, Vinci G K, Bhaumik U eds. Methods of Assessment of Aquatic Ecosystem for Fish Health Care. Bull. No. 115. Central Inland Capture Fisheries Research Institute, Barrackpore, India. p.66-69. |
| Santhosh B, Singh N P. 2007. Guidelines for water quality management for fish culture in Tripura. ICAR Research Complex for NEH Region, Tripura Center, Publication no.29. |
| Shahnaz K. 2005. Drastic fall in Chalan Beel fish production, Holiday. Internet edition. http://www.weeklyholiday.net/2005/090905/env.html |
| Sirajul I. 2003. Banglapedia: National Encyclopedia of Bangladesh. 1 st edn. Asiatic Society of Bangladesh, 2003. Dhaka, Bangladesh. Available from www.banglapedia.org . |
| Stirling H P. 1985. Chemical and Biological Methods of Water Analysis for Aquaculturists. Institute of Aquaculture, University of Stirling, Stirling FK9 4LA, Scotland. p.118- 119. |
| Sugunan V V, Bhattacharjya B K. 2000. Ecology and Fisheries of Beels in Assam. Central Inland Fisheries Research Institute. Bull. No. 104. Barrackpore, India. 65p. |
| Sugunan V V. 1995. Reservoir Fisheries of India. FAO Technical Paper No. 345. Rome, FAO. 423p. |
| Sukumaran P K, Das A K. 2005. Limnology and fish production efficiencies of selected reservoirs of Karnataka. Indian J. Fish., 52 (1): 47-53. |
| Walkley A, Black I A. 1935. Organic carbon in methods of soil water analysis. In : Black C A ed. Chemical and Microbiological Properties. Part 2, American Society of Agronomy. Inc. Publisher, Madison, Washington, USA. 25p. |