 2015, Vol. 33
Shanghai University
Article Information
- HAN Dongyan (韩东燕), XUE Ying (薛莹), REN Yiping (任一平),, MA Qiuyun (麻秋云)
- Spatial and seasonal variations in the trophic spectrum of demersal fish assemblages in Jiaozhou Bay, China
- Chinese Journal of Oceanology and Limnology, 2015, 33(4): 934-944
- http://dx.doi.org/10.1007/s00343-015-4242-3
Article History
- RReceived Sep. 5, 2014;
- accepted in principle Nov. 19, 2014;
- accepted for publication Jan. 7, 2015


As the gradual transition of dominant fish species in marine ecosystem from long-live and high trophic level(TL)fishes toward short-live and low TL fishes(Pauly et al., 1998),fisheries management progressively move from single species to ecosystem based management(Cury et al., 2005; Garcia and Cochrane, 2005; Greenstreet and Rogers, 2006). Trophic structure of fish communities is a fundamental basis for ecosystem-based fisheries management(Chambers and Dick, 2005; Hajisamae and Ibrahim, 2007). One approach to study the trophic structure of fish communities is to define trophic groups by calculating the food similarity index betweeNfishspecies(Dolgov,2009; Specziárand Rezsu, 2009; Horinouchi et al., 2012). However,the definition of trophic groups is difficult because of the high diversity of food habits and the lack of dietary information for many fishes,which makes it difficult to compare fish trophic structure among different ecosystems(Bozec et al., 2005). Recently,TL appears to be a promising way of analyzing marine ecosystems(Gascuel et al., 2005).
Jiaozhou Bay is a typical semi-enclosed bay situated in the southern Sh and ong Peninsula of China,connecting with the Yellow Sea through a narrow mouth, and its mean water depth is 7 m(Wang,1993). It is an important marine ecosystem,in which 113 fish species were found in the 1980s, and most of these fishes were commercial fish species like Paralichthysolivaceus,Liza haematocheila,Konosirus punctatus, and so on(Liu,1992). However,in recent years this bay has been greatly impacted by heavy fishing pressure and other human activities such as aquacultures,ports and cross-sea bridge(Zhang et al., 2011). The area of Jiaozhou Bay decreased from 552.3 km2in 1935 to 356.6 km2in 2005(Zhou et al., 2010). The number of marine species in Jiaozhou Bay has also decreased sharply in the past 30 years, and the dominant fish species has been replaced by small demersal fishes such as Amblychaeturichthyshexanema and Chaeturichthys stigmatias(Mei et al., 2010). Even so,Jiaozhou Bay is still an important spawning and nursery ground,with more than 40 juvenile fish species being captured in 2009,including many commercially important species such as Sebastods schlegeli and Pseudopleurnectesyokohamae(Zeng et al., 2012). To better protect the biological resource,the Jiaozhou Bay Wetl and Specially Protected Area was established in 2009. In such situation,there is an urgent need to investigate the status of Jiaozhou Bay ecosystem especially the fish communities. Most of the previous studies oNfishcommunities of Jiaozhou Bay focused on the fish species composition(Zeng et al., 2004,2012; Mei et al., 2010; Xu et al., 2010). However,the trophic structure of fish community in Jiaozhou Bay hasn’t been reported before.
The trophic spectrum,proposed by Gascuel et al.(2005) and defined as the distribution of biomass,abundance,or catch by TL,could be used as an indicator of the trophic structure and function of aquatic ecosystems. Trophic spectrum classifies each fish species by their position in the food web,which could avoid the subjective judgement in definition of feeding category and provide important insights into the ecological effect of exploitation on marine ecosystems(Libralato and Solidoro, 2010; Gasche and Gascuel, 2013). This methodology has been used successfully on historical data of abundance and biomass of marine species(Gascuel et al., 2005; Muny and orero, 2006). The TL used in the building of trophic spectra could be estimated from the stomach content analysis(Zhang et al., 2007; Chassot et al., 2008)or stable isotope analysis(Post,2002; Nilsen et al., 2008; Vizzini and Mazzola, 2008). The stable isotope analysis may give more consistent trophic value because it integrates prey diet over a period range from a few months to more than one year,depending on the turnover rate of tissues(Chassot et al., 2008),while the stomach content analysis is biased on recent dietary items and preys(Polito et al., 2011).
In this study,fish biomass and abundance trophic spectra were built to study the trophic structure of demersal fish assemblages in Jiaozhou Bay. The fractional trophic positions of most fish species were calculated by the stable isotope analysis in order to provide stable and accurate information of trophic structure. The spatial and seasonal variations in the trophic structure were also examined in this study. Finally,we compared the properties of fish abundance and biomass trophic spectra in description of fish tropic structure. 2 MATERIAL AND METHOD 2.1 Sample strategy
Fish samples were collected from four seasonal bottom trawl surveys in Jiaozhou Bay(35°59′–36°07′N,120°13′–120°23′E)during winter(February),spring(May),summer(August), and autumn(November)of 2011. Because most inshore area in Jiaozhou Bay with water depth less than 5 m was occupied by shellfish aquaculture,sampling stations were sited outside this area. This survey employed a stratified r and om-sampling design with strata defined by embayment degree. Sampling area was divided into three parts based on the embayment degree: inner bay,bay mouth and outer bay(Fig. 1). During each survey,a total of 12 sampling stations were r and omly selected, and the number of stations per stratum was 5,3 and 4,respectively. The surveys were conducted in the daytime using 10 mm stretched mesh size of cod-end,with tow duration 30 min at speed of 2 knot an hour approximately. Samples were placed into foam boxes with ice and transported to the laboratory where they were frozen for later processing.
 |
| Fig. 1 Map showing the sampling areas and r and om stations during each season in Jiaozhou Bay(black dots) |
Fish samples collected in Jiaozhou Bay during May and November of 2011 were used for stable isotope analyses,including A. hexanema,C ynoglossuslighti,Pholis fangi, and so on. Muscle tissue was removed from the dorsum of larger fishes,whereas whole specimens removed skin,spine,head and tail were collected for species smaller than 30 mm(Jepsen and Winemiller, 2002). In each station,at least three samples of different sizes(small,medium,large)were collected for each fish species. Individuals for each fish species in the same embayment degree(inner bay,bay mouth and outer bay)were mixed as one sample for stable isotope analysis. Zooplankton were collected in each station by zooplankton net I and II(mesh size 507 and 169 μm,respectively), and then were stored alive in sea water for more than 24 h to empty their guts(Jones and Waldron, 2003). After that,these zooplankton were classified into >900 μm,500–900 μm,300–500 μm and 100–300 μm by size(Guo et al., 2007). All samples were immediately frozen at -20°C until further analysis.
The tissue samples were dried for 24 h at 60°C, and then grinded into fine powder by pestle and mortar. Samples were treated by 1N HCl to remove carbonates following the method of Ute Jacob & Katja Mintenbeck(Jacob et al., 2005). After that,samples were defatted in a solution of methanol,chloroform and distilled water(2:1:0.8)in order to exclude the influence of lighter lipids(Kaehler et al., 2000), and were dried again prior to isotope measurement. The nitrogen isotope ratios were measured by isotope ratio mass spectrometer(IRMS,Isoprime; GV,Manchester,UK). 2.3 Fractional trophic level
A total of 52 demersal fish species were captured in this survey. TLs of 33 fish species were estimated from the nitrogen stable isotope analysis, and these fishes occupy 98.08% of total demersal fish species abundance and 90.22% of total biomass. These 33 fish species were used in subsequent steps of analysis.
A fractional TL was assigned to each of these fish species. The nitrogen stable isotope analysis provides TL of fish species(Post,2002),TL of fish species can be calculated by the following formula:
TLfish=(δ15Nfish– δ15Nbaseline)/3.4+2,
where δ15Nfishmeans the nitrogen isotope ratios of fish,δ15Nbaselinemeans the ratio of baseline reference organism,3.4 is the isotopic enrichment factor(Post,2002), and 2 is considered as the TL of baseline organism. In this study,the baseline organisms were the mesozooplanktonic(Vizzini and Mazzola, 2008; Cheng et al., 2011). 2.4 Trophic spectrumThe trophic spectrum was established by weight smooth method according to Gascuel et al.(2005). Biomass and abundance of fishes in each haul were utilized to construct trophic spectra. For each station,species biomasses and abundances were aggregated by their fractional trophic levels,from 2.7 to 4.0 by 0.1 step. Since the TL of fish may change during ontogeny,the trophic position of a certain species is thought to be better characterized by a range of fractional TLs rather than a single value(Jennings et al., 2002; Bozec et al., 2005), and the dispersion of TL for each species could be quantified by the omnivory index(OI)(Libralato and Solidoro, 2010). However,the value of OI was difficult to determine because it needs the dietary information of each species. In this study,a pragmatic approach was used and 7 point weight smooth was applied to exp and each fractional TL(Gascuel et al., 2005). For each TL *interval, and for each original biomass/abundance data X,the spectrum assumes a value ΦX(TL=TL *)according to a centered seventh-order weighted average(Libralato and Solidoro, 2010):
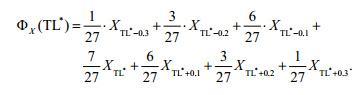
The trophic spectra of each embayment degree in different seasons were built by the above method. 2.5 Statistical analysis
In order to test the spatial and temporal difference between the trophic spectra,principal components analysis(PCA) and two-way analysis of variance(ANOVA)were performed in this study. Before the statistical analysis,a logarithmic transformation was applied to the smooth data of abundance and biomass in each station in order to minimize the effect of dominant species and dominant TL(Bozec et al., 2005).
A PCA was performed to investigate the covariation between TLs. The seasons and embayment degrees of each sampling station were used as supplementary variables for the characterization of stations ordination on the factorial planes. After that,scores of sampling stations along the first two PCA axes were used to test the spatial and seasonal difference of fish assemblages by the two-way ANOVA. The statistical analyses were conducted by Canoco 4.5(Ter Braak and Smilauer, 1998) and SPSS 19.0. 3 RESULT
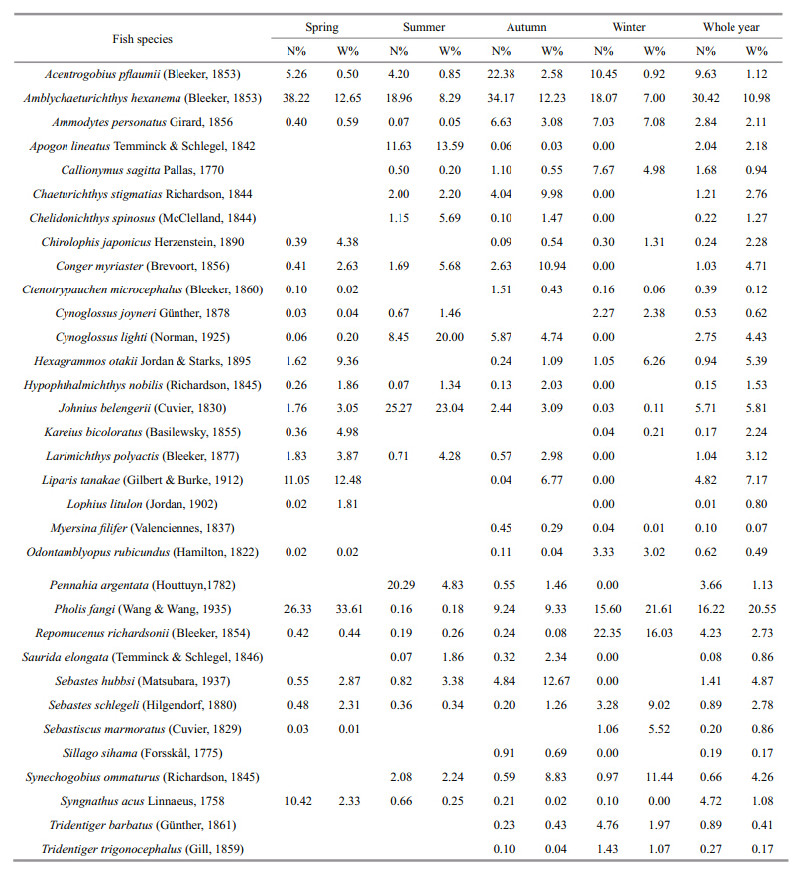
Dominant demersal fish species in Jiaozhou Bay were composed of small fish species such as P. fangi,A. hexanema,Johnius belengerii and C. lighti(Table 1). The mean size of these fishes was 104.76 mm, and their length ranged from 5 mm to 424 mm. The number of fish species was highest in autumn(29 species) and lowest in winter(20 species). There was an obvious seasonal variation of dominant fish species in Jiaozhou Bay(Table 1). For example,P. fangi was abundant in spring(N%=26.33%) and winter(N%=22.35%),while it was nearly absent during summer(N%=0.16%). J. belengerii was one of the dominant fish species in summer(N%=25.27%),but it had relatively low abundance in other seasons(Table 1). Only 8 fish species occurred in the whole year(Table 1).
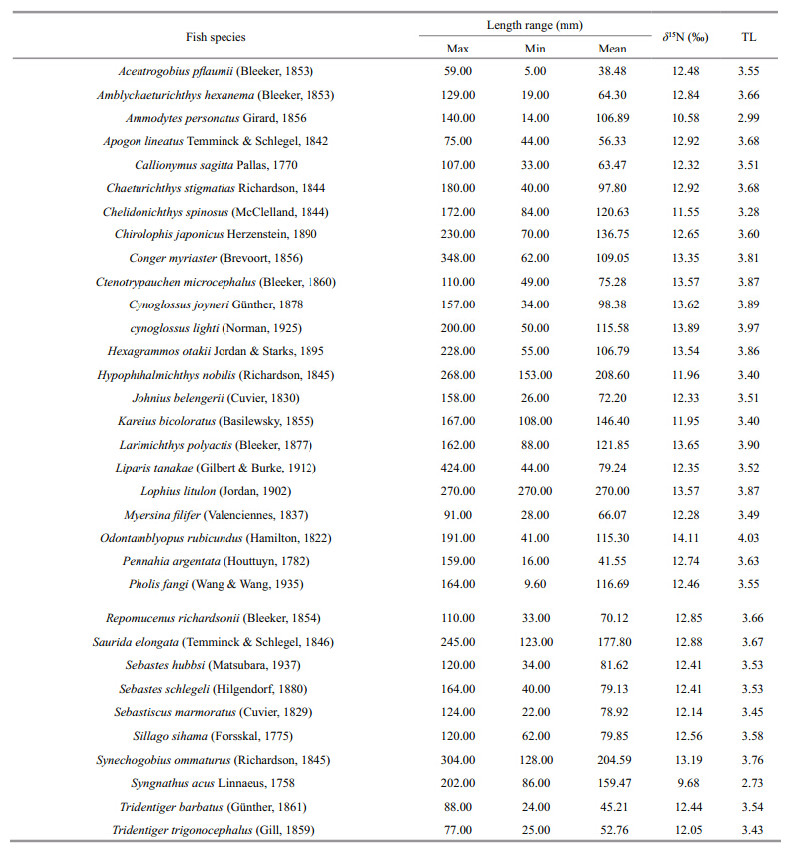
The demersal fish species in Jiaozhou Bay covered a narrow range of TLs,from TL=2.73(Syngnathusacus)to TL=4.03(Odontamblyopus rubicundus)(Table 2). TLs of most fish species(21 species among 33)were found around 3.4–3.7, and the mean TL of demersal fishes in Jiaozhou Bay was 3.59±0.26(S.D.). Trophic levels of 2 fish species( S. acus and Ammodytes personatus)were less than 3 and only one fish’s(O. rubicundus)TL was higher than 4(Table 2).
Most of the abundance trophic spectra of fish assemblage in Jiaozhou Bay has only one peak at TL=3.4–3.7(Fig. 2). In spring,demersal fish assemblage showed extremely high abundance,especially in the bay mouth, and the abundance trophic spectra were marked by two peaks in inner bay and outer bay,with one peak at TL=2.7 and the other one at TL=3.5(Fig. 2). In autumn,the abundance trophic spectrum of bay mouth showed one peak at TL=3.0 and another peak at TL=3.6. The total abundance of fish assemblage in other seasons didn’t show obvious differences between embayment degrees, and the abundance trophic spectra of fish assemblages have only one peak at TL=3.4–3.7(Fig. 2). The biomass trophic spectra of demersal fish in Jiaozhou Bay displayed similar variation trends with the abundance trophic spectra,being highest in spring, and most of these trophic spectra were marked by one peak at TL=3.4–3.7(Fig. 3).
 |
| Fig. 2 Abundance trophic spectra of demersal fish assemblages in Jiaozhou Bay |
 |
| Fig. 3 Biomass trophic spectra of demersal fish assemblages in Jiaozhou Bay |
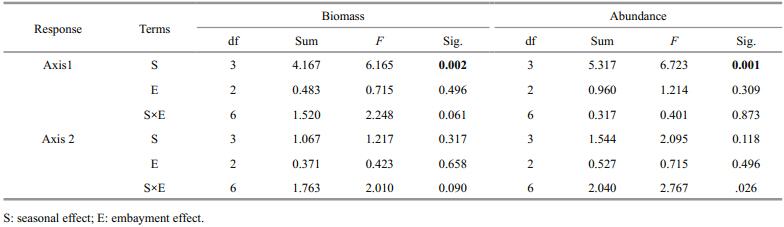
The first two PCA axes explained 70.20% of the total variations of the TL-by-station biomass. There was a positive relationship between the first axis and total biomass,especially in the biomass of TL=3.2–3.8(Fig. 4a). TL around 4.1 was opposed to TL around 2.6 along the second axis. As for abundance,71.90% of the total variations of the TL-by-station abundance were explained by the first two PCA axes. Patterns of first two axes were almost the same with the biomass(Fig. 4b),the analyses of variance showed that the seasonal difference between the station scores along the first axis was significant for both biomass and abundance(P<0.05)(Table 3). Conversely,the embayment degrees has no significant effect on the station scores along the first two axes(Table 3),indicating that the fluctuation of trophic structure in Jiaozhou Bay was more intense among seasons than embayment degrees.
 |
| Fig. 4 The PCA performed on the TL-by-station biomass(a) and abundance(b)data |
 |
Jiaozhou Bay is an important marine ecosystem,being a major spawning and feeding ground for many fish and invertebrate species in the Yellow Sea, and the fish species number was even more than 100 in 1980s(Liu,1992). However,in this study,only 57 fish species were collected from the seasonal bottom trawl surveys in Jiaozhou Bay, and 52 species were demersal fishes. Over the past several decades,intensive fishing pressure has affected the fishery resources and greatly changed the fish assemblages in Jiaozhou Bay(Zeng et al., 2004; Mei et al., 2010; Xu et al., 2010). Dominant fish species have changed from the large,high trophic level species(e.g. P. olivaceus and L. haematocheila)in the 1980s(Liu,1992)to small,low trophic level species(e.g. P. fang i and A. hexanema)in this study. The number of fish species in Jiaozhou Bay has remained stable in recent decades(Zeng et al., 2004; Mei et al., 2010; Xu et al., 2010),but decreased significantly compared with the 1980s(Liu,1992). Fish assemblages can be strongly modified when overfishing happened(Kronen et al., 2010; Sangil et al., 2013), and the number of species might reduce under heavy fishing pressure(Rochet and Trenkel, 2003). In addition,exp and ing of shellfish culture has occupied more and more nearshore areas in Jiaozhou Bay in recent years. As the nearshore areas were important spawning and nursery areas for many fishes in Jiaozhou Bay(Blaber et al., 1995; Zeng et al., 2012),the loss of habitat can have significantly negative impact on fish,which may cause the decline of fishery resources(Bruton,1995; Billman et al., 2012; Pratchett et al., 2012). 4.2 Trophic level and trophic structure of demersal fishes in Jiaozhou Bay
The decline of high trophic level specie in Jiaozhou Bay was significant in the last three decades(Liu,1992). Some high trophic level fishes like Lophiuslitulon,C. myriaster and Saurida elongata have been hardly fished recently, and they only occupy 1.12% of total fish abundance in this study. In addition,the trophic levels of these species with high commercial value also declined in this study. Zeng et al.(2012)has found that more than 40 juvenile fish species lived in Jiaozhou bay,with the biomass of most fish individual being less than 50 g. The trophic conditions of these commercially important fishes in Jiaozhou Bay were lower than before.
Most of the trophic spectra of Jiaozhou Bay showed only one peak in this study,with the main peak of trophic spectra being at TL around 3.5,which suggested that demersal fish assemblage in Jiaozhou Bay was dominated by invertebrate feeders. Most of demersal fish species in Jiaozhou Bay,especially the dominant species like P. fangi and A. hexanemamainly fed on plankton and shrimps(Yang,2001; Han et al., 2013). The dominant fish species showed obvious seasonal variations in Jiaozhou Bay. In spring and winter,dominant demersal fish species in Jiaozhou Bay were P. fangi(TL=3.55). While in summer and autumn,J. belengerii(TL=3.51) and Sebastes hubbsi(TL=3.53)was the most abundant fish species in Jiaozhou Bay,respectively. All of these dominant fish species fed mainly on zoobenthos or benthic shrimps(Yang,2001; Xue et al., 2005), and the trophic levels of these fish were relatively low. As a result,there were little variations in trophic spectra of demersal fish assemblage in Jiaozhou Bay. The results of trophic spectra might indicate more information about functional pattern of trophic structure than taxonomic relationship. 4.3 Seasonal and spatial variations in the trophic structure
The result of two-way ANOVA showed that the seasonal variation of demersal fish community was mainly embodied in total amount. Demersal fish abundance and biomass in summer were obviously lower than those in spring. The emigration of some dermersal fish species in Jiaozhou Bay could be the main reason. Cold-temperate species such as P. fangi and Liparis tanakae migrate out of Jiaozhou Bay in summer each year(Liu,1992; Xu et al., 2010). Because P. fangi is dominant fish in Jiaozhou Bay,the emigration of P. fangi could result in the decrease of total abundance and biomass of fish assemblage in Jiaozhou Bay(Xu et al., 2010). The fluctuation of demersal fish abundance and biomass in autumn and winter was also related to the fish reproduction and fish emigration. Many fish species in Jiaozhou Bay spawn in spring and summer,like A. hexanema,Cynoglossus joyneri,J. belengerii, and so on(Liu,1992),which may cause the increase of fish abundance and biomass during autumn. In winter,most of the warm-temperate species like Larimichthys polyactis and Conger myriastermigrate out of Jiaozhou Bay to the overwintering ground in the southern Yellow Sea(Mei et al., 2010),which could result in the decrease in abundance and biomass of fish assemblages in Jiaozhou Bay. Furthermore,the high fishing pressure in autumn could also have significant influence on the fish abundance and biomass in Jiaozhou Bay. In Jiaozhou Bay,the change observed oNfishassemblages may be the result of the synergetic effects of various factors,such as fishing pressure,fish reproduction and fish migration.
Two differences have been found in the seasonal and spatial pattern of abundance and biomass trophic spectra for demersal fish assemblages in Jiaozhou Bay. Firstly,in spring the abundance trophic spectrum of fish assemblage in bay mouth was extremely higher than that in other areas, and the main peak of abundance trophic spectra(TL around 3.4–3.7)was mostly composed of A. hexanema. However,the biomass trophic spectrum did not show the same high peak with abundance trophic spectrum because of the small size of A. hexanema. Secondly,the peaks of biomass trophic spectra were not consistent with those in the abundance trophic spectra,which meant that these peaks were formed mainly by fishes with big size and low abundance,while the biomass trophic spectra might overemphasize the contribution of the fish species with big size. Therefore,the comprehensive application of these two trophic spectra was recommended in the study on trophic structure of fish assemblages. 5 ACKNOWLEDGEMENT
We are grateful to all colleagues and students in the laboratory of Fishery Oceanography for their work in field sampling and sample analyses.
| Billman E J, Kreitzer J D, Creighton J C, Habit E, McMillan B, Belk M C. 2012.Habitat enhancement and native fish conservation: can enhancement of channel complexity promote the coexistence of native and introduced fishes? Environmental Biology of Fishes, 96 (4): 555-566. |
| Blaber S J M, Brewer D T, Salini J P. 1995. Fish communities and the nursery role of the shallow inshore waters of a tropical bay in the Gulf of Carpentaria, Australia. Estuarine, Coastal and Shelf Science, 40 (2): 177-193. |
| Bozec Y M, Kulbicki M, Chassot E, Gascuel D. 2005. Trophic signature of coral reef fish assemblages: towards a potential indicator of ecosystem disturbance. Aquatic Living Resources, 18 (2): 103-109. |
| Bruton M N. 1995. Have fishes had their chips? The dilemma of threatened fishes. Environmental Biology of Fishes, 43 (1): 1-27. |
| Chambers C A, Dick T A. 2005. Trophic structure of one deepsea benthic fish community in the Eastern Canadian Arctic: application of food, parasites and multivariate analysis. Environmental Biology of Fishes, 74 (3-4): 365- 378. |
| Chassot E, Rouyer T, Trenkel V M, Gascuel D. 2008. Investigating trophic-level variability in Celtic Sea fish predators. Journal of Fish Biology, 73 (4): 763-781. |
| Cheng Z, Liang P, Shao D D, Wu S C, Nie X P, Chen K C, Li K B, Wong M H. 2011. Mercury biomagnification in the aquaculture pond ecosystem in the Pearl River Delta. Archives of Environmental Contamination and Toxicology, 61 (3): 491-499. |
| Cury P, Shannon L, Roux J, Daskalov G, Jarre A, Moloney C, Pauly D. 2005. Trophodynamic indicators for an ecosystem approach to fisheries. ICES Journal of Marine Science, 62 (3): 430-442. |
| Dolgov A V. 2009. Trophic structure of the Barents Sea fish assemblage with special reference to the cod stock recoverability. Progress in Oceanography, 81 (1-4): 165- 173. |
| Garcia S, Cochrane K. 2005. Ecosystem approach to fisheries: a review of implementation guidelines. ICES Journal of Marine Science, 62 (3): 311-318. |
| Gasche L, Gascuel D. 2013. EcoTroph: a simple model to assess fishery interactions and their impacts on ecosystems. ICES Journal of Marine Science, 70 (3): 498- 510. |
| Gascuel D, Bozec Y M, Chassot E, Colomb A, Laurans M. 2005. The trophic spectrum: theory and application as an ecosystem indicator. ICES Journal of Marine Science, 62 (3): 443-452. |
| Greenstreet S P R, Rogers S I. 2006. Indicators of the health of the North Sea fish community: identifying reference levels for an ecosystem approach to management. ICES Journal of Marine Science, 63 (4): 573-593. |
| Guo X P, Li Z Y, Jin X S, Dai F Q. 2007. Feeding habit study of Anchovy(Engraulis japonicus)in the central and southern part of the Huanghai Sea with stable isotope techniques. Acta Oceanologica Sinca, 29 (2): 98-104. (in Chinese with English abstract) |
| Hajisamae S, Ibrahim S. 2007. Seasonal and spatial variations of fish trophic guilds in a shallow, semi-enclosed tropical estuarine bay. Environmental Biology of Fishes, 82 (3): 251-264. |
| Han D Y, Xue Y, Ji Y P, Ma Q Y. 2013. Feeding ecology of Amblychaeturichthys hexanema in Jiaozhou Bay, China. Chin. J. Appl. Ecol., 24 (5): 1 446-1 452. (in Chinese with English abstract) |
| Horinouchi M, Tongnunui P, Furumitsu K, Nakamura Y, Kanou K, Yamaguchi A, Okamoto K, Sano M. 2012. Food habits of small fishes in seagrass habitats in Trang, southern Thailand. Fisheries Science, 78 (3): 577-587. |
| Jacob U, Brey T, Fetzer I, Kaehler S, Mintenbeck K, Dunton K, Beyer K, Struck U, Pakhomov E A, Arntz W E. 2005. Towards the trophic structure of the Bouvet Island marine ecosystem. Polar Biology, 29 (2): 106-113. |
| Jennings S, Greenstreet S, Hill L, Piet G, Pinnegar J, Warr K J. 2002. Long-term trends in the trophic structure of the North Sea fish community: evidence from stable-isotope analysis, size-spectra and community metrics. Marine Biology, 141 (6): 1 085-1 097. |
| Jepsen D B, Winemiller K O. 2002. Structure of tropical river food webs revealed by stable isotope ratios. Oikos, 96 (1): 46-55. |
| Jones J I, Waldron S. 2003. Combined stable isotope and gut contents analysis of food webs in plant-dominated, shallow lakes. Freshwater Biology, 48 (8): 1 396-1 407. |
| Kaehler S, Pakhomov E A, McQuaid C D. 2000. Trophic structure of the marine food web at the Prince Edward Islands (Southern Ocean) determined by δ13C and δ15N analysis. Marine Ecology Progress Series, 208 : 13-20. |
| Kronen M, Magron F, McArdle B, Vunisea A. 2010. Reef finfishing pressure risk model for Pacific Island countries and territories. Fisheries Research, 101 (1-2): 1-10. |
| Libralato S, Solidoro C. 2010. Comparing methods for building trophic spectra of ecological data. ICES Journal of Marine Science, 67 (3): 426-434. |
| Liu R Y. 1992. Ecology and Biological Resources of Jiaozhou Bay. Science Press, Beijing, China. (in Chinese) |
| Mei C, Xu B D, Xue Y, Ren Y P, Zan X X. 2010. Fish community structure and species diversity during autumn and winter in the central waters of Jiaozhou Bay. Journal of Fishery Sciences of China, 17 (1): 110-118. (in Chinese with English abstract) |
| Munyandorero J. 2006. Size, diversity, dominance and trophic structures of the fish community in a tropical lake: a case study for the Sinazongwe area, Lake Kariba, Zambia. Aquatic Living Resources, 19 (2): 123-136. |
| Nilsen M, Pedersen T, Nilssen E M, Fredriksen S. 2008. Trophic studies in a high-latitude fjord ecosystem—a comparison of stable isotope analyses (δ13C and δ15N) and trophic-level estimates from a mass-balance model. Canadian Journal of Fisheries and Aquatic Sciences, 65 (12): 2 791-2 806. |
| Pauly D, Christensen V, Dalsgaard J, Froese R, Torres F Jr. 1998. Fishing down marine food webs. Science, 279 (5352): 860-863. |
| Polito M J, Trivelpiece W Z, Karnovsky N J, Ng E, Patterson W P, Emslie S D. 2011. Integrating stomach content and stable isotope analyses to quantify the diets of pygoscelid penguins. PloS One, 6 (10): e26 642. |
| Post D M. 2002. Using stable isotopes to estimate trophic position: models, methods, and assumptions. Ecology, 83 (3): 703-718. |
| Pratchett M S, Coker D J, Jones G P, Munday P L. 2012. Specialization in habitat use by coral reef damselfishes and their susceptibility to habitat loss. Ecology and Evolution, 2 (9): 2 168-2 180. |
| Rochet M J, Trenkel V M. 2003. Which community indicators can measure the impact of fishing? A review and proposals. Canadian Journal of Fisheries and Aquatic Sciences, 60 (1): 86-99. |
| Sangil C, Martín-García L, Hernández J C, Concepción L, Fernández R, Clemente S. 2013. Impacts of fishing and environmental factors driving changes on littoral fish assemblages in a subtropical oceanic island. Estuarine, Coastal and Shelf Science, 128 : 22-32. |
| Specziár A, Rezsu E T. 2009. Feeding guilds and food resource partitioning in a lake fish assemblage: an ontogenetic approach. Journal of Fish Biology, 75 (1): 247-267. |
| Ter Braak C J F, Smilauer P. 1998. CANOCO Reference Manual and User's Guide to Canoco for Windows: Software for Canonical Community Ordination (version 4). Microcomputer Power Ithaca, New York. |
| Vizzini S, Mazzola A. 2008. Stable isotopes and trophic positions of littoral fishes from a Mediterranean marine protected area. Environmental Biology of Fishes, 84 (1): 13-25. |
| Wang J L. 1993. China' Bay, vol 4. Ocean Press, Beijing. (in Chinese) |
| Xu B D, Zhang F, Mei C, Ren Y P, Ji Y P, Xue Y. 2010. Characteristics of fish community structure in the central Jiaozhou Bay in spring and summer. Chin. J. Appl. Ecol., 21 (6): 1 558-1 564. (in Chinese with English abstract) |
| Xue Y, Jin X S, Zhang B, Liang Z L. 2005. Feeding habits of three sciaenid fishes in the southern Yellow Sea. Journal of Fisheries of China, 29 (2): 178-187. (in Chinese with English abstract) |
| Yang J M. 2001. A study on food and trophic levels of Baohai Sea fish. Modern Fisheries Information, 16 (10): 10-19.(in Chinese with English abstract) |
| Zeng H H, Xu B D, Xue Y, Ren Y P, Ji Y P. 2012. Study on fish species composition and seasonal variation in the shallow waters of Jiaozhou Bay. Periodical of Ocean Uni v ersity of China, 42 (1-2): 67-74.(in Chinese with English abstract) |
| Zeng X Q, Piao C H, Jiang W, Liu Q. 2004. Biodiversity investigation in Jiaozhou Bay and neighbouring waters. Periodical of Ocean Uni v ersity of China, 34 (6): 977-982. (in Chinese with English abstract) |
| Zhang B, Tang Q S, Jin X S. 2007. Decadal-scale variations of trophic levels at high trophic levels in the Yellow Sea and the Bohai Sea ecosystem. Journal of Marine Systems, 67 (3-4): 304-311. |
| Zhang K, Wang Z H, Feng J, Fang J, 2011. Distribution and pollution assessment of heavy metals in surface sediments of Jiaozhou Bay. Journal of Instrumental Analysis, 30 (12): 1 406-1 411. (in Chinese with English abstract) |
| Zhou C Y, Li G X, Shi J H. 2010. Coastline change of Jiaozhou Bay over the last 150 years. Periodical of Ocean Uni v ersity of China, 40 (7): 99-106. (in Chinese with English abstract) |