 2015, Vol. 33
Shanghai University
Article Information
- GAO Yang (高阳), WANG Ziwei (高阳), HUR Jun-wook, LEE Jeong-Yeol
- Body composition and compensatory growth in Nile tilapia Oreochromis niloticus under different feeding intervals
- Chinese Journal of Oceanology and Limnology, 2015, 33(4): 945-956
- http://dx.doi.org/10.1007/s00343-015-4246-z
Article History
- Received Oct. 13, 2014;
- accepted in principle Jan. 3, 2015;
- accepted for publication Jan. 22, 2015


2 Department of Aquaculture and Aquatic Science, Kunsan National University, Gunsan 573-701, Korea;
3 Bio-Monitoring Center, Daejeon 300-805, Korea
Compensatory growth is defined as an accelerated growth rate induced through a period of resource restriction(Hornick et al., 2000; Metcalfe and Monaghan, 2001; Nicieza and Álvarez, 2009). The possible advantages of compensatory growth in aquaculture include improved feed efficiency and increased growth rates(Zhu et al., 2001, 2004). Compensatory growth of tilapia has been studied extensively through feed deprivation(Wang et al., 2000), and by manipulation of density and temperature(Basiao et al., 1996; Chmilevskii, 1998). However, the time required to initiate compensatory growth and the subsequent duration of this effect have not been well documented. Clarification of these questions would assist in the practical application of this phenomenon in aquaculture(Nicieza and Metcalfe, 1997). In addition, changes in the body composition of tilapia during the deprivation and refeeding periods could lead to a better underst and ing of the mechanism of compensatory growth(Ali et al., 2003).
Here, we report changes in the growth and body composition of Nile tilapia under different feeding regimes. Proximate changes in the composition of fish during deprivation and refeeding may offer clues to the control of appetite during the hyperphagic phase although such changes have rarely been studied in the context of compensatory growth. Moreover, information on amino acid and fatty acid changes in tilapia during fasting and refeeding is scant. Therefore, in this experiment we also investigated changes in the body composition of amino acids and fatty acids of tilapia under a feed restriction-refeeding regime. 2 MATERIAL AND METHOD 2.1 Experimental setting
This experiment was carried out at the aquaculture research station of Kunsan National University between 21 February and 29 August 2011(185 days). Five treatments with three replicates of each were assigned r and omly to 15 tanks. A control group(F0)was fed to satiation twice daily(9:00 and 17:00)throughout the experiment. Fish in the other four groups were fed at intervals of 1, 2, 4 or 7 days(the ‘restricted’ feeding period, days 0–80). These groups are referred to as F1, F2, F4, and F7, respectively. This was followed by a ‘refeeding’ period(days 80–185)in which they were also fed to satiation twice daily. Commercially extruded dry pellets(38% crude protein, 6% crude fat; Woosung Feed Co. Ltd. Daejeon, South Korea)were used in this study. The residual feed was collected after 30 min, dried and weighed. The quantities of feed offered and uneaten were recorded each day for the calculation of feed intake and feed efficiency. Two-month-old tilapia were hatched and reared in an aquaculture farm at Kunsan National University. Each tank was stocked with 240 fish(body weight 11.80±0.75 g; length 8.64±0.14 cm)at a density of 1.13 kg/m3(96 fish/m3). The tanks were 2.5 m×2.5 m with water depth maintained at 40 cm and a water exchange rate of 6 L/min. Water temperature, dissolved oxygen, and pH were recorded daily using a water-quality checker(model WQC-22A, TOA Corporation, Tokyo, Japan). Water temperature was maintained between 22°C and 23°C throughout the experimental period and dissolved oxygen was above 6 mg/L. Fish were acclimated to the recirculating system for 2 weeks prior to the experiment. Growth parameters were measured on days 1, 20, 40, 60, 80, 95, 110, 125, 155, and 185 to determine the growth trajectories of weight and length. Fifty fish were sampled from each tank and their weights and lengths were measured individually for the determination of weight-length relationships. 2.2 Growth analyses
Fish condition was evaluated as the relative condition factor(RCF; Le Cren, 1951). First, the relationship between weight and length of fish in the control group throughout the experimental period was calculated as W=0.0119× L3.1953, R2=0.999. The predicted weights of fish of the other four groups were then calculated from this equation, based on their observed lengths. The RCF was defined as: observed weight/predicted weight at the given length. A ratio equal to 1 indicates that the fish has the same body condition as the fish in the control group. Other growth parameters were calculated as follows:
specific growth rate of weight:
SG RW(%)=100×(ln Wt–lnW0)/(Tt– T0),
specific growth rate of length:SGR L(%)=100×(ln Lt–ln L0)/(Tt– T0),
Feed efficiency: FE=(Wt–W0)/ I,
Feed intake: FI=100×feed×[(Wt+W0)/2] -1×day -1,
where W0, Wt, L0 and Ltare the initial and final weights(g) and the initial and final lengths(cm)of the fish, respectively; t is the rearing period(days); and Iis the total feed(g)consumed in t days. 2.3 Analysis of body composition
At the beginning of the experiment, 20 fish were sampled for analysis of the initial body composition(day 0). At the end of the restricted-feeding period, 10 fish from each tank were sampled r and omly and frozen at -20°C for chemical analysis, and a further 10 fish from each tank were sampled at the end of the experiment. The contents of crude protein, lipid, ash, and water were determined for the fish according to the methods of AOAC(1995). Samples were ovendried to constant weight at 70°C to determine water content. Crude protein was analyzed by the Kjeldahl method(N×6.25)after acid digestion. Lipid was analyzed by Soxhlet extraction(Soxtec system SOX500; Hanon Instruments, Shanghai, China). Ash was determined by combustion at 550°C in a muffle furnace for 12 h. Lipid for fatty acid analysis was extracted by a mixture of methanol and chloroform(l:2, v/v)according to the method of Folch et al.(1957). The fatty acid composition was determined by gas chromatography(Trace GC, Thermo Finnigan, San Jose, CA, USA). Amino acid composition was determined after acid hydrolysis using an automatic amino acid analyzer(Hitachi 835–50, Tokyo, Japan). 2.4 Statistical analysis
Differences among the treatment groups in their weights, lengths, and RCF values at each measurement time were analyzed by one-way analysis of variance(ANOVA). As the experiment proceeded, the initial weights within each sampling interval for each treatment changed. Therefore, differences in SGR W, SGR L, feed intake and feed efficiency were evaluated by analysis of covariance(ANCOVA)using the initial size at each sample time as a covariate, when necessary. Tukey’s test was used for multiple comparisons. Slopes of the growth trajectories during the refeeding stage were compared using linear regression and t-tests; weights and lengths were firstlog-transformed to meet the requirements of the linear growth model. Differences in overall body composition and specific amino acids and fatty acids among treatments were tested by one-way ANOVA. Differences were regarded as significant when P<0.05. Statistical analyses were performed using SPSS 16.0(SPSS Inc., Chicago, IL, USA). 3 RESULT 3.1 Growth analysis
The survival rates of tilapia ranged from 92% to 96% and were not significantly different among the treatments(data not shown). Significant differences were observed between the control group and the feed-restricted groups F2, F4, and F7 after 40 days, and after 60 days in F1. Tilapia in the control group were larger than those in the restricted groups throughout the whole feeding period(Figs.1, 2).
 |
| Fig. 1 Growth trajectories of the weights of control and feeding-restricted fish during the experimental period
The labels F0, F1, F2, F4 and F7 refer to the control group(twice-daily feeding) and the groups fed at intervals of 2, 3, 4 and 7 days, respectively, during the period of restricted feeding. All groups were returned to twice-daily feeding between days 80 and 185. Different letters on thedata points at each time indicate statistical differences among groups(ANOVA followed by Tukey’s multiple comparisons, P<0.05). |
 |
| Fig. 2 Growth trajectories of the lengths of control and feed-restricted fish during the experimental period
Different letters on the data points at each time indicate statistical differences among groups(ANOVA followed by Tukey’s multiple comparisons, P<0.05). Refer to Fig. 1 for details of treatment groups. |
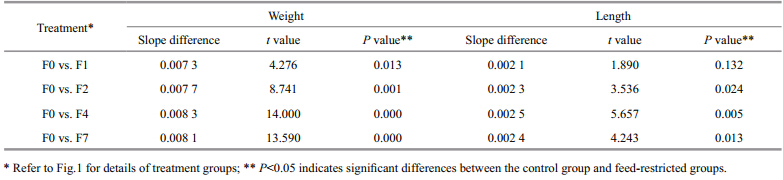
Comparison of the slopes of the growth trajectories during the refeeding period suggested that the growth of the fish in the restricted groups would have caught up with that of the fish in the control group if the experiment had been extended for longer, particularly in the case of group F4(Table 1).
 |
Marked differences in the relative condition factor(RCF)were observed among the groups from day 40 until the end of the restricted-feeding period. After refeeding commenced, tilapia condition rapidly recovered to the control level and no significant differences were observed during the refeeding period(Fig. 3).
 |
| Fig. 3 Relative condition factors(RCF)of fish groups during the observation period
A value of RCF=1 indicates that fish reached the predicted mass at their measured length. Different letters on the data points at each time indicate statisticaldifferences among groups(ANOVA followed by Tukey’s multiple comparisons, P<0.05). Refer to Fig. 1 for details of treatment groups. |
The weight and lengths of tilapia in the restricted groups did not catch up with those of the control group during the refeeding period, although the growth rates for both mass and length were significantly higher in the restricted groups than in the control group(Figs.4, 5). SGR W and SGR L increasedsignificantly after refeeding was commenced but then gradually decreased again until the end of the experiment. Tilapia with higher feed restriction showed higher growth rates, except for group F7. SGRW/SGRL also increased, especially during the second refeeding interval(95–110 days), indicating that tilapia compensated both their weights and lengths in the first interval(Fig. 6). Differences of feed intake among the treatments were evaluated using separate one-way ANCOVAs for each of the intervals, with weight at the start of each interval as the covariate, when necessary(Fig. 7). Feed intake during the restriction period generally decreased with increasing feeding interval, although groups F2 and F4 took in similar quantities. After the start of refeeding(day 81), the feed intakes of the previously feed-restricted groups were obviously higher than that of the control group, reaching maximum values during the second refeeding interval(95–110 days)Feed intake then decreased gradually but remained higher than that of the control group until the end of the experiment.
 |
| Fig. 4 Specific growth rates of weight of experimental fish within each measuring interval
Different letters labeling the data points indicate statistical differences among groups in this time interval(ANOVA followedby Tukey’s multiple comparisons, P<0.05). Refer to Fig. 1 for details of treatment groups. |
 |
| Fig. 5 Specific growth rates of length within each measuring interval
Different letters labeling the data points indicate statistical differences among groups(ANOVA followed by Tukey’s multiple comparisons, P<0.05). Refer to Fig. 1 for details of treatment groups. |
 |
| Fig. 6 SGRW/RL during each measuring interval
Different letters on the data points indicate statistical differences among groups(ANOVA followed by Tukey’s multiple comparisons, P<0.05). Refer to Fig. 1 for details of treatment groups. |
 |
| Fig. 7 Feed intake during the feeding-restricted period(0–80 days) and subsequent refeeding periods
Different letters labeling the data points indicate statistical differences among groups(ANOVA followed by Tukey’s multiple comparisons, P<0.05). Refer to Fig. 1 for details of treatment groups. |
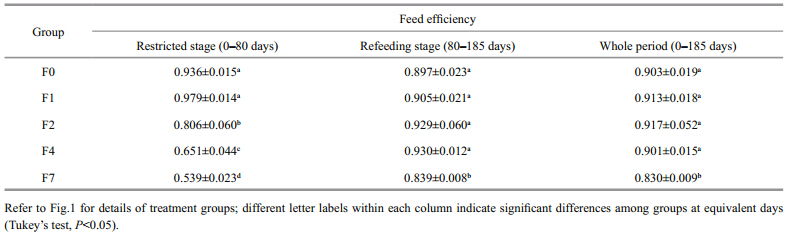
There was no significant increase in the feed efficiency of the restricted-feeding groups(F1, F2, and F4)relative to the control group after refeeding commenced(Table 2). In fact, the feeding efficiency of group F7 was particularly low, and was obviously lower than in the other restricted groups throughout the refeeding period.
 |
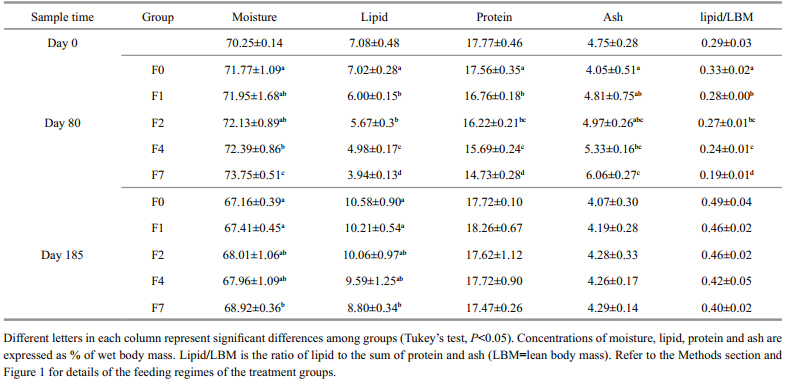
At the end of the restricted-feeding period, protein and lipid concentrations tended to be lower while moisture and ash concentrations tended to be higher. These trends were more prominent the greater the degree of feed deprivation(Table 3). Moisture and ash contents in groups F4 and F7 were significantly higher than in the control group(P<0.05). The lipid concentrations in groups F1, F2, F4 and F7 groups decreased by 15%, 19%, 29% and 43%, respectively, while their protein contents decreased by 4.6%, 7.6%, 10.7% and 16%, respectively, compared with the control group. At the end of the experiment, the moisture concentration was still significantly higher, and lipid concentration was lower in F7 than in the control group but there were no significant differences in protein or ash concentrations between the restricted and control groups at this time. At the end of the restricted-feeding period, the ratio of the lipid/LBM in the treatment groups was significantly lower in comparison to the control group(P<0.05) and decreased with increasing feed restriction. Although this decreasing trend was sustained to the end of the refeeding period, differences between the control and restricted-feeding groups were not statistically significant(P>0.05).
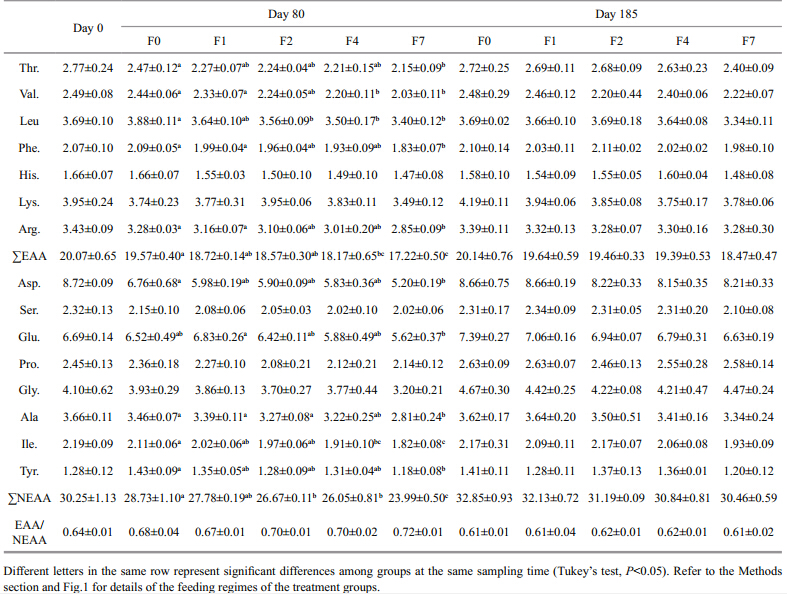
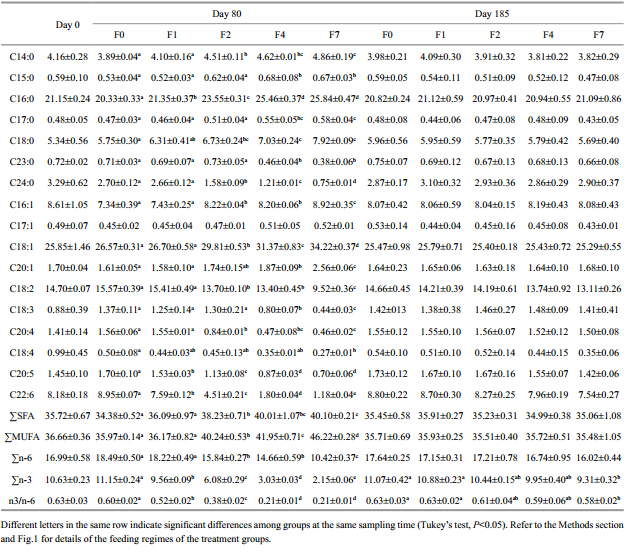
At the end of the restricted-feeding period, the contents of both essential amino acids(EAA) and nonessential amino acids(NEAA)had decreased relative to the initial values(Table 4). The percentage depletions of both amino acid groups were greater as the feed restriction increased; i.e., for F0, F1, F2, F4, and F7, the depletions of EAA were 4%, 5%, 7%, and 12%, and for NEAA they were 3%, 7%, 9% and 16%, respectively. However, there was no marked difference of total EAA and NEAA between F1 and the control group, while total EAA and NEAA of groups F4 and F7 were significantly lower than in the control group. The ratio of EAA to NEAA increased with increasing feeding interval but the differences were not statistically significant(P>0.05)between the control group and the restricted-feeding groups. After refeeding, both total EAA and NEAA recovered to the normal levels, similar to those of the control group. At the end of the experiment, although the total EAA and NEAA still showed a decreasing trend with increasing feeding interval, the difference was not statistically different. Total saturated fatty acids(SFA) and monounsaturated fatty acids(MUFA)increased with increasing feeding interval(Table 5).
 |
 |
Compensatory responses in both weight and length were observed, particularly during the initial refeeding intervals. The relative degree of compensation differed according to the feeding regime applied(Figs.4, 5). These observations differ somewhat from those in studies on other species. Álvarez and Nicieza(2005)found that brown trout(Salmo trutta L.)showed partial compensation for mass and rapid recovery of body condition but no compensation in length. Similarly, gilthead sea bream(Sparus aurata)compensated weight but not length(Bavčević et al., 2010). Although compensatory responses for both weight and length occurred in tilapia, they had not caught up with the control group by the end of theexperiment. However, the restricted-feeding groups continued to show significantly higher growth rates in weight and length; they may have caught up with the control group after a more prolonged period of refeeding.
Compensatory growth has been demonstrated in Mozambique tilapia Oreochromis mossambicus(Christensen and McLean, 1998) and in hybrid tilapia O. mossambicus× O. niloticusreared in seawater(Wang et al., 2000). Generally, fish that were more severely starved showed a greater size differential during recovery and faster growth(Jobling and Johansen, 1999; Wang et al., 2000). Growth rate increased with increasing feed restriction and was highest in group F4 in which fish were fed every 4 days. When the feeding interval was increased to once per week, the compensatory response decreased slightly. This may reflect the lower feed efficiency in group F7, although tilapia in this group exhibited the strongest hyperphagic response after refeeding commenced.
Compensatory growth can be achieved through hyperphagia or by a combination of hyperphagia and improved feed and growth efficiency. In our experiment, the hyperphagic response was notably high throughout the refeeding period. Thus, the feed intake of the restricted groups was consistently higher than that of the control group throughout the refeeding period. The hyperphagic response tended to increase with the increase in feeding interval, which was consistent with their specific growth rates of weight and length. However, feed intake did not reach its peak until 15–30 days after refeeding commenced. This pattern was also seen in three-spined sticklebacks(Ali and Wootton, 2001; Zhu et al., 2001)in which there was a delay before reestablishment of effective digestive processes in the stomach following a period of food deprivation. Many studies have demonstrated increased growth efficiency at some stage during the compensatory growth response, including studies on Lepomishybrids(Hayward et al., 1997), juvenile gibel carp(Qian et al., 2000), channel catfish(Gaylord and Gatlin, 2001), and juvenile three-spined sticklebacks(Zhu et al., 2001; Wu et al., 2003). The causal explanation for the observed improvements in growth efficiency is unclear(Ali et al., 2003). However, these results have not been confirmed in other experiments(Miglavs and Jobling, 1989; Hayward et al., 1997; Gaylord and Gatlin, 2001; Gaylord et al., 2001; Xie et al., 2001; Nikki et al., 2004). Hybrid tilapia reared in seawater showed partial growth compensation resulting from increased food intake but without improved feeding efficiency(Wang et al., 2000). Likewise, in our experiment, feed efficiency of the feed-restricted groups was not greatly improved although the feed efficiency of groups F1, F2 and F4 was slightly higher than that of the control group. Feeding efficiency in F7, the most starved group, was significantly lower than in the control and other restricted groups. The reason for this is not entirely clear but could be partly a consequence of the higher metabolic rate during the refeeding period. Compensatory growth can be achieved through hyperphagia or by a combination of hyperphagia and improved feed and growth efficiency. In our experiment, the hyperphagic response was notably high throughout the refeeding period. Thus, the feed intake of the restricted groups was consistently higher than that of the control group throughout the refeeding period. The hyperphagic response tended to increase with the increase in feeding interval, which was consistent with their specific growth rates of weight and length. However, feed intake did not reach its peak until 15–30 days after refeeding commenced. This pattern was also seen in three-spined sticklebacks(Ali and Wootton, 2001; Zhu et al., 2001)in which there was a delay before reestablishment of effective digestive processes in the stomach following a period of food deprivation. Many studies have demonstrated increased growth efficiency at some stage during the compensatory growth response, including studies on Lepomishybrids(Hayward et al., 1997), juvenile gibel carp(Qian et al., 2000), channel catfish(Gaylord and Gatlin, 2001), and juvenile three-spined sticklebacks(Zhu et al., 2001; Wu et al., 2003). The causal explanation for the observed improvements in growth efficiency is unclear(Ali et al., 2003). However, these results have not been confirmed in other experiments(Miglavs and Jobling, 1989; Hayward et al., 1997; Gaylord and Gatlin, 2001; Gaylord et al., 2001; Xie et al., 2001; Nikki et al., 2004). Hybrid tilapia reared in seawater showed partial growth compensation resulting from increased food intake but without improved feeding efficiency(Wang et al., 2000). Likewise, in our experiment, feed efficiency of the feed-restricted groups was not greatly improved although the feed efficiency of groups F1, F2 and F4 was slightly higher than that of the control group. Feeding efficiency in F7, the most starved group, was significantly lower than in the control and other restricted groups. The reason for this is not entirely clear but could be partly a consequence of the higher metabolic rate during the refeeding period.
Lipid/LBM has been proposed as a predictor of compensatory growth(Jobling and Johansen, 1999) and is referred to as the lipostat model. The model suggests that a decrease in the ratio of lipid to LBM results in a compensatory growth response and that compensation ceases once the ratio is restored to the control level. In the present study, the growth rate and feed intake were maintained slightly higher than in the control group until the end of the experiment, while lipid level and lipid/LBM were lower than the control group, which suggests that the compensatory response in our experiment reflected lipostat regulation.
In starved channel catfish, there were significant decreases in total amino acids, total EAA and total NEAA, concomitant with a decrease in protein content(Luo et al., 2009). Gunasekera et al.(2001)also reported that protein reduction was accompanied by decreases in total amino acids, total EAA and total NEAA of trout cod during starvation. Amino acids are precursors of protein synthesis and may be used as metabolic substrates for the production of energy. A decline in amino acid content could be a consequence of their greater use as energy substrates whereas an increase suggests a higher turnover and a higher uptake of gluconeogenic amino acids(Navarro et al., 1997; Shiau et al., 2001). In the present study, NEAA declined more rapidly than EAA during fasting, suggesting that tilapia preferentially used NEAA as energy substrates and retained EAA, which is consistent with a previous study(Liu et al., 2009; Luo et al., 2009; Tan et al., 2009). However, the mechanism that determines which amino acids are used first as energy substrates is unclear. Differences in the types of amino acids retained may be associated with species-specific differences in their roles(Luo et al., 2009).
Starvation may result in reduced lipid concentrations in fish bodies and changes in fatty acid composition(Tidwell et al., 1992; Zamal and Ollevier, 1995; De Silva et al., 1997). In our experiment, saturated fatty acids(SFA) and monounsaturated fatty acids(MUFA)increased in tilapia muscle while polyunsaturated fatty acids(PUFA)decreased greatly with a longer deprivation interval. This suggests that PUFA was the major energy source for starving tilapia. Increased SFA was also observed in muscle of starved channel catfish(Luo et al. 2009). Similarly, starved pikeperch catabolized more MUFA than SFA, and SFA was not used as an energy substrate in starved Eurasian perch(Abi-Ayad et al., 2004). In rainbow trout, Jezierska et al.(1982)reported that a decrease of MUFA led to a substantial increase in SFA. In the present study, C22:6(DHA) and C20:5(EPA)decreased greatly with increasing deprivation interval, which suggested that these fatty acids(HUFA)were catabolized as an energy source, as observed in trout cod(Gunasekera et al., 2001) and pikeperch(AbiAyad et al., 2004). However, in contrast to a previous study(Tidwell et al., 1992), we observed that EPA and DHA increased during starvation. Whether patterns of fatty acid composition have a role in determining the duration of compensatory growth needs further investigation. 5 CONCLUSION
In conclusion, the present study demonstrated that a compensatory response was evoked in tilapia by feed restriction. The growth rate of the fish improved greatly with a trend toward higher growth rates with greater feed restriction, except in the most deprived fish. Potentially, the growth of tilapia in the feedrestricted group could eventually catch up with that of the control group. In addition, feed efficiency was improved slightly by feed restriction; fish fed at longer intervals had higher feed efficiencies, except for those fed weekly. However, from the point of view of the whole culture phase, there was no remarkable difference between restricted groups and the control group because feed efficiency in the restricted period decreased with increasing feeding interval. Moreover, severely restricted fish had lower feed efficiency during the whole feeding stage. Therefore, determination of the optimal deprivation period or deprivation intensity is crucial. If maximizing the weight of the fish harvest is an important objective, our results suggest that the optimal feeding strategy would involve a slight reduction in feeding for a long period, during which fish grow at sub-maximum rates, followed by a short period of intensive feeding to boost body condition. If reaching market size in the minimum time is important, we recommend feeding fish to satiation continuously, while taking care to avoid overfeeding. Constant feeding on maximum feeding rations results in the fastest growth but does not give the best growth efficiency.
| Abi-Ayad S M E A, Boutiba Z, Mélard C, Kestemont P. 2004. Dynamics of total body fatty acids during early ontogeny of pikeperch (Sander lucioperca) larvae. Fish Physiol. Biochem., 30 (2): 129-136, http://dx.doi.org/10.1007/s10695-005-3417-9. |
| Ali M, Nicieza A, Wootton R J. 2003. Compensatory growth in fishes: a response to growth depression. Fish and Fisheries, 4 (2): 147-190, http://dx.doi.org/10.1046/j.1467- 2979.2003.00120.x. |
| Ali M, Wootton R J. 2001. Capacity for growth compensation in juvenile three-spined sticklebacks experiencing cycles of food deprivation. J. Fish Biol., 58 (6): 1 531-1 544, http://dx.doi.org/10.1111/j.1095-8649.2001.tb02310.x. |
| álvarez D, Nicieza A G. 2005. Compensatory response ‘defends' energy levels but not growth trajectories in brown trout, Salmo trutta L. Proc. R oy. Soc. B, 272 (1563): 601-607, http://dx.doi.org/10.1098/rspb.2004.2991. |
| AOAC. 1995. Official Methods of Analysis. 16th edn. Association of Official Analytical Chemists, Arlington, Virginia, USA. . |
| Basiao Z U, Doyle R W, Arago A L. 1996. A statistical power analysis of the ‘internal reference' technique for comparing growth and growth depensation of tilapia strains. J. Fish Biol., 49 (2): 277-286, http://dx.doi.org/10. 1111/j.1095-8649.1996.tb00023.x. |
| Bavčević L, Klanjšček T, Karamarko V, Aničić I, Legović T. 2010. Compensatory growth in gilthead sea bream (Sparus aurata) compensates weight, but not length. Aquaculture, 301 (1-4): 57-63, http://dx.doi.org/10.1016/j. aquaculture.2010.01.009. |
| Chmilevskii D A. 1998. The influence of low temperature on the growth of Oreochromis mossambicu s. Journal of Ichthyology, 38 (1): 92-99. |
| Christensen S M, McLean E. 1998. Compensatory growth in Mozambique tilapia (Oreochromis mossambicus), fed a sub-optimal diet. Croatian Journal of Fisheries, 56 (1): 3-19. |
| De Silva S S, Gunasekera R M, Austin C M. 1997. Changes in the fatty acid profiles of hybrid red tilapia, Oreochromis mossambicus × O. niloticus, subjected to short-term starvation, and a comparison with changes in seawater raised fish. Aquaculture, 153 (3-4): 273-290, http://dx.doi. org/10.1016/S0044-8486(97)00035-5. |
| Folch J, Lees M, Sloane Stanley G H. 1957. A simple method for the isolation and purification of total lipides from animal tissues. J. Biol. Chem., 226 (1): 497-509. |
| Gaylord T G, Gatlin D M. 2001. Dietary protein and energy modifications to maximize compensatory growth of channel catfish (Ictalurus punctatus). Aquaculture, 194 (3- 4): 337-348, http://dx.doi.org/10.1016/S0044-8486(00) 00523-8. |
| Gaylord T G, MacKenzie D S, Gatlin D M. 2001. Growth performance, body composition and plasma thyroid hormone status of channel catfish (Ictalurus punctatus) in response to short-term feed deprivation and refeeding. Fish Physiol. Biochem., 24 (1): 73-79, http://dx.doi.org/10.1023/A:1011199518135. |
| Gunasekera R M, De Silva S S, Ingram B A. 2001. Chemical changes in fed and starved larval trout cod, Maccullochella macquarensis during early development. Fish Physiol. Biochem., 25 (4): 255-268, http://dx.doi.org/10.1023/A: 1023247718139. |
| Hayward R S, Noltie D B, Wang N. 1997. Use of compensatory growth to double hybrid sunfish growth rates. Transactions of the American Fisheries Society, 126 (2): 316-322, http://dx.doi.org/10.1577/1548-8659(1997)126<0316:NUOCGT> 2.3.CO;2. |
| Hornick J L, Van Eenaeme C, Gérard O, Dufrasne I, Istasse L. 2000. Mechanisms of reduced and compensatory growth. Domest. Anim. Endocrinol., 19 (2): 121-132, http://dx.doi. org/10.1016/S0739-7240(00)00072-2. |
| Jobling M, Johansen S J. 1999. The lipostat, hyperphagia and catch-up growth. Aquacult. Res., 30 (7): 473-478, http://dx.doi.org/10.1046/j.1365-2109.1999.00358.x. |
| Jezierska B, Hazel J R, Gerking S D. 1982. Lipid mobilization during starvation in the rainbow trout, Salmo gairdneri Richardson, with attention to fatty acids. J. Fish Biol., 21 (6): 681-692, 1http://dx.doi.org/10.1111/j.095-86491982.tb02872.x. |
| Le Cren E D. 1951. The length-weight relationship and seasonal cycle in gonad weight and condition in the perch (Perca fluviatilis). J. Anim. Ecol., 20 (2): 201-219, http://www.jstor.org/stable/1540. |
| Liu M M, Luo H Z, Fu R B, Peng Z L, Shi Z H, Mao Z Z. 2009. Biochemical composition, amino acid and fatty acid composition in juvenile of Miichthys miiuy under shorttime starvation. Acta Hydrobiol. Sin., 33 (2): 230-235, http://dx.doi.org/10.3724/SP.J.0000.2009.20230. |
| Luo Z, Tan X Y, Wang W M, Fan Q X. 2009. Effects of longterm starvation on body weight and body composition of juvenile channel catfish, Ictalurus punctatus, with special emphasis on amino acid and fatty acid changes. J. Appl. Ichthyol., 25 (2): 184-189, http://dx.doi.org/10.1111/j. 1439-0426.2009.01216.x. |
| Metcalfe N B, Monaghan P. 2001. Compensation for a bad start: grow now, pay later?. Trends Ecol. Evol., 16 (5): 254- 260, http://dx.doi.org/10.1016/S0169-5347(01)02124-3. |
| Miglavs I, Jobling M. 1989. The effects of feeding regime on proximate body composition and patterns of energy deposition in juvenile Arctic charr, Salvelinus alpinus. J. Fish Biol., 35 (1): 1-11. |
| Navarro I, Blasco J, Baños N, Gutiérrez J. 1997. Effects of fasting and feeding on plasma amino acid levels in brown trout. Fish Physiol. Biochem., 16 (4): 303-309, http://dx.doi.org/10.1023/A:1007759316656. |
| Nicieza A G, álvarez D. 2009. Statistical analysis of structural compensatory growth: how can we reduce the rate of false detection?. Oecologia, 159 (1): 27-39, http://dx.doi.org/10.1007/s00442-008-1194-8. |
| Nicieza A G, Metcalfe N B. 1997. Growth compensation in juvenile Atlantic salmon: responses to depressed temperature and food availability. Ecology, 78 (8): 2 385- 2 400. |
| Nikki J, Pirhonen J, Jobling M, Karjalainen J. 2004. Compensatory growth in juvenile rainbow trout, Oncorhynchus mykiss (Walbaum), held individually. Aquaculture, 235 (1-4): 285-296, http://dx.doi.org/10. 1016/j.aquaculture.2003.10.017. |
| Qian X, Cui Y, Xiong B, Yang Y. 2000. Compensatory growth, feed utilization and activity in gibel carp, following feed deprivation. J. Fish Biol., 56 (1): 228-232, http://dx.doi. org/10.1111/j.1095-8649.2000.tb02101.x. |
| Shiau C Y, Pong Y J, Chiou T K, Tin Y Y. 2001. Effect of starvation on free histidine and amino acids in white muscle of milkfish Chanoschanos. Comp. Biochem. Physiol., 128 (3): 501-506, http://dx.doi.org/10.1016/S1096-4959(00)00350-X. |
| Tan X Y, Luo Z, Wang W M, Xiong B X, Yuan Y C, Fan Q X. 2009. Effects of starvation on body weight and body composition of small-sized channel catfish Ictalurus punctatus. Acta Hydrobiol. Sin., 33 (1): 39-45, http://dx. doi.org/10.3724/SP.J.1035.2009.00039. |
| Tidwell J H, Webster C, Clark J A. 1992. Effects of feeding, starvation, and refeeding on the fatty acid composition of channel catfish, Ictalurus punctatus, tissues. Comp. Biochem. Physiol. A, 103 (2): 365-368, http://dx.doi. org/10.1016/0300-9629(92)90595-H. |
| Wang Y, Cui Y B, Yang Y X, Cai F S. 2000. Compensatory growth in hybrid tilapia, Oreochromis mossambicus × O. niloticus, reared in seawater. Aquaculture, 189 (1-2): 101- 108, http://dx.doi.org/10.1016/S0044-8486(00)00353-7. |
| Wu L, Xie S, Cui Y, Wootton R J. 2003. Effect of cycles of feed deprivation on growth and food consumption of immature three-spined sticklebacks and European minnows. J. Fish Biol., 62 (1): 184-194, http://dx.doi.org/10.1046/j.1095- 8649.2003.00018.x. |
| Xie S, Zhu X, Cui Y, Wootton R J, Lei W, Yang Y. 2001. Compensatory growth in the gibel carp following feed deprivation: temporal patterns in growth, nutrient deposition, feed intake and body composition. J. Fish Biol., 58 (4): 999-1 009. |
| Zamal H, Ollevier F. 1995. Effect of feeding and lack of food on the growth, gross biochemical and fatty acid composition of juvenile catfish. J. Fish Biol., 46 (3): 404- 414, http://dx.doi.org/10.1111/j.1095-8649.1995.tb05980.x. |
| Zhu X, Cui Y, Ali M, Wootton R J. 2001. Comparison of compensatory growth responses of juvenile three-spined stickleback and minnow following similar food deprivation protocols. J. Fish Biol., 58 (4): 1 149-1 165, http://dx.doi.org/10.1111/j.1095-8649.2001.tb00562.x. |
| Zhu X M, Xie S T, Zou Z J, Lei W, Cui Y B, Yang Y X, Wootton R J. 2004. Compensatory growth and food consumption in gibel carp, Carassius auratus gibelio, and Chinese longsnout catfish, Leiocassis longirostris, experiencing cycles of feed deprivation and re-feeding. Aquaculture, 241 (1-4): 235-247, http://dx.doi.org/10.1016/j.aquaculture. 2004.07.027. |