 2015, Vol. 33
Shanghai University
Article Information
- WANG Jianyan (王建艳), ZHEN Yu (甄毓), MI Tiezhu (米铁柱), YU Zhigang(于志刚), WANG Guoshan (王国善)
- Development of a real-time PCR assay (SYBR Green I) for rapid identification and quantification of scyphomedusae Aurelia sp.1 planulae
- Chinese Journal of Oceanology and Limnology, 2015, 33(4): 974-987
- http://dx.doi.org/10.1007/s00343-015-4091-0
Article History
- Received Apr. 6, 2014;
- accepted in principle May 19, 2014;
- accepted for publication Jan. 5, 2015


2 College of Environmental Science and Engineering, Ocean University of China, Qingdao 266100, China;
3 Key Laboratory of Marine Environment and Ecology, Ministry of Education, Ocean University of China, Qingdao 266100, China;
4 College of Chemistry and Chemical Engineering, Ocean University of China, Qingdao 266100, China;
5 Key Laboratory of Marine Chemistry Theory and Technology, Ministry of Education, Ocean University of China, Qingdao 266100, China
In recent years, the worldwide proliferation of marine jellyfish has become a crucial ecological and social issue. Increasing scientific attention has been paid to the overabundance of jellyfish because of their interference in marine-oriented industries and marine ecological systems(Mills, 2001; Purcell, 2005; Purcell et al., 2007; Richardson et al., 2009). Jellyfish blooms are notorious for their negative effects on human industry and safety, such as clogging coastal power plant intakes and stinging swimmers. Moreover, they reduce fishery production by competing with fish for food and eating fish eggs and larvae(Purcell and Arai, 2001; Purcell et al., 2007). As long-term data on jellyfish abundance are limited, the mechanisms of jellyfish blooms are difficult to elucidate. It has been suggested that anthropogenic causes, such as eutrophication(Purcell, 2012), climate change(Purcell, 2005; Attrill et al., 2007), overfishing(Daskalov et al., 2007), aquaculture(Lo et al., 2008), marine construction(Duarte et al., 2012), biological invasion(Mills, 2001; Graham et al., 2003; Graham and Bayha, 2007), and aquarium exchange(Bolton and Graham, 2006)are related to increasing jellyfish blooms.
Most of the bloom-forming jellyfish are members of the Scyphomedusae and typically have a metagenetic life history with a benthic phase and a planktonic medusa stage. In these species, the fertilized eggs develop into free-swimming planula larvae, settle on hard substrates, and then metamorphose into sessile polyps. Under certain conditions, the polyps segment asexually(strobilation)to release ephyrae, which then develop into medusae(Russel, 1970). The taxonomy and identification of jellyfi sh has traditionally been based on morphological characteristics(Mayer, 1910; Kramp, 1961; Russel, 1970) and requires a great deal of time and dedication. The morphological plasticity and variability of jellyfish under different environmental conditions make identification even more difficult. Even so, precise identification is often only possible for adult stages. In the juvenile stages, polyps, planulae, and ephyrae are very tiny in body size(100 μm–10 mm), lack sufficient taxonomic characteristics, have fragile gelatinous bodies, and are easily damaged during sampling, accurate identification is almost impossible. These factors likely hinder investigations, despite the fact that their successful recruitment can positively affect the number of medusa stage individuals.
The scyphozoan genus Aurelia, commonly known as the moon jelly, is found in a variety of coastal waters. Power plant shut-downs caused by Aureliamedusae clogging the seawater intake screens have been reported in many areas of the world, such as Japan, Korea, India, Philippines, Australia, and the Baltic region, causing significant economic losses(Mills, 2001). The genus Aureliawas widely accepted to contain two or three species, which were the polar A. limbata, the cosmopolitan A. aurita, and the north Pacific A. labiate(Russel, 1970)as distinguished by traditional morphological methods. However, recent global phylogenic analysis of this genus based on the mitochondrial cytochrome c oxidase subunit I(mt COI) and nuclear ribosomal DNA(nrDNA)revealed at least 16 phylogenetic branches, i.e. 13 cryptic species including the three recognized ones(Dawson et al., 2005).
DNA barcoding has probably been the most widely applied molecular method for species-level identification. The goal of barcoding is to use short sequences of one or a few genes, such as 18S rDNA, 28S rDNA, internal transcribed spacer(ITS) and intergenic spacer(IGS), or the mt COI and mt16S rDNA genes, to identify known species or to aid in the discovery of new ones(Mcmanus and Katz, 2009). This method is applicable to all life stages of a given species, can be performed on parts of an organism, and is very feasible for identification of plankton samples. Thus, an extension of this technique is the use of barcode sequences to design species-specific primers or probes for real-time PCR(RT-PCR), which can be used to estimate absolute and relative abundances of species in unsorted bulk samples(Bucklin et al., 2011). Many studies based on RT-PCR assays for the detection and relative quantification of phytoplankton(Galluzzi et al., 2004; Yuan et al., 2012), marine animal larvae(Vadopalas et al., 2006; Pan et al., 2008; Hunter et al., 2012), pest eggs(Madani et al., 2005), and microorganisms(Ahmed et al., 2008)have been carried out. Molecular studies performed on cnidarians so far have mainly applied nuclear markers to resolve their phylogeny and phylogeography using tissues from the medusa stage(Zrzavý et al., 1998; Collins, 2002, Collins and Daly, 2005; Collins et al., 2006; Ki et al., 2008, 2009; Bayha et al., 2010). As for the identifi cation and quantification of jellyfish, especially for the juvenile stages(planulae, polyps, and ephyrae), only a few trial tests have been performed(Bayha and Graham, 2009; Ki et al., 2010).
As the transitional stage from pelagic medusae to benthic polyps, planulae play a vital role in jellyfish population dynamics. Unlike studies on medusae and polyps, those oNplanulae are scarce and have mostly investigated settlement under laboratory conditions(Brewer, 1976, 1978, 1984; Svane and Dolmer, 1995; Kroiher and Berking, 1999; Holst and Jarms, 2007; Ishii et al., 2008; Hoover and Purcell, 2009). However, little is known about the survivorship, abundance, and dispersion of jellyfish planulae in the field. This information is very important because planulae survivorship and dispersion have a positive effect on polyp abundance and distribution, and ephyra and medusa recruitment. A major hindrance to such studies may be planula identification, because most jellyfish planulae are generally translucent and similar in shape; moreover, planula body size ranges among different species overlap and are not useful for speciesidentification(Holst, 2012). Thus, identification and quantification of jellyfish planulae may be omitted in field investigations because species-specific morphological characteristics are lacking.
The aim of this study was to develop a rapid and precise method for the detection and quantification of jellyfish planulae(Aureliasp.1)in unsorted plankton samples. Additionally, the method developed was applied to investigate the temporal and spatial Aureliasp.1 planula distributions in the field. 2 MATERIAL AND METHOD 2.1 Specimen collection
Planula collection Mature female Aureliasp.1 medusae(planulae are carried in the brood pouch in the oral arms of the female medusae)were collected in September 2011 and 2012 from Jiaozhou Bay, Qingdao, China. Specimens were placed in a bucket filled with ambient seawater and transported to the laboratory. Newly released planulae were immediately collected from the incubation seawater by concentration with a 20-μm mesh net. Those swimming fast and with a mean ratio of diameter of the long axis(about 200 μm)to the short axis of ≥2 were used for the experiments to eliminate undeveloped planulae(Ishii, 2003). Planulae were stored at 4°C to be used as a positive control for spiked samples.
Medusa collectionAureliasp.1 medusae and other scyphozoan species dominant in Jiaozhou Bay(Rhopilema esculentum Kishinouye, 1891, Nemopilema nomurai Kishinouye, 1922, and Cyanea nozakiiKishinouye, 1891)were collected for DNA extraction. Another scyphomedusae Acromitussp., which has bloomed in South China Sea, was collected during a bloom. DNA was extracted from the five medusae and used for the primer
specificity check.Field sample collection Field samples for planula detection were collected monthly from July to September 2012, at the monitoring stations in Jiaozhou Bay(sampling stations shown in Fig. S1). Five liters surface seawater was filtered through a 76-μm mesh net, gelatinous fragments that were thought to be parts of the target medusae were removed to eliminate positive interference prior to filtering. The filtered net was stored at -70°C to be used for DNA extraction and RTPCR analysis.
 |
| Fig. S1 Maps showing the location of Jiaozhou Bay(a) and the plankton sample collection sites therein(b) |
Genomic DNA was extracted from all of the samples(planulae, medusae, and field plankton samples)with the DNeasy ®Blood & Tissue Kit(Qiagen, Hilden, Germany)following the manufacturer’s animal tissue protocol. DNA extract was eluted with 50 μL of elution buffer and stored at -20°C.
A 650-bp mt 16S rDNA fragment was amplified by conventional PCR from purified total Aurelia sp.1 medusa genomic DNA using the primers 16Sf: 5′-TCG ACT GTT TAC CAA AAA CAT AGC and 16Sr: 5′-ACG GAA TGA ACT CAA ATC ATG TAA G(Bridge et al., 1992). PCR amplification was set up in 25-μL reactions comprising 12.5 μL of 2×Es Taq Master Mix(CWBIO, Beijing, China), 1 μL offorward primer(10 μmol/L), 1 μL of reverse primer(10 μmol/L), 0.5 μL of template DNA, and 10 μL of ddH 2O. The temperature profile for amplification was 95°C for 8 min followed by 38 cycles of 95°C for 45 sec, 60°C for 1 min, and 72°C for 1.5 min, with an extension at 72°C for 10 min(Bayha and Graham, 2009).
Amplified products were purified and cloned into the pMD 18-T vector(TaKaRa, Dalian, Japan). The recombinant plasmids were extracted from Escherichia colihosts using a Mini Plasmid Kit(CWBIO, Beijing, China) and sequenced by the Beijing Genomics Institute(BGI, Beijing, China). Genomic DNA and recombinant plasmids of the target mt 16S rDNA fragments were prepared to verify the specificity of the species-specific primers designed. 2.3 Primer design and specificity
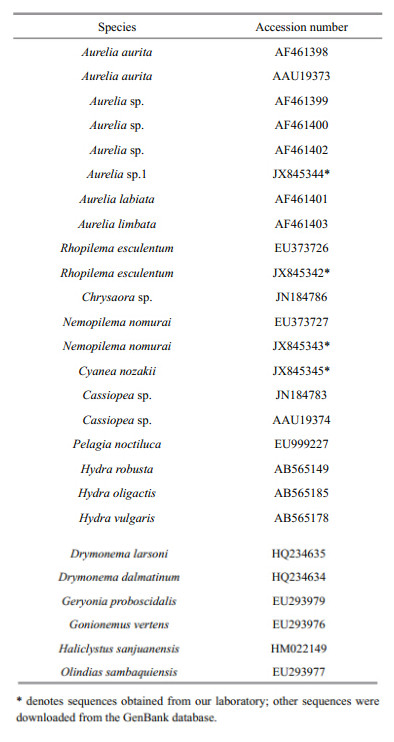
A partial Aureliasp.1 mt 16S rDNA sequence was aligned with sequences from 27 cnidarians homologous to Aureliasp.1(Table S1)using ClustalX 1.81 to visualize species-specific sequences in Aureliasp.1; the primers were designed in Primer Premier 6.0. To confirm the primer specificity, Primer BLAST was used to search published sequences identical to the primers in the GenBank database. Pairs of c and idate primers that were only identical to Aureliasequences were chosen and synthesized.
As Aureliasp.1 is the only Aureliaspecies in China, based on mitochondrial COI sequences(Cheng et al., 2012), specificity to genus rather than species was sufficient for identification. The specificity of the primers designed in the present study was first validated with the DNA extracted from the umbrella tissues from dominant adult medusae in China’s waters(R. esculentum, N.nomurai, C. nozakii, and Acromitussp.)by conventional PCR; the primers chosen for the RTPCR assay were those whose specificity was reconfirmed by an RT-PCR assay using recombinant plasmids carrying the target 16S rDNA fragment of those five medusae as template DNA with an identical concentration of 106 copies/L.
 |
Real-time PCR assays were performed on an Applied Biosystems ®7500 real-time PCR System(Applied Biosystems, California, USA)in a final volume of 30 μL containing 15 μL of 1×FastStart Universal SYBR Green Master(ROX)(Roche Life Science Ltd., Mannheim, Germany), 0.9 μL of primers(at a final concentration of 0.3 μmol/L), 10.2 μL ddH2O, and 3 μL of template DNA(st and ard curve points or sample DNA). The following quantification cycling protocol was used: 95°C for 10 min, followed by 40 cycles of 95°C for 15 sec and 60°C for 1 min. At the end of each reaction, a dissociation protocol was performed to ensure that only the specific PCR product was present. Experiments were performed in triplicate for each sample. In addition to the sample template DNA, each RT-PCR reaction included st and ard curve points established by serially diluted plasmids containing the target sequence and a non-2.5 Construction of st and ard curves
A series of plasmid st and ard samples(approximately 101–108copies of recombinant plasmids carrying the target mt 16S rDNA)were prepared by 10-fold dilutions of the recombinant plasmid solution. The concentration of the original Aureliasp.1 recombinant plasmid solution was estimated by measuring the optical density at 260 nm in a Picodrop microliter spectrophotometer(Picodrop, Essex, UK). The calibration curve was established with the threshold cycle(Ct)values against the denary logarithms of the recombinant plasmid copy numbers(lgNplasmid). The RT-PCR amplification efficiency was calculated based on the slopes from the calibration curve according to the equation E=10 (-1/slope)–1.
Jellyfish planulae are multicellular organisms and each individual may possess a different number of cells. Variation in cell numbers among planulae may bias the RT-PCR results. Different numbers of Aureliasp.1 planulae(1, 5, 10, 50, and 100 planulae)were collected to extract DNA, on which RT-PCR for the st and ard planula curve construction was performed. 2.6 Method optimization
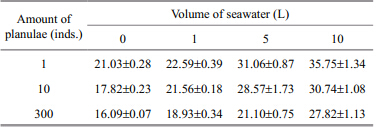
For the plankton field samples, there are many factors inhibiting the RT-PCR reaction, such as plankton DNA and suspended materials in the seawater. Some measures were applied to alleviate the inhibition. First, different numbers of planulae(1, 10, and 300)spiked with different volumes of seawater(1, 5, and 10 L)were tested to determine an ideal sampling volume. Serial dilutions(2–105-fold)of sample DNA and different concentrations(0–1.0 μg/μL)of bovine serum albumin(BSA)were then used to remove inhibitors from the RT-PCR assay and optimize the assay’s applicability to the field samples. 2.7 Validation and application
As microscopic identification of planulae in the field samples was difficult, a comparison between microscopy and molecular(qPCR)results was performed using the spiked samples. Known numbers of Aureliasp.1 planulae(5, 10, and 50 planulae)spiked with seawater collected from Jiaozhou Bay were tested by RT-PCR assay, taking samples containing no planula as the background control and the same amount of Aureliasp.1 planulae(5, 10, and 50 planulae)as the positive control. All samples were filtered throughout a 76-μm mesh net. DNA on the net was extracted with the DNeasy ®Blood & Tissue Kit(Qiagen). The microscopy and qPCR results were compared.
The field samples collected monthly from July to September 2012 in Jiaozhou Bay were analyzed by this method to elucidate Aureliasp.1 planula temporal and spatial distributions. 3 RESULT 3.1 Mt 16S rDNA sequence analysis
The Aureliasp.1 mt 16S rDNA fragment was amplified from genomic DNA with the 16Sf and 16Sr primers. Recombinant plasmids carrying the target fragment were extracted and confirmed by the sequencing results. The target fragment was submitted to GenBank under the accession No. JX845344. 3.2 Primer specificity
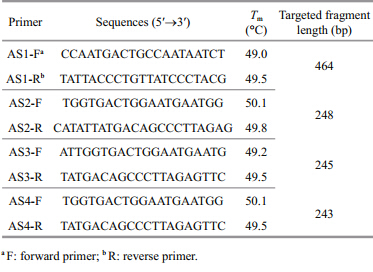
Four Aureliasp.1 species-specific primer pairs(shown in Table 1)were designed based on the analysis of the target mt 16S rDNA fragment. Conventional PCR was performed with the c and idate primers, and the primer pair AS3-F/R performed best with only one expected amplicon of 245 bp for Aureliasp.1 at an annealing temperature of 60.0°C, and no amplification was observed in either the negative control without DNA templates or in the controls with DNA from other scyphozoan jellyfish.
Based on the conventional PCR specificity tests, the primer pair AS3-F/R was chosen for the RT-PCR assay. Melting curve analysis of the RT-PCR with SYBR Green I revealed only a single peak at a melting temperature of 76.6±0.0°C and no non-specific amplicon was observed. RT-PCR amplification profiles of the five medusa DNAs(Aureliasp.1, R. esculentum, N. nomurai, C. nozakii, and Acromitussp.)confirmed that the primer pair was specific to Aureliasp.1(Fig. S2).
 |
| Fig. S2 Amplification profiles of Aureliaasp.1 recombinant plasmid DNA and that of the other four medusa species 1. Aureliaasp.1; 2. Acromitussp.; 3. R. esculentum; 4. C. nozakii; 5. N. nomurai; 6. NTC(no template control). Only the Aureliaa sp.1 recombinant plasmid was amplified in the real-time PCR assay, confirming the primer specificity. |
The calibration curve was constructed with 10-fold serial dilutions of plasmids carrying the Aurelia sp.1 mt 16S rDNA fragment. The dynamic range was from 102–108copies(up to 7 orders of magnitude). Additionally, a strong linear relationship between the Ctvalue and the plasmid copy number was demonstrated. The regression equation for recombinant plasmids was y=-3.472 x+36.855(R2=0.997), in which xindicated the denary logarithm of the plasmid copy number(lgNplasmid) and ywas the Ctvalue(Fig. 1). The amplification efficiency was 94.06%.
 |
| Fig. 1 St and ard curve generated from plasmids containing Aurelia asp.1 mt 16S rDNA sequences with the speciesspecific primer pair AS3-F/R
Error bars represent st and ard deviations of triplicate real-time PCR reactions. |
Different amounts of Aureliasp.1 planulae(1, 5, 10, 50, and 100 planulae)were used for the Aureliasp.1 planula st and ard curve construction(Fig. 2). The regression equation for Aureliasp.1 planulae was y= -3.424 x+20.540(R2=0.998), in which xindicated the denary logarithm of the planula number(lgNplanula) and ywas the Ctvalue. The amplification efficiency was 95.91%.
Through the two st and ard curves above, a regression relationship betweeNplanula number and mt 16S rDNA plasmid copy number was established. The regression equation was y=0.986 x+4.699(R2=0.997), in which x and yindicated the denary logarithm of the planula number(lgNplanula) and the recombinant plasmid copy number(lgNplasmid), respectively. Conversions of qPCR Ct value, mt 16S rDNA gene copy number, and planula number were carried out. By plotting the Ctvalues on the plasmid st and ard curve, the amount of mt 16S rDNA gene copies in the sample was calculated; by subsequently plotting the number of mt 16S rDNA gene copies on the planula st and ard curve, the number of planulae was calculated. Considering the dilution factor(DNA extract was dissolved in elution buffer with a final volume of 50 μL and 3 μL of DNA solution was used for the RT-PCR), one planula contained 8.33 ±1.69×10⁵mt 16S rDNA copies.
 |
| Fig. 2 St and ard curve generated from Aureliaasp.1 planulae with the species-specific primer pair AS3-F/R
Error bars represent st and ard deviations of triplicate real-time PCR reactions. |
Traditionally, large-volume sampling improves specimen validity. However, this is laborious and may induce a lot of background DNA and other inhibitors concentrated on the net. We tested 1, 10, and 300 planulae spiked with different volumes of seawater to determine an ideal sampling volume. For a fixed amount of planulae, the RT-PCR Ctvalue rose with increasing seawater volume(Table 2), suggesting that inhibitors in large volumes of seawater significantly effects RT-PCR amplification. RT-PCR Ct values all exceeded 30 in 10 L of seawater, thus 5 L was considered to be the balance between specimen validity and sample inhibition.
Two methods were used to test their potential for removing RT-PCR inhibitors from the field samples: serial dilution of the DNA extract and addition of BSA to the PCR reaction mixture. An RT-PCR assay was carried out on 5 L of seawater collected from station A3 in July 2012. Ct values of the serial dilutions(undiluted, 2-fold, 5-fold, and 10-fold diluted samples)were undetected(undetected is indicated by a Ct value of 40 in the Fig. 3), with the values being 39.40±0.69, 27.92±0.09, and 23.93±0.08, respectively(Fig. 3), exhibiting an increase of signal in fluorescence detected by RT-PCR. Thus, dilutions of the sample DNA significantly reduced RT-PCR assay inhibitors(P<0.05 by t-test). Moreover, when the sample DNA was diluted 100-fold or more, there was a significant linear relationship between the Ct value and the dilution(Ct=3.377·lgN dilution+18.939, R2=0.998), which meant that DNA at dilution equal to or higher than 1:100 were amplified without inhibition.
 |
| Fig. 3 Real-time PCR efficiencies for different dilutions of the field samples |
Considering that a lot of unknown inhibitors were likely concentrated on the net during sampling, BSA was added to the PCR reaction mixture to remove them. For the 100-fold diluted DNA, with increasing BSA in the reaction mixture, Ct values first decreased and then rose at 0.1 μg/μL BSA. When the BSA concentration was >0.5 μg/μL, Ctvalues were much higher than those of samples without BSA(Fig. 4). The results revealed that moderate amounts of BSA effectively reduced inhibitors in the assay, but inhibition again increased when more BSA was added. Accordingly, a concentration of 0.2 μg/μL(a concentration usually applied in RT-PCR)of BSA additive was determined as optimum for PCR in this study.
 |
| Fig. 4 Effect of BSA on Ct values in real-time PCR analysis
Ct values first decreased with the addition of BSA and then rose from 0.1 μg/μL. When BSA concentrations were >0.5 μg/μL, Ctvalues were much higher than those of samples without BSA, meaning that BSA could facilitate the RT-PCR at low concentrations, but the inhibition effect returned at higher concentrations. |
For the spiked samples, planula numbers calculated by RT-PCR were identical to those counted microscopically(Fig. 5).
 |
| Fig. 5 Comparison of the microscopy(white column) and real-time PCR(black column)results for the quantification of Aureliaasp.1 planula numbers in spiked samples |
Based on the RT-PCR assay developed and optimized above, Aureliasp.1 planula abundance in samples collected from Jiaozhou Bay in July, August, and September 2012 was quantified. The results revealed that Aureliasp.1 planula abundance was generally low, especially in August and September(Table S2 and Fig. 6). Planulae were detected at 11 out of the 12 stations investigated in July(0.04–10.72 inds./L), 2 out of 12 stations in August(0.01 inds./L and 0.04 inds./L), and 2 out of 11 stations in September(0.01 and 0.02 inds./L). Aurelia sp.1 planulae were abundant in July with an average density of 1.58 inds./L. Peak abundances occurred at stations D6, D7, and A3 with 10.72, 3.83, and 2.05 inds./L, respectively. Planulae decreased to almost zero in August and September and were only detected twice in each month.
 |
| Fig. 6 Aureliaasp.1 planula densities(inds./L)in Jiaozhou Bay surface water from July–September 2012 |

The accurate identification of planulae, polyps, and ephyrae using traditional methods is very difficult and has become an obstacle for the study of jellyfish population dynamics. In most temperate waters, Aureliaspp. planulae are released by female medusae following sexual reproduction in the fall, and metamorphose into polyps following settlement(Lucas, 2001). Planulae face many challenges once released into the seawater, e.g., suspension, navigation, sinking in the water column, avoidance of predators and unfavorable conditions, and settlement selection(Chia et al., 1984). Each of these challenges will influence the survival and recruitment of planulae, and consequently effect polyps. Until recently, most studies performed oNplanulae have concentrated on settlement and metamorphosis under laboratory conditions(Brewer, 1976; Keen, 1987; Müller and Leitz, 2002; Holst and Jarms, 2007; Hoover and Purcell, 2009). However, as the planulae are tiny and hard to identify, abundance and distribution data in the field is scarce. The real-time PCR assay developed here will provide an effective method to resolve this problem.
RT-PCR is now widely applied in medical and biological fields and has become an invaluable research tool. Among the fluorescent reagents, SYBR Green I, TaqMan probe, and molecular beacon are the most widely used in RT-PCR applications of environmental samples(Zhang and Fang, 2006). Compared with other assays, the SYBR Green I assay is the simplest and cheapest. It is based on an intercalation of double-str and ed DNA-binding dyes and can be easily applied to already established conventional PCR assays without any additional fluorescence-labeled oligonucleotides. However, as the dye can bind with all double-str and ed DNA, both specific and nonspecific PCR products are detected in the assay. Therefore, the primers used in this assay must be carefully designed to ensure that only the target template is amplified. In this study, four Aureliasp.1 mt 16S rDNA specific primer pairs were designed, whose specificity in Aureliasp.1 individuals at different life stages and sensitivity in different samples were carefully tested by conventional PCR(Wang et al., 2013). Only one pair(AS3-F/R)was used in the RT-PCR assay because of its specificity and sensitivity, thus avoiding non-specific amplifications. In this work, the positive results from the field samples were also verified by sequencing RT-PCR amplicons. BLASTn analysis revealed that all of the amplicons were the expected Aurelia sp.1 mt 16S rDNA fragment(245 bp), and there was no amplification of either the negative or NTC samples, confirming that the primers were absolutely specific to Aurelia sp.1.
In this study, the primers were designed in the mitochondrial ribosomal 16S rDNA gene, instead of 18S rDNA or COI, which are widely used as DNA makers. In our previous work, Aureliasp.1 mt 16S rDNA, COI, and 18S rDNA fragments were all sequenced and became c and idates for specific primers; however, because 18S rDNA is relatively invariant between some scyphozoan species, mt 16S rDNA and COI were more suitable for specific primer design. The specificity and sensitivity test results for the primers conducted by conventional PCR further confirmed that mt COI was less suited for species marker placement having more primer dimers and lower PCR amplification efficiency than mt 16S rDNA(Wang et al., 2013), which has also been verified by other studies(Miglietta et al., 2009; Moura et al., 2011). Bayha and Graham(2009)found that intraspecific polymorphic regions in mt COI are more uniformly distributed than those in mt 16S rDNA, leaving fewer opportunities for probe placement, suggesting that the mt 16S region is better suited for probe placement. Moreover, mt 16S rDNA sequence data from 66 Aureliasampled globally unambiguously revealed seven different species within Aurelia(Schroth et al., 2002), suggesting that mt 16S rDNA is sufficient for Aureliaspecies identification. Therefore, we decided to place our taxon-specific primers within the mt 16S rDNA region.
We established two st and ard curves: one for recombinant plasmids and the other for planulae. The recombinant plasmid solution was diluted from 101–108copies and a strong linear relationship still existed among the curve points, while only two planula magnitudes(10 0–102)were used for st and ard curve construction. An increase in magnitude(>102)causedsevere deviation of the curve point because of reduced DNA extraction efficiency. At the same time, genomic and mitochondrial DNA degrades easily after frequent freezing and thawing, which will negatively affect target gene quantification. Additionally, planula samples can only be acquired once each summer, which is quite inconvenient for st and ard curve construction. However, because the extraction is both simple and convenient, the recombinant plasmids are more useful for calibrating RT-PCR assays, and their concentrations are easily calculated by measuring the optical densities even after long-term storage or frequent freezing and thawing. Therefore, establishment of two st and ard curves to find the mathematical correlation betweeNplasmid copies and planula numbers were more accurate and practical than the establishment of one curve for planulae alone.
In field samples, many inhibitors influence RTPCR reactions in natural water, e.g., extraneous humus, detris and other organism DNA. Various additives such as BSA, T4 gene 32 protein(Kreader, 1996), dithiothreitol, glycerol(Nagai et al., 1998), Tween 20, dimethyl sulfoxide(DMSO), and polyethylene glycol 400(Demeke and Adams, 1992)have been added to PCR reactions to alleviate inhibition. As a facilitator for the PCR reaction, BSA can reduce non-specific adsorption of target DNA or PCR reagents to the tube walls(Kalinina et al., 1997; Teo et al., 2002); it also provides an alternate substrate for protease or polyphenolics and thereby protects Taq DNA polymerase and its activity(Kreader, 1996; Wei et al., 2008). Furthermore, BSA can effectively reduce the effects of humic acids and other PCR inhibitors in environmental samples(Jiang et al., 2005). Since BSA is much cheaper than other additives, it is by far the more cost-effective one used in PCR. Additionally, dilution of samples or extracted DNA also provides a simple method to facilitate amplification because RT-PCR sensitivity can be exploited to amplify target DNA at very low concentrations when inhibitors have been diluted out(Wilde et al., 1990; Tsai and Olson, 1992; Xia et al., 1995; Wilson, 1997; Chandler et al., 1998). In this study, when the sample DNA was diluted >10-fold, the inhibitors were almost diluted out and there was a strong linear relationship between the Ct value and dilution fold. It was noteworthy that with the optimization of dilution and the addition of BSA, this assay could amplify up to ten mt 16S rDNA copies and even one planula in the spiked sample was detected when the extracted DNA was 1 000-fold diluted(data not shown). Therefore, the sensitivity of this method will allow for the detection of Aureliaplanulae at very low concentrations in field and diluted samples.
Theoretically, planula abundance quantified with RT-PCR should be compared with those counted microscopically. However, species-level identification of planulae under a microscope is nearly impossible. In this study, we used two st and ard curves(plasmid st and ard curve and planula st and ard curve)to carry out conversions of RT-PCR Ct values, mt 16S rDNA gene copy numbers, and planula numbers, through which the planula number was determined. As planulae are multicellular organisms, using the RTPCR assay to quantify planula numbers in field samples is based on the assumption that the numbers of mt 16S rDNA copies are the same in all cells and cell numbers are the same in all planulae. Validation of the method with spiked samples revealed that planula numbers calculated by the RT-PCR assay were identical to those counted microscopically; suggesting that the RT-PCR assay developed in this study was valid and practicable.
Maximum abundances of Aureliaspp. medusae are often <1 inds./m3(Möller, 1980; Barz and Hirche, 2007). Densities up to 24.9 and 71 inds./m3have been observed in English(Lucas, 1996) and Japanese(Yasuda, 1969)coastal waters, respectively. The number of planulae produced per female medusa with a bell diameter of 100 cm is approximately 5 000–17 000(Lucas, 1996). In Jiaozhou Bay, the reproductive output is approximately 10 000 planulae(counted by the author under a dissecting microscope). If we take the lowest and highest abundance of 1 and 71 inds./m3as examples, combined with 50% of the female medusae accounting for the total medusae and a reproductive productivity of 10 000, the theoretical peak abundance of planulae in seawater is approximately 5–355 inds./L. In Jiaozhou Bay, peak Aureliasp.1 medusa density was 3.0 inds./m3in July(Wan and Zhang, 2012); peak planula abundance was ~15 inds./L. Aureliasp.1 planula abundance in Jiaozhou Bay quantified in this study was 0–10.72 inds./L, which is in agreement with the theoretical number. This indicates that the RT-PCR assay developed here could be used in the rapid and relative quantification of Aureliasp.1 planulae in field samples.
The annual population dynamics of Aureliasp.1 in Jiaozhou Bay have been described in previous studies(Wan and Zhang, 2012; Wang et al., 2012). In 2009(Wan and Zhang, 2012), ephyrae first occurred in April, abundance peaked in June, and they disappeared in July. Medusae dominated in July and disappeared in August. In another study(Wang et al., 2012), mainly focusing on the population dynamics during summer(from 1 August to 30 September, 2011), Aureliasp.1 medusa abundance decreased from the 1stAugust and reached zero in late September. Our results revealed that Aurelia sp.1 planulae peaked in July, decreased greatly in August, and were almost undetectable in September, which was in accordance with medusa temporal population dynamics.
According to our results, Aurelia sp.1 planulae mainly aggregated in two regions of Jiaozhou Bay in July, one located at the northern bay(station A3) and the other at the outer bay(stations D6 and D7). Studies of medusa spatial distribution in Jiaozhou Bay are usually limited to the stations located in the inner bay. In Wan and Zhang(2012)investigation, peak medusa abundance(3.0 inds./m3)occurred at a station(7–3 station)near Hongdao Isl and . Additionally, Wang et al.(2012)reported that Aureliasp.1 medusae were most abundant in the northern bay during summer of 2011, which was also near Hongdao Isl and . Peak planula abundance detected in this study was consistent with that of medusa peak abundance.
For decades, the coastal waters of Jiaozhou Bay have been used for aquaculture; the bay has been occupied by sea cucumber hanging-culture rafts, especially near Hongdao Isl and waters. As Aureliaspp. polyps are known to settle on the undersides of floating structures(Miyake et al., 2002), the aquaculture rafts may provide shaded surfaces for larval settlement and increase planulae, ephyrae, and jellyfish retention(Lo et al., 2008). Based on the fact that both medusa and planula peak abundance were detected at stations near Hongdao Isl and , we speculate that mature Aureliasp.1 medusae aggregated in the northern bay because of hydrodynamic forces and subsequently spawned there. The extensive aquaculture rafts near Hongdao Isl and may facilitate the aggregation of medusae and provide more substrates for planula settlement, which, to some extent, will contribute to increasing Aurelia abundance in the following year.
Another Aureliasp.1 planula abundance peak occurred in July in the outer bay off Qingdao(stations D6 and D7). A previous model has shown that medusae originating from the Haizhou Bay and Jiangsu coast areas in March may arrive at Qingdao offshore in July having been transported with sea currents(Zhang et al., 2012). This might be the reason that medusae originating in the Haizhou Bay and Jiangsu coast areas approached and aggregated offshore at Qingdao in July, following which a large number of planulae were released. Therefore, our results oNplanula abundance and spatial distribution closely resembled those of the medusae.
There were a lot of difficulties and uncertainties confronted when this method was used in the field and further work is necessary. One drawback of this method is in the sampling. A false-positive effect may be introduced by Aureliasp.1 medusa body fragments. We have tried to minimize this unintended effect by eliminating suspect fragments from samples by eye during filtering; however, fragments invisible to the naked eye cannot be eliminated. Moreover, tiny tissues or debris, such as nematocysts or DNA from any Aureliasp.1 life stages(ephyrae, polyps, or medusae)may remain on the mesh net and interfere with the results. The mesh net used in the present study was 76 μm, as Aurelianematocysts are ca. 10 μm in length(long axis)(Russel, 1970; Calder, 1997; Baxter et al., 2010); therefore, most of the nematocysts in the seawater can be filtered through a mesh this size. 5 CONCLUSION
In this study, we developed a rapid and specific assay for planula identification and relative quantification, which is difficult to carry out microscopically. This assay will be useful in temporal and spatial planula distribution studies. The information obtained will strengthen our knowledge on the survivorship, aggregation, and settlement of jellyfish planulae in the field. Furthermore, planula numbers can be used to calculate the contribution of sexual reproduction to the asexual stage or to jellyfish bloom formation, which is very important in jellyfish studies. 6 ACKNOWLEDGEMENT
We sincerely thank LI Chaolun, ZHANG Guangtao, ZHAO Zengxia, and colleagues on the R/V Chuang-Xinfor assistance with sample collection. The authors would like to thank the editor and anonymous reviewers for their valuable comments and suggestions to improve the quality of this paper.
| Ahmed W, Huygens F, Goonetilleke A, Gardner T. 2008. Realtime PCR detection of pathogenic microorganisms in roof-harvested rainwater in Southeast Queensland, Australia. Appl. Environ. Microbiol., 74 (17): 5 490-5 496. |
| Attrill M J, Wright J, Edwards M. 2007. Climate-related increases in jellyfish frequency suggest a more gelatinous future for the North Sea. Limnol. Oceanogr., 52 (1): 480- 485. |
| Barz K, Hirche H J. 2007. Abundance, distribution and prey composition of scyphomedusae in the southern North Sea. Mar. Biol., 151 (3): 1 021-1 033. |
| Baxter E J, Walne A W, Purcell J E, McAllen R, Doyle T K. 2010. Identification of jellyfish from continuous plankton recorder samples. Hydrobiologia, 645 (1): 193-201. |
| Bayha K M, Dawson M N, Collins A G, Barbeitos M S, Haddock S H D. 2010. Evolutionary relationships among scyphozoan jellyfish families based on complete taxon sampling and phylogenetic analyses of 18S and 28S ribosomal DNA. Integr. Comp. Biol., 50 (3): 436-455. |
| Bayha K M, Graham W M. 2009. A new Taqman © PCR-based method for the detection and identification of scyphozoan jellyfish polyps. Hydrobiologia, 616 (1): 217-228. |
| Bolton T F, Graham W M. 2006. Jellyfish on the rocks: bioinvasion threat of the international trade in aquarium live rock. Biol. Invasions, 8 (4): 651-653. |
| Brewer R H. 1976. Larval settling behavior in Cyanea capillata (Cnidaria: Scyphozoa). Biol. Bull., 150 (2): 183-199. |
| Brewer R H. 1978. Larval settlement behavior in the jellyfish Aurelia aurita (Linnaeus) (Scyphozoa: Semaeostomeae). Estuaries, 1 (2): 120-122. |
| Brewer R H. 1984. The influence of the orientation, roughness, and wettability of solid surfaces on the behavior and attachment of planulae of Cyanea (Cnidaria: Scyphozoa). Biol. Bull., 166 (1): 11-21. |
| Bridge D, Cunningham C W, Schierwater B, DeSalle R, Buss L W. 1992. Class-level relationships in the phylum Cnidaria: evidence from mitochondrial genome structure. Proc. Natl. Acad. Sci. USA, 89 (18): 8 750-8 753. |
| Bucklin A, Steinke D, Blanco-Bercial L. 2011. DNA barcoding of marine metazoa. Annu. Rev. Mar. Sci., 3 (1): 471-508. |
| Calder D R. 1977. Nematocysts of the ephyra stages of Aurelia, Chrysaora, Cyanea, and Rhopilema (Cnidaria, Scyphozoa). Trans. Amer. Microsc. Soc., 96 (1): 13-19. |
| Chandler D P, Wagnon C A, Bolton H. 1998. Reverse transcriptase (RT) inhibition of PCR at low concentrations of template and its implications for quantitative RT-PCR. Appl. Environ. Microbiol., 64 (2): 669-677. |
| Cheng F P, Wang M X, Wang Y T, Zhang F, Li C L, Sun S. 2012. DNA barcoding of common medusozoa in Northern China based on mtCOI sequence. Oceanologia Et Limnologia Sinica, 43 (3): 451-459. (in Chinese with English abstract) |
| Chia F S, Buckland-Nicks J, Young C M. 1984. Locomotion of marine invertebrate larvae: a review. Can. J. Zool., 62 (7): 1 205-1 222. |
| Collins A G, Daly M. 2005. A new deepwater species of Stauromedusae, Lucernaria janetae (Cnidaria, Staurozoa, Lucernariidae), and a preliminary investigation of stauromedusan phylogeny based on nuclear and mitochondrial rDNA data. Biol. Bull., 208 (3): 221-230. |
| Collins A G, Schuchert P, Marques A C, Jankowski T, Medina M, Schierwater B. 2006. Medusozoan phylogeny and character evolution clarified by new large and small subunit rDNA data and an assessment of the utility of phylogenetic mixture models. Syst. Biol., 55 (1): 97-115. |
| Collins A G. 2002. Phylogeny of Medusozoa and the evolution of cnidarian life cycles. J. Evolution. Biol., 15 (3): 418- 432. |
| Daskalov G M, Grishin A N, Rodionov S, Mihneva V. 2007. Trophic cascades triggered by overfishing reveal possible mechanisms of ecosystem regime shifts. Proc. Natl. Acad. Sci. USA, 104 (25): 10 518-10 523. |
| Dawson M N, Gupta A S, England M H. 2005. Coupled biophysical global ocean model and molecular genetic analyses identify multiple introductions of cryptogenic species. Proc. Natl. Acad. Sci. USA, 102 (34): 11 968- 11 973. |
| Demeke T, Adams R P. 1992. The effects of plant polysaccharides and buffer additives on PCR. Biotechniques, 12 (3): 332-334. |
| Duarte C M, Pitt K A, Lucas C H, Purcell J E, Uye SI I, Robinson K, Brotz L, Decker M B, Sutherland K R, Malej A, Madin L, Mianzan H, Gili J M, Fuentes V, Atienza D, Pages F, Breitburg D, Malek J, Graham W M, Condon R H. 2012. Is global ocean sprawl a cause of jellyfish blooms? Front. Ecol. Environ., 11 (2): 91-97. |
| Galluzzi L, Penna A, Bertozzini E, Vila M, Garces E, Magnani M. 2004. Development of a real-time PCR assay for rapid detection and quantification of Alexandrium minutum (a Dinoflagellate). Appl. Environ. Microbiol., 70 (2): 1 199- 1 206. |
| Graham W M, Bayha K M. 2007. Biological invasions by marine jellyfish. In : Nentwig W ed. Biological Invasions. 1st edn. Springer, Heidelberg, Germany. p.239-255. |
| Graham W M, Martin D L, Felder D L, Asper V L, Perry H M. 2003. Ecological and economic implications of a tropical jellyfish invader in the Gulf of Mexico. Biol. Invasions, 5 (1-2): 53-69. |
| Holst S, Jarms G. 2007. Substrate choice and settlement preferences of planula larvae of five Scyphozoa (Cnidaria) from German Bight, North Sea. Mar. Biol., 151 (3): 863- 871. |
| Holst S. 2012. Morphology and development of benthic and pelagic life stages of North Sea jellyfish (Scyphozoa, Cnidaria) with special emphasis on the identification of ephyra stages. Mar. Biol., 159 (12): 2 707-2 722. |
| Hoover R A, Purcell J E. 2009. Substrate preferences of scyphozoan Aurelia labiata polyps among common dockbuilding materials. Hydrobiologia, 616 (1): 259-267. |
| Hunter E, Taylor N, Fox C J, Maillard M, Taylor M I. 2012. Effectiveness of TaqMan probes for detection of fish eggs and larvae in the stomach contents of a teleost predator. J. Fish. Biol., 81 (1): 320-328. |
| Ishii H, Ohba T, Kobayashi T. 2008. Effects of low dissolved oxygen on planula settlement, polyp growth and asexual reproduction of Aurelia aurita. Plankton. Benthos Res., 3 (Supplement): 107-113. |
| Ishii H. 2003. Development time of planula larvae on the oral arms of the scyphomedusa Aurelia aurita. J. Plankton Res., 25 (11): 1 447-1 450. |
| Jiang J L, Alderisio K A, Singh A, Xiao L H. 2005. Development of procedures for direct extraction of Cryptosporidium DNA from water concentrates and for relief of PCR inhibitors. Appl. Environ. Microbiol., 71 (3): 1 135-1 141. |
| Kalinina O, Lebedeva I, Brown J, Silver J. 1997. Nanoliter scale PCR with TaqMan detection. Nucl eic Acids Res., 25 (10): 1 999-2 004. |
| Keen S L. 1987. Recruitment of Aurelia aurita (Cnidaria: Scyphozoa) larvae is position-dependent, and independent of conspecific density, within a settling surface. Mar. Ecol. Prog. Ser., 38 : 151-160. |
| Ki J S, Hwang D S, Lee J S. 2010. Simultaneous detection of Aurelia and Chrysaora scyphozoan jellyfish on a DNA microarray. J. Mar. Biol. Assn. UK, 90 (6): 1 111-1 117. |
| Ki J S, Hwang D S, Shin K, Yoon W D, Lim D, Kang Y S, Lee Y, Lee J S. 2008. Recent moon jelly (Aurelia sp.1) blooms in Korean coastal waters suggest global expansion: examples inferred from mitochondrial COI and nuclear ITS-5.8 S rDNA sequences. ICES J. Mar. Sci., 65 (3): 443- 452. |
| Ki J S, Kim I C, Lee J S. 2009. Comparative analysis of nuclear ribosomal DNA from the moon jelly Aurelia sp.1 (Cnidaria: Scyphozoa) with characterizations of the 18S, 28S genes, and the intergenic spacer (IGS). Hydrobiologia, 616 (1): 229-239. |
| Kramp P L. 1961. Synopsis of the Medusae of the World. Cambridge University Press, New York. 469p. |
| Kreader C A. 1996. Relief of amplification inhibition in PCR with bovine serum albumin or T4 gene 32 protein. Appl. Environ. Microbiol., 62 (3): 1 102-1 106. |
| Kroiher M, Berking S. 1999. On natural metamorphosis inducers of the cnidarians Hydractinia echinata (Hydrozoa) and Aurelia aurita (Scyphozoa). Helgoland Mar. Res., 53 (2): 118-121. |
| Lo W T, Purcell J E, Hung J J, Su H M, Hsu P K. 2008. Enhancement of jellyfish (Aurelia aurita) populations by extensive aquaculture rafts in a coastal lagoon in Taiwan. ICES J. Mar. Sci., 65 (3): 453-461. |
| Lucas C H. 1996. Population dynamics of Aurelia aurita (Scyphozoa) from an isolated brackish lake, with particular reference to sexual reproduction. J. Plankton Res., 18 (6): 987-1 007. |
| Lucas C H. 2001. Reproduction and life history strategies of the common jellyfish, Aurelia aurita, in relation to its ambient environment. Hydrobiologia, 451 (1-3): 229-246. |
| Madani M, Subbotin S A, Moens M. 2005. Quantitative detection of the potato cyst nematode, Globodera pallida, and the beet cyst nematode, Heterodera schachtii, using Real-Time PCR with SYBR green I dye. Mol. Cell. Probe., 19 (2): 81-86. |
| Mayer A G. 1910. Medusae of the World: The Hydromedusae. Carnegie institution of Washington, Washington D. C. 230p. |
| McManus G B, Katz L A. 2009. Molecular and morphological methods for identifying plankton: what makes a successful marriage? J. Plankton Res., 31 (10): 1 119-1 129. |
| Miglietta M P, Schuchert P, Cunningham C W. 2009. Reconciling genealogical and morphological species in a worldwide study of the Family Hydractiniidae (Cnidaria, Hydrozoa). Zoo. Scr., 38 (4): 403-430. |
| Jellyfish blooms: are populations increasing globally in response to changing ocean conditions? Mills C E. 2001.Hydrobiologia, 451 (1-3): 55-68. |
| Miyake H. Terazaki M, Kakinuma Y. 2002. On the polyps of the common jellyfish Aurelia aurita in Kagoshima Bay. J. Oceanogr., 58 (3): 451-459. |
| Möller H. 1980. Population dynamics of Aurelia aurita medusae in Kiel Bight, Germany (FRG). Mar. Biol., 60 (2- 3): 123-128. |
| Moura C J, Cunha M R, Porteiro F M, Rogers A D. 2011. The use of the DNA barcode gene 16S mRNA for the clarification of taxonomic problems within the family Sertulariidae (Cnidaria, Hydrozoa). Zoo. Scr., 40 (5): 520- 537. |
| Müller W A, Leitz T. 2002. Metamorphosis in the Cnidaria. Can. J. Zool., 80 (10): 1 755-1 771. |
| Nagai M, Yoshida A, Sato N. 1998. Additive effects of bovine serum albumin, dithiothreitol and glycerolon PCR. Biochem. Mol. Biol. Int., 44 (1): 157-163. |
| Pan M, McBeath A J, Hay S J, Pierce G J, Cunningham C O. 2008. Real-time PCR assay for detection and relative quantification of Liocarcinus depurator larvae from plankton samples. Mar. Biol., 153 (5): 859-870. |
| Purcell J E, Arai M N. 2001. Interactions of pelagic cnidarians and ctenophores with fish: a review. Hydrobiologia, 451 (1-3): 27-44. |
| Purcell J E, Uye S, Lo W. 2007. Anthropogenic causes of jellyfish blooms and their direct consequences for humans: a review. Mar. Ecol. Prog. Ser., 350 : 153-174. |
| Purcell J E. 2005. Climate effects on formation of jellyfish and ctenophore blooms: a review. J. Mar. Biol. Assn. UK, 85 (3): 461-476. |
| Purcell J E. 2012. Jellyfish and ctenophore blooms coincide with human proliferations and environmental perturbations. Ann. Rev. Mar. Sci., 4 (1): 209-235. |
| Richardson A J, Bakun A, Hays G C, Gibbons M J. 2009. The jellyfish joyride: causes, consequences and management responses to a more gelatinous future. Trends Ecol. Evol., 24 (6): 312-322. |
| Russell F S. 1970. The Medusae of the British Isles: 2. Pelagic Scyphozoa with a supplement to the first volume on hydromedusae. Cambridge University Press, New York. 283p. |
| Schroth W, Jarms G, Streit B, Schierwater B. 2002. Speciation and phylogeography in the cosmopolitan marine moon jelly, Aurelia sp. BMC Evol. Biol., 2 (1): 1. |
| Svane I, Dolmer P. 1995. Perception of light at settlement: a comparative study of two invertebrate larvae, a scyphozoan planula and a simple ascidian tadpole. J. Exp. Mar. Biol. Ecol., 187 (1): 51-61. |
| Teo I A, Choi J W, Morlese J, Taylor G, Shaunak S. 2002. LightCycler qPCR optimisation for low copy number target DNA. J. Immunol. Method., 270 (1): 119-133. |
| Tsai Y L, Olson B H. 1992. Detection of low numbers of bacterial cells in soils and sediments by polymerase chain reaction. Appl. Environ. Microbiol., 58 (2): 754-757. |
| Vadopalas B, Bouma J V, Jackels C R, Friedman C S. 2006. Application of real-time PCR for simultaneous identification and quantification of larval abalone. J. Exp. Mar. Biol. Ecol., 334 (2): 219-228. |
| Wan A Y, Zhang G T. 2012. Annual occurrence of moon jellyfish Aurelia sp.1 in the Jiaozhou Bay and its impacts on zooplankton community. .Oceanologia et Limnologia S inica, 43 (3): 494-501 (in Chinese with English abstract) |
| Wang J Y, Zhen Y, Wang G S, Mi T Z, Yu Z G. 2013. Molecular identification and detection of moon jellyfish (Aurelia sp.) based on partial sequencing of mitochondrial 16S rDNA and COI. Chinese Journal of Applied Ecology, 24 (3): 847-852.(in Chinese with English abstract) |
| Wang S W, Zhang G T, Sun S, Wang Y T, Zhao Z X. 2012. Population dynamics of three scyphozoan jellyfish species during summer of 2011 in Jiaozhou Bay. Oceanologia et Limnologia S inica, 43 (3): 471-479.(in Chinese with English abstract) |
| Wei T, Lu G J, Clover G. 2008. Novel approaches to mitigate primer interaction and eliminate inhibitors in multiplex PCR, demonstrated using an assay for detection of three strawberry viruses. J. Virol. Meth., 151 (1): 132-139. |
| Wilde J, Eiden J, Yolken R. 1990. Removal of inhibitory substances from human fecal specimens for detection of group A rotaviruses by reverse transcriptase and polymerase chain reactions. J. Clin. Microbiol., 28 (6): 1 300-1 307. |
| Wilson I G. 1997. Inhibition and facilitation of nucleic acid amplification. Appl. Environ. Microbiol., 63 (10): 3 741- 3 751. |
| Xia J Q, Yason C V, Kibenge F. 1995. Comparison of dot blot hybridization, polymerase chain reaction, and virus isolation for detection of bovine herpesvirus-1 (BHV-1) in artificially infected bovine semen. Can. J. Vet. Res., 59 (2): 102-109. |
| Yasuda T. 1969. Ecological studies on the jelly-fish, Aurelia aurita in Urazoko Bay, Fukui Prefecture–I: Occurrence pattern of the medusa. Bull. Jap. Soc. Sci. Fish., 35 (1): 1 - 6. (in Japanese with English abstract) |
| Yuan J, Mi T Z, Zhen Y, Yu Z G. 2012. Development of a rapid detection and quantification method of Karenia mikimotoi by real-time quantitative PCR. Harmful Algae, 17 : 83-91. |
| Zhang H Y, Zhao L, Wei H. 2012. Origin of the giant jellyfish in Qingdao offshore in summer. Oceanologia et Limnologia S inica, 43 (3): 662 - 668.(in Chinese with English abstract) |
| Zhang T, Fang H H P. 2006. Applications of real-time polymerase chain reaction for quantification of microorganisms in environmental samples. Appl. .Environ. Microbiol, 70 (3): 281-289. |
| Zrzavý J, Mihulka S, Kepka P, Bezděk A, Tietz D. 1998. Phylogeny of the Metazoa based on morphological and 18S ribosomal DNA evidence. Cladistics, 14 (3): 249-285. |