 2016, Vol. 34
Institute of Oceanology, Chinese Academy of Sciences
Article Information
- XU Qiang(徐强), GUO Dong(郭栋), ZHANG Peidong(张沛东), ZHANG Xiumei(张秀梅), LI Wentao(李文涛), WU Zhongxin(吴忠鑫)
- Seasonal variation in species composition and abundance of demersal fish and invertebrates in a Seagrass Natural Reserve on the eastern coast of the Shandong Peninsula, China
- Chinese Journal of Oceanology and Limnology, 34(2): 330-341
- http://dx.doi.org/10.1007/s00343-015-4323-3
Article History
- Received Nov. 18, 2014
- accepted in principle Jun. 24, 2016


2 Liaoning Ocean and Fisheries Science Research Institute, Dalian 116000, China
Seagrasses add structural complexity to shallow soft bottom systems worldwide, and provide food, refuge, and living space for a variety of organisms, thereby enhancing estuarine and coastal productivity and biodiversity. Seagrass beds also provide important ecosystem functions such as producing and exporting organic carbon, cycling nutrients, stabilizing sediments and improving water clarity, and may strongly influence the structure and functioning of associated fish and invertebrate communities (Bowden et al., 2001; Healey and Hovel, 2004; Van Houte-Howes et al., 2004; Polte and Asmus, 2006; Deudero et al., 2008; Pogoreutz et al., 2012; Whitlow and Grabowski, 2012). In many studies, seagrass habitat has been reported to support increased fish and invertebrate species diversity, abundance, biomass and productivity, compared with adjacent unvegetated soft sediment habitat (Edgar et al., 1994; Heck et al., 1989, 1995; Jenkins et al., 1997; Guidetti, 2000; Travers and Potter, 2002; Nuraini et al., 2007).
Seagrass habitats are, however, under threat worldwide from a range of anthropogenic and natural causes including climate change, which may threaten the survival of many fish and invertebrate species (Edgar and Shaw, 1995; Orth et al., 2006; Pihl et al., 2006; Horinouchi et al., 2009; Nakamura, 2010; Whitlow and Grabowski, 2012). One effective method to restore and protect the damaged seagrass beds is to establish Marine Protected Areas (MPA) or Natural Reserves (NR). However, information on fish and invertebrate assemblages in MPAs or NRs associated with seagrass beds is scarce (Rueda et al., 2008).
Swan Lake (Yuehu) is a small inlet system located on the coast of the Shandong Peninsula, China (Fig. 1). The tidal basin (i.e. the lagoon) is separated from the open sea (i.e. Rongcheng Bay and the Yellow Sea) by a 2.5-km long sand-spit, which lies to the east of the lagoon (Wei and Zhuang, 1997). The environment of Swan Lake was largely natural before the 1970s. Although there are no precise data for the abundance of Zostera marina, anecdotal reports, fishery practices and local historical knowledge indicate that Z . marina was very abundant in Swan Lake in the early 1970s. In 1979, the entrance to the lagoon was artificially closed for aquaculture purposes, but the closure caused rapid sediment accumulation within the entrance channel, which reduced water exchange (Gao et al., 1998). The seagrass beds were almost completely eliminated by the end of 1982 due to the poor water exchange. An immediate effect of the loss of Z . marina was the elimination of commercial finfish, shellfish, sea cucumber (Apostichopus japonicus) and octopus (Octopus variabilis) fisheries, and the disappearance of Whooper Swan (Cygnus cygnus) that fed exclusively on Z . marina . To restore the seagrass beds and the ecological environment in the Swan Lake area, the upper part of the artificial dam was removed in 1986 and this area was established as a National Seagrass Natural Reserve in 1988. As a result, the ecosystem of the lagoon gradually recovered and the seagrass beds reestablished.

|
| Figure 1 Map of Shandong Peninsula and Swan Lake showing the arrangement of nine permanent sampling sites within a subtidal Zostera marina bed at 0.5 km intervals in three rows over an area of 1.0 km 2 |
We investigated demersal fish and invertebrate assemblages in Swan Lake monthly, from February 2009 to January 2010, to study seasonal variation in species composition and abundance. In addition, the study aimed to examine if variability in demersal fish and invertebrate abundance was related to water temperature and/or variation in Z . marina shoot dimensions, density or biomass. In temperate areas, Z . marina displays seasonal variation in shoot length and density, leading to a change in the canopy (Marbà et al., 1996; Rueda et al., 2008). Therefore, a corresponding variation in the abundance of associated demersal fish and invertebrates is expected. Our objective was to gain a better understanding of the number of resident species and individuals and to highlight the possible role of seagrass as a nursery area. This has not been previously studied in China.
2 MATERIAL AND METHOD 2.1 Study areaThe lake is a 4.8 km 2 tidal basin or lagoon. The water depth is mostly less than 1.5 m measured at mean sea level with a maximum depth of around 3.5 m at high water on spring tides. The tidal range, measured at the entrance to the lagoon, is 1.15 m on springs and 0.64 m on neaps. The floor of the lagoon is generally dominated by fine-grained material. Mud and sandy mud with variable mud content, cover around 40% of the lagoon area. The remainder of the lagoon area is covered by muddy sand, with a mud content of 20%-50% (Jia et al., 2003). Zostera marina is the dominant seagrass species and is estimated to occupy about 2.0 km 2, mostly distributed in the middle of the lake.
2.2 Sampling design and proceduresNine permanent sampling sites in three rows were set-up in the subtidal Z . marina bed covering an area of 1.0 km 2 (Fig. 1). The three rows were evenly distributed (about 0.5 km apart) and the three sites in each row were established at about 0.5 km intervals. A permanent buoy was fixed to the seabed using steel stakes to mark each site.
Demersal nekton and Z . marina shoot samples were collected from each site monthly, from February 2009 to January 2010. Demersal nekton were caught using traps that measured 35 cm in width, 25 cm in height and 9 m in length, with a mesh size of 2.0 cm. The trap mesh was stretched across 25 steel frames (35 cm×25 cm, width×height) evenly placed at 35 cm intervals, to form a series of box sections. Funnel shaped trap mouths were set in each section on alternate sides of the trap. Each trap mouth was 20 cm high at the entrance tapering to an internal diameter of 8 cm (Fig. 2). The traps used in this study were chosen for ease of handling and because similar work in northern China was done using the same gear, making it easier to make direct comparisons. The trap is also commonly used by traditional fishermen in the area and is effective for catching fish and invertebrates in shallow water habitats.

|
| Figure 2 >Image of a sampling trap |
A total of 60 traps were used in the study. At each site 6-8 conjoint traps were fixed to the bottom for 2 consecutive days (48±1 h), using steel anchors at each end. The catches were sorted into seawater in separate labeled plastic boxes, counted and identified to species. Total fresh weight for each species was measured to the nearest 1 g. The catches were then released alive about 50 m from the site.
To estimate the shoot density of Z . marina, two 0.25 m×0.25 m quadrats were haphazardly placed within 20 m of each sampling station. The number of shoots in each quadrat were counted, and the values were converted to shoots per unit area (shoots/m2). A sample of 3-5 intact shoots was collected from each sampling station to calculate shoot length and weight. Shoots were collected carefully by hand to avoid damage to belowground structures, and samples were rinsed thoroughly in seawater to remove sediment, shells and other debris. Samples were placed in sealed polythene bags, stored on ice, transported to the laboratory and kept at 4℃ prior to analysis. Each sample was cleaned with gauze to remove epiphytes and leaf length was measured. A section of leaf material was cut from each sample using a razor blade and rinsed in deionized water. Subsamples were dried at 60℃ for 48 h to obtain leaf tissue weight. Biomass was calculated by multiplying the shoot density by the average leaf weight (g dry wt./m2).
Water temperature (℃) was recorded every 30 min throughout the study period using a HOBO pendant temperature data logger (Onset Computer Corp., Bourne, MA, USA). Daily and monthly water temperature averages were calculated.
2.3 Data analysisDemersal nekton was divided into two categories, fish and invertebrates, for analysis. Abundance and biomass (fresh wet weight) were adjusted to catchper-unit-effort data by dividing the catch by the number of traps. All abundance estimates were reported as number of demersal nekton per trap, and biomass estimates as wet weight (g) per trap. Because environmental conditions and Z . marina distribution was similar among the sampling sites, variation in species number, abundance and biomass of demersal nekton, and Z . marina density, size and biomass among sampling sites were not analyzed. The monthly data were reported as means±standard deviation (SD) and leaf length data were reported as means of all leaves±SD.
To examine differences in fish and invertebrate community assemblages among months, monthly data describing the number of individuals per trap were pooled across all sites. A multi-dimensional scaling (MDS) ordination was carried out using the PRIMER statistical package version 6.0 (Clarke and Gorley, 2006; Hajisamae et al., 2006), with Bray- Curtis similarity. Analysis of similarity (ANOSIM) was used to determine whether the fish and invertebrate assemblages separated by the MDS ordination differed significantly. Where significant differences were found, a similarity of percentage procedure (SIMPER) was used to examine which species contributed most to the differences. To examine how fish and invertebrate communities were distributed among sampling months, a cluster analysis was carried out using Bray-Curtis similarity and a complete linkage cluster mode on all fish or invertebrate species, and this was used to construct cluster dendrograms. Where significant differences were detected, a similarity of percentage procedure (SIMPER) was used to examine which species or group of species was likely to occur during particular months.
The relationship between environmental variables (water temperature, Z . marina shoot density, leaf length and biomass) and abundance of fishes and invertebrates in each month was examined using the Canoco 4.5 ordination program. Catch data (number of individuals per trap) at all sites in each month were pooled and log-transformed. The gradient length of the data, as calculated with a Detrended Correspondence Analysis (DCA), revealed a maximum gradient length <4 standard deviations, thus confirming that the data show a strong linear response around some environmental optima. Principal Component Analysis (PCA) was therefore used for data analysis (Wu et al., 2012).
3 RESULT 3.1 Seasonal variation in water temperatureWater temperature showed a typical seasonal pattern (Fig. 3), with the highest value of 26.8℃ recorded in August 2009, and the lowest value of -1.0℃ in February 2009.

|
| Figure 3 Seasonal change in water temperature during the experimental period from February 2009 to January 2010 |
The density of Z . marina shoots showed significant seasonal variation with the maximum average value of 437 shoots/m2 in June and the minimum average value of 190 shoots/m2 in January (Fig. 4a). Leaf length also exhibited a clear seasonal pattern with the greatest value in July (summer) and the lowest values in December-March (from winter to early spring), ranging from 6.1 to 39.8 cm (Fig. 4b). Biomass showed a similar trend with a significant peak in July (Fig. 4c). Biomass values from November to March were less than 50 g dry wt./m2 and were significantly lower (P<0.05) than the values recorded in April to October.

|
| Figure 4 Seasonal changes in Zostera marina shoot density (a), leaf length (b), and biomass (c) at Swan Lake from February 2009 to January 2010 |
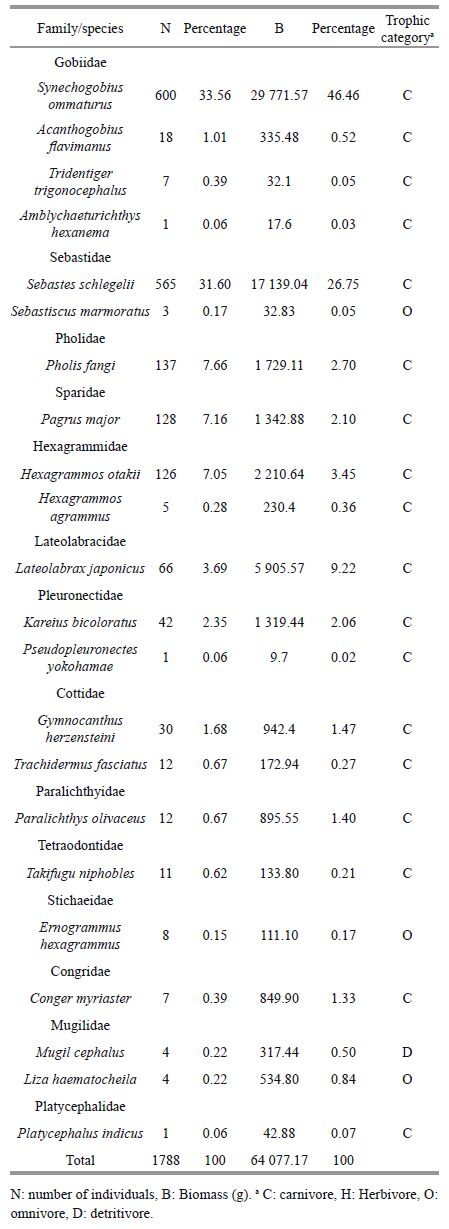
A total of 1788 fish belonging to 22 species and representing 14 families were collected from the Swan Lake seagrass bed (Table 1). The major families ranked by number and biomass were Gobiidae, Sebastidae and Lateolabracidae. Numerically dominant fish were Synechogobius ommaturus (34%), Sebastes schlegelii (32%), Pholis fangi (8%), Pagrus major (7%) and Hexagrammos otakii (7%), together accounting for 87% of the catch and 82% of fish biomass. The biomass of Lateolabrax japonicus (9% of biomass) was higher than that of P . fangi (3% of biomass), P . major (2% of biomass) and H . otakii (4% of biomass), which were small fish species or juveniles of large fish species. Carnivores dominated the trophic composition of the seagrass fish community.
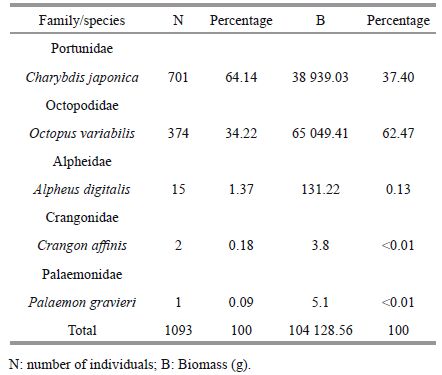
The number of invertebrate species and individuals caught in traps were far less compared with fish, but their collective biomass was much higher. A total of 1 093 invertebrates, belonging to five species and representing five families, were collected (Table 2). The major families in terms of both numbers and biomass were Portunidae and Octopodidae. Numerically dominant species were Charybdis japonica (64%) and O ctopus variabilis (34%). They made up 98% of individuals and 99.87% of the total invertebrate biomass.
|
The number of fish species varied seasonally with a significant peak in August-October (mid-summer to early autumn) and the lowest value in January 2010 (Fig. 5a). The number of individual fish differed among months (Fig. 5b) with a maximum value of seven individuals per trap in November. High numbers of individual fish also occurred in July and August. The number of individual fish from December to June was less than two individuals per trap. Fish biomass exhibited a similar trend (Fig. 5c) with the highest values occurring in July and November when large numbers of S . schlegelii and S . ommaturus were present.

|
| Figure 5 Seasonal changes in number of species (a), number (per trap) of individuals (b), and biomass (per trap) (c) of fishes in seagrass bed in Swan Lake from February 2009 to January 2010 |
The number of invertebrate species differed significantly among months (Fig. 6a), but no single clear peak was found. Higher values occurred in March, May, July and November. No invertebrate species were caught in December 2009 and January 2010. The number of invertebrate species was lower than the number of fish species in each month. The number of individual invertebrates varied significantly among seasons, with the highest numbers occurring in July and September (Fig. 6b). There was a significant difference in invertebrate biomass among months, with the highest values observed in March, April, July and September, when the abundance of C . japonica and O . variabilis was high (Fig. 6c). The average number and biomass of invertebrates decreased in August, compared with July and September. Although the number of invertebrate species and individuals was low compared with the number of fish, invertebrate biomass was significantly higher than fish biomass in most months from March to September.

|
| Figure 6 Seasonal changes in number of species (a), number (per trap) of individuals (b), and biomass (per trap) (c) of invertebrates in a seagrass bed in Swan Lake from February 2009 to January 2010 |
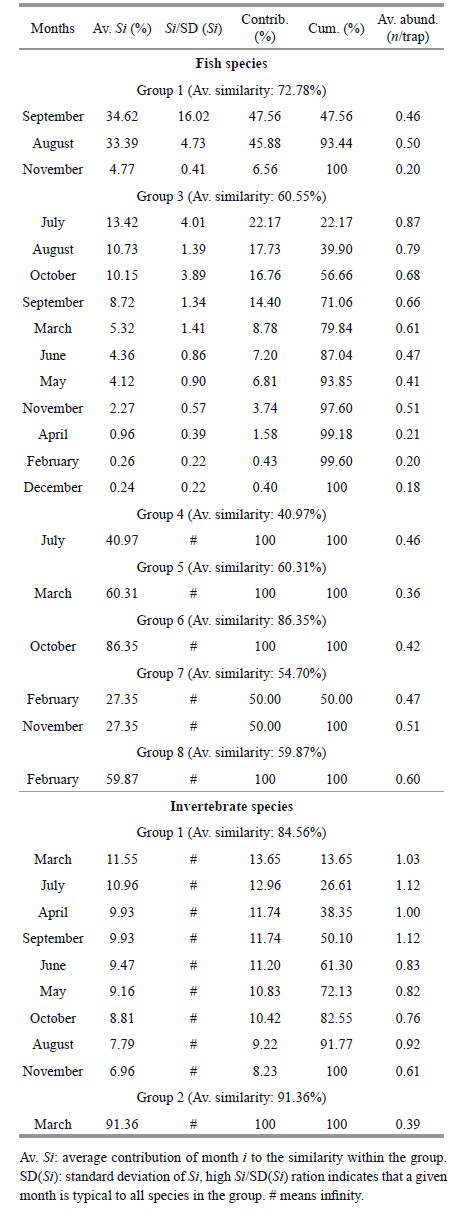
A non-metric multi-dimensional scaling (MDS) ordination separated the fish and invertebrate assemblages into two temporal groups at 35% similarity, with the winter months of January, February and December separated into one group and the remaining months forming a second group (Fig. 7). The analysis of similarity (ANOSIM) demonstrated that there was a significant difference in the composition of fish and invertebrate samples between the two groups (Global R-statistic value=0.973, P =0.005). Similarity Percentage Analysis (SIMPER) showed that S . ommaturus contributed 76.8% to separating the group consisting of January, February and December. A combination of C . japonica, O . variabilis, S . schlegelii, H . otaki i, and S . ommaturus contributed more than 70% to the grouping of the months March to November (Table 3).

|
| Figure 7 Non-metric multidimensional scaling (MDS) ordination representing months |
|
Fish species were divided into seven groups and one individual on the cluster dendrogram at the cutoff of 50% similarity (Fig. 8a). Analysis of similarity (ANOSIM) showed that there was a significant difference among sampling months for each group of fish species (Global R=0.981, P =0.001). The first group consisted of Paralichthys olivaceus, Tridentiger trigonocephalus, Hexagrammos agrammus and Takifugu niphobles . This group was mainly found during August and September (Table 4). The largest group consisted of six species including, S . ommaturus, S . schlegelii, L . japonicus and H . otakii . This group of species was mainly found from June to October. Other species such as Gymnocanthus herzensteini, Sebastiscus marmoratus, Pseudopleuronectes yokohamae and Liza haematocheila occurred only occasionally, mainly during February and March.

|
| Figure 8 Cluster dendrograms demonstrating the groupings of all fish (a) and invertebrate (b) species based on their distribution during sampling months in a subtidal Z . marina bed at Swan Lake |
|
Invertebrate species were divided into two groups and one individual on the dendrogram at the cut-off of 50% similarity (Fig. 8b). ANOSIM demonstrated that there was a significant difference among sampling months for each group of invertebrate species (Global R =1, P<0.05). Two species, C . japonica and O . variabilis, formed the first cluster. The similarity percentage procedure (SIMPER) indicated that these species were found throughout most of the year, but greater numbers were present from March to September (Table 4).
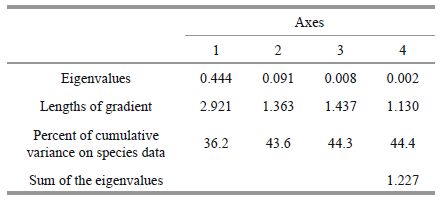
3.6 Correlation between environmental variables and abundanceThe Detrended Correspondence Analysis (DCA), also suggested temporal segregation in the abundance of fishes and invertebrates. The first two axes explained 43.6% of the total variance (Table 5). Principal Component Analysis (PCA) revealed that the four environmental variables (temperature, shoot density, leaf length and biomass) had eigenvalues higher than 0.7 and explained 71.9% of the total variance. Axis I of the PCA represented the highest contribution to variation from shoot density and leaf length (Fig. 9) with positive correlation coefficients of 0.521 and 0.469, respectively. Axis II maximized variation in shoot density resulting in a negative correlation coefficient of -0.676.
|
A total of 22 fish species were recorded from the seagrass bed of Swan Lake and of these S . ommaturus, S . schlegelii, P . fangi, P . major and H . otakii were numerically dominant. Fish from the families Sebastidae, Sparidae and Hexagrammidae were dominant (46% of total number) in the seagrass bed of Swan Lake. These fish groups are of commercial and recreational importance and are harvested for food. Small, non-commercially important Gobiidae were also abundant (35% of total number). Several studies show that Gobiidae are distributed widely in coastal areas, regardless of climate and factors such as seagrass composition, temperature and biological variables (Blaber et al., 1992; Coles et al., 1993; Kwak and Klumpp, 2004). Because there are no data on fish and invertebrate communities in seagrass beds from other regions of Shandong Peninsula, comparisons with other seagrass beds in China could not be made. However the seagrass habitat at Swan Lake supported a large number of fish species compared with an artificial reef at Rongcheng in the vicinity of Swan Lake, where a total of 14 species were collected using the same trap over a 12 month period (Wu et al., 2012). The high number of fish species in the eelgrass bed indicated that seagrass provides a nursery habitat for juveniles of many species.

|
| Figure 9 Ordination diagram from Principal Component Analysis on fish and invertebrate abundance and environmental variables |
Although only five invertebrate species were found in the seagrass bed at Swan Lake, the biomass of invertebrates was high compared with fish. Charybdis japonica and O . variabilis were the dominant species, making up 98% of individuals and 99.87% of the total biomass for invertebrates. These species are caught in very low numbers in the vicinity of Swan Lake according to local fishers and historical knowledge, indicating that they are mainly restricted to the seagrass meadow. The presence of Z . marina may enhance the abundance of C . japonica and O . variabilis by increasing the amount of physical structure usable as living space, offering greater protection from predators and a high availability of food (Lee et al., 2001; MacArthur and Hyndes, 2001; Mills and Berkenbusch, 2009). There is intensive aquaculture of a clam (Ruditapes philippinarum) at Swan Lake, providing an abundant food resource for C . japonica and O . variabilis . Kopp et al. (2007) suggest that the high abundance of food in seagrass beds may be more important in promoting a diversity of animal species and high abundances of individuals compared with the architectural complexity of seagrass meadows.
Seasonal variation in species composition and abundance appear to be considerable for both fish and invertebrate communities utilizing seagrass beds, with each species displaying a unique seasonal distribution pattern (Hajisamae et al., 2006). There were significant differences in fish and invertebrate assemblages in Swan Lake among months, reflecting seasonal differences in recruitment and settlement patterns. Several species, including S . schlegelii, S . ommaturus, H . otakii, C . japonica and O . variabilis, occurred throughout most of the year, but many species only occurred in specific months. The distribution pattern of fish and invertebrate communities through time indicated that there were two different recruitment and settlement periods, (1) December to February and (2) March to November. Lower species richness and abundance during winter, December to February, is probably related to the degradation of the seagrass bed during this period, resulting in a decrease in food availability and habitable space. The two dominant invertebrate species in Swan Lake, C . japonica and O . variabilis, overwinter during these months, which may also affect the overall seasonal differences seen in the analyses. Cluster analysis and analysis of similarity (ANOSIM) indicated that six fish species were mainly found during June to October, and four species were found mainly during August and September. Most species, however, occurred only occasionally, showing different seasonal recruitment and settlement patterns. Our results indicated that species richness was high in March and from July to November. These peaks corresponded with the spawning periods of dominant species. Similar temporal patterns were also identified in studies at Iriomote Island and Ryukyu Island, Japan (Nakamura and Sano, 2004; Nakamura and Tsuchiya, 2008).
In general, there is a positive correlation between faunal abundance, biomass and diversity, and structural complexity of seagrass beds (measured as leaf biomass, canopy height or shoot density). This may be due to an increase in food availability, an increase in habitable space and enhanced refuge from predators (Webster et al., 1998; Mattila et al., 1999; Raposa and Oviatt, 2000; Lee et al., 2001; Kwak and Klumpp, 2004; Gillanders, 2006; Joseph et al., 2006; Horinouchi, 2007; Moore and Hovel, 2010; Pogoreutz et al., 2012). In our study, principal component analysis (PCA) revealed that the abundance of fish and invertebrates was closely related to the shoot density and leaf length of seagrass. These results are consistent with the findings of previous studies. Plant density and size increased in the spring and summer, but decreased with the sloughing off of many leaves in winter. There was a corresponding increase in fish and invertebrate abundance during spring and summer, followed by a decline in the winter months.
5 CONCLUSIONA total of 22 fish species and five invertebrate species were recorded over a year from Swan Lake, a Seagrass Natural Reserve (SNR) on the eastern coast of the Shandong Peninsula, China. The biomass of invertebrates was far higher than that of fish, as abundant shellfish resources at Swan Lake supported the crab, C . japonica and the octopus, O . variabilis . Temporal variation in species composition and abundance appears to be considerable for both fish and invertebrate communities utilizing seagrass beds. Species richness and abundance was relatively low during the winter months, December to February, but high during summer. A positive correlation between fish and invertebrate abundance and the structural complexity of Z . marina beds (shoot density and leaf length) was detected, consistent with the findings of previous studies. This study helps to identify seasonal patterns in the distribution of a number of fish and invertebrate species found in a semi-enclosed temperate estuarine lagoon.
| Blaber S J M, Brewer D T, Salini J P, Kerr J D, Conacher C, 1992. Species composition and biomasses of fishes in tropical seagrasses at Groote Eylandt, Northern Australia. Est. Coast. Shelf S c i., 35 (6) : 605 –620. Doi: 10.1016/S0272-7714(05)80042-3 |
| Bowden D A, Rowden A A, Attrill M J, 2001. Effect of patch size and in-patch location on the infaunal macroinvertebrate assemblages of Zostera marina seagrass beds. J. Exp.Mar. Biol. Ecol., 259 (2) : 133 –154. Doi: 10.1016/S0022-0981(01)00236-2 |
| Clarke K R, Gorley R N, 2006. Change in marine communities:An approach to statistical analysis and interpretation. Plymouth:PRIMER-E Ltd . |
| Coles R G, Lee-Long W J, Watson R A, Derbyshire K J, 1993. Distribution of seagrass, and their fish and penaeid prawn communities, in Cairns Harbour, a tropical estuary, Northern Queensland, Australia. Aust. J. Mar. Freshwater Res., 44 : 193 –210. |
| Deudero S, Morey G, Frau A, Moranta J, Moreno I, 2008. Temporal trends of littoral fishes at deep Posidonia oceanic a seagrass meadows in a temperate coastal zone. J. Marine Syst., 70 (1-2) : 182 –195. Doi: 10.1016/j.jmarsys.2007.05.001 |
| Edgar G J, Shaw C, Watson G F, Hammond L S, 1994. Comparisons of species richness, size structure and production of benthos in vegetated and unvegetated habitats in Western Port, Victoria. J. Exp. Mar. Biol. Ecol., 176 (2) : 201 –226. Doi: 10.1016/0022-0981(94)90185-6 |
| Edgar G J, Shaw C, 1995. The production and trophic ecology of shallow-water fish assemblages in southern Australia Ⅲ. General relationships between sediments, seagrasses, invertebrates and fishes. J. Exp. Mar. Biol. Ecol, 194 (1) : 107 –131. Doi: 10.1016/0022-0981(95)00085-2 |
| Gao S, Zhuang Z Y, Wei H L, Sun Y L, Chen S J, 1998. Physical processes affecting the health of coastal embayments:an example from the Yuehu inlet, Shandong Peninsula, China. In:Hong G H, Zhang J, Park B K.(Eds.), Health of the Yellow Sea. The Earth Love Publication Association, Seoul. p : 314 –329. |
| Gillanders B M, 2006. Seagrasses, fish, and fisheries. In:Larkum A W D, Orth R J, Duarte C M eds. Seagrasses:Biology, Ecology, and Conservation. The Netherlands:Springer. p : 503 –536. |
| Guidetti P, 2000. Differences among fish assemblages associated with nearshore Posidonia oceanica seagrass beds, rocky-algal reefs and unvegetated sand habitats in the Adriatic Sea. Est. Coast. Shelf Sci., 50 (4) : 515 –529. Doi: 10.1006/ecss.1999.0584 |
| Hajisamae S, Yeesin P, Chaimongkol S, 2006. Habitat utilization by fishes in a shallow, semi-enclosed estuarine bay in southern Gulf of Thailand. Est. Coast. Shelf Sci., 68 : 647 –655. Doi: 10.1016/j.ecss.2006.03.020 |
| Healey D, Hovel K A, 2004. Seagrass bed patchiness:effects on epifaunal communities in San Diego Bay, USA. J. Exp.Mar. Biol. Ecol., 313 (1) : 155 –174. Doi: 10.1016/j.jembe.2004.08.002 |
| Heck Jr K L, Able K W, Fahay M P, Roman C T, 1989. Fishes and decapod crustaceans of cape cod eelgrass meadows:Species composition, seasonal abundance patterns and comparison with unvegetated substrates. Estuaries, 12 (2) : 59 –65. Doi: 10.2307/1351497 |
| Heck Jr K L, Able K W, Roman C T, Fahay M P, 1995. Composition, abundance, biomass, and production of macrofauna in a New England estuary:Comparisons among eelgrass meadows and other nursery habitats. Estuaries, 18 (2) : 379 –389. Doi: 10.2307/1352320 |
| Horinouchi M, Tongnunui P, Nanjyo K, Nakamura Y, Sano M, Ogawa H, 2009. Differences in fish assemblage structures between fragmented and continuous seagrass beds in Trang, southern Thailand. Fish. Sci., 75 (6) : 1409 –1416. Doi: 10.1007/s12562-009-0166-1 |
| Horinouchi M, 2007. Review of the effects of within-patch scale structural complexity on seagrass fishes. J. Exp.Mar. Biol. Ecol., 350 (1-2) : 111 –129. Doi: 10.1016/j.jembe.2007.06.015 |
| Jenkins G P, May H M A, Wheatley M J, Holloway M G, 1997. Comparison of fish assemblages associated with seagrass and adjacent unvegetated habitats of Port Phillip Bay and Corner Inlet, Victoria, Australia, with emphasis on commercial species. Est. Coast. Shelf Sci., 44 (5) : 569 –588. Doi: 10.1006/ecss.1996.0131 |
| Jia J J, Gao S, Xue Y C, 2003. Sediment dynamic processes of the Yuehu inlet system, Shandong Peninsula, China. Est.Coast. Shelf Sci., 57 (5-6) : 783 –801. Doi: 10.1016/S0272-7714(02)00406-7 |
| Joseph V, Locke A, Godin J G, 2006. Spatial distribution of fishes and decapods in eelgrass(Zostera marina L.) and sandy habitats of a New Brunswick estuary, eastern Canada. Aquat. Ecol, 40 : 111 –123. Doi: 10.1007/s10452-005-9027-x |
| Kopp D, Bouchon-Navaro Y, Louis M, Bouchon C, 2007. Diel differences in the seagrass fish assemblages of a Caribbean island in relation to adjacent habitat types. Aquat. Bot., 87 (1) : 31 –37. Doi: 10.1016/j.aquabot.2007.01.008 |
| Kwak S N, Klumpp D W, 2004. Temporal variation in species composition and abundance of fish and decapods of a tropical seagrass bed in Cockle Bay, North Queensland, Australia. Aquat. Bot., 78 (2) : 119 –134. Doi: 10.1016/j.aquabot.2003.09.009 |
| Lee S Y, Fong C W, Wu R S S, 2001. The effects of seagrass(Zostera japonica) canopy structure on associated fauna:a study using artificial seagrass units and sampling of natural beds. J. Exp. Mar. Biol. Ecol., 259 (1) : 23 –50. Doi: 10.1016/S0022-0981(01)00221-0 |
| MacArthur L D, Hyndes G A, 2001. Differential use of seagrass assemblages by a suite of Odacid species. Est. Coast.Shelf Sci., 52 (1) : 79 –90. Doi: 10.1006/ecss.2000.0728 |
| Marbà N, Cebrián J, Enríquez S, Duarte C M, 1996. Growth patterns of Western Mediterranean seagrasses:speciesspecific responses to seasonal forcing. Mar. Ecol. Progr.Ser., 133 : 203 –215. Doi: 10.3354/meps133203 |
| Mattila J, Chaplin G, Eilers M R, Heck Jr K L, O'Neal J P, Valentine J F, 1999. Spatial and diurnal distribution of invertebrate and fish fauna of a Zostera marina bed and nearby unvegetated sediments in Damariscotta River, Maine(USA). J. Sea Res., 41 (4) : 321 –332. Doi: 10.1016/S1385-1101(99)00006-4 |
| Mills V S, Berkenbusch K, 2009. Seagrass(Zostera muelleri) patch size and spatial location influence infaunal macroinvertebrate assemblages. Est. Coast. Shelf Sci., 81 (1) : 123 –129. Doi: 10.1016/j.ecss.2008.10.005 |
| Moore E C, Hovel K A, 2010. Relative influence of habitat complexity and proximity to patch edges on seagrass epifaunal communities. Oikos, 119 : 1299 –1311. Doi: 10.1111/j.1600-0706.2009.17909.x |
| Nakamura Y, Sano M, 2004. Overlaps in habitat use of fishes between a seagrass bed and adjacent coral and sand areas at Amitori Bay, Iriomote Island, Japan:Importance of the seagrass bed as juvenile habitat. Fish. Sci., 70 (5) : 788 –803. Doi: 10.1111/fis.2004.70.issue-5 |
| Nakamura Y, Tsuchiya M, 2008. Spatial and temporal patterns of seagrass habitat use by fishes at the Ryukyu Islands, Japan. Est. Coast. Shelf Sci., 76 (2) : 345 –356. Doi: 10.1016/j.ecss.2007.07.014 |
| Nakamura Y, 2010. Patterns in fish response to seagrass bed loss at the southern Ryukyu Islands, Japan. Mar. Biol., 157 (11) : 2397 –2406. Doi: 10.1007/s00227-010-1504-7 |
| Nuraini S, Carballo E C, Van Densen W L T, Machiels M A M, Lindeboom H J, Nagelkerke L A J, 2007. Utilization of seagrass habitats by juvenile groupers and snappers in Banten Bay, Banten Province, Indonesia. Hydrobiologia, 591 (1) : 85 –98. Doi: 10.1007/s10750-007-0786-3 |
| Orth R J, Carruthers T J B, Dennison W C, Duarte C M, Fourqurean J W, Heck K L, Hughes A R, Kendrick G A, Kenworthy W J, Olyarnik S, Short F T, Waycott M, Williams S L, 2006. A global crisis for seagrass ecosystems. BioScience, 56 (12) : 987 –996. Doi: 10.1641/0006-3568(2006)56[987:AGCFSE]2.0.CO;2 |
| Pihl L, Baden S, Kautsky N, Rönnbäck P, Söderqvist T, Troell M, Wennhage H, 2006. Shift in fish assemblage structure due to loss of seagrass Zostera marina habitats in Sweden. Est. Coast. Shelf Sci., 67 (1-2) : 123 –132. Doi: 10.1016/j.ecss.2005.10.016 |
| Pogoreutz C, Kneer D, Litaay M, Asmus H, Ahnelt H, 2012. The influence of canopy structure and tidal level on fish assemblages in tropical Southeast Asian seagrass meadows. Est. Coast. Shelf Sci., 107 : 58 –68. Doi: 10.1016/j.ecss.2012.04.022 |
| Polte P, Asmus H, 2006. Influence of seagrass beds(Zostera noltii) on the species composition of juvenile fishes temporarily visiting the intertidal zone of the Wadden Sea. J. Sea Res., 55 (3) : 244 –252. Doi: 10.1016/j.seares.2005.11.004 |
| Raposa K B, Oviatt C A, 2000. The influence of contiguous shoreline type, distance from shore, and vegetation biomass on nekton community structure in eelgrass beds. Estuaries, 23 (1) : 46 –55. Doi: 10.2307/1353224 |
| Rueda J L, Urra J, Salas C, 2008. Diel and seasonal variation of a molluscan taxocoenosis associated with a Zostera marina bed in southern Spain(Alboran Sea). Helgol.Mar. Res., 62 (3) : 227 –240. Doi: 10.1007/s10152-008-0111-1 |
| Travers M J, Potter I C, 2002. Factors influencing the characteristics of fish assemblages in a large subtropical marine embayment. J. Fish Biol., 61 (3) : 764 –784. Doi: 10.1111/jfb.2002.61.issue-3 |
| Van Houte-Howes K S S, Turner S J, Pilditch C A, 2004. Spatial differences in macroinvertebrate communities in intertidal seagrass habitats and unvegetated sediment in three New Zealand estuaries. Estuaries, 27 (6) : 945 –957. Doi: 10.1007/BF02803421 |
| Webster P J, Rowden A A, Attrill M J, 1998. Effect of shoot density on the infaunal macro-invertebrate community within a Zostera marina seagrass bed. Est. Coast. Shelf Sci., 47 (3) : 351 –357. Doi: 10.1006/ecss.1998.0358 |
| Wei H L, Zhuang Z Y, 1997. Study on the evolution of Yuehu lake-tidal inlet system, Rongcheng, Shandong Province. J. Lake Sci., 9 (2) : 135 –140. Doi: 10.18307/1997.0207 |
| Whitlow W L, Grabowski J H, 2012. Examining how landscapes influence benthic community assemblages in seagrass and mudflat habitats in southern Maine. J. Exp.Mar. Biol. Ecol., 411 : 1 –6. Doi: 10.1016/j.jembe.2011.10.024 |
| Wu Z X, Zhang L, Zhang X M, Zhang P D, Li W T, 2012. Nekton community structure and its relationship with main environmental variables in Lidao artificial reef zones of Rongcheng. Acta Ecol. Sin., 32 (21) : 6737 –6746. Doi: 10.5846/stxb |