 2016, 34
Institute of Oceanology, Chinese Academy of Sciences
Article Information
- Liqin JI(纪利芹), Keyong JIANG(蒋克勇), Mei LIU(刘梅), Baojie WANG(王宝杰), Longjiang HAN(韩龙江), Mingming ZHANG(张明明), Lei WANG(王雷)
- Low temperature stress on the hematological parameters and HSP gene expression in the turbot Scophthalmus maximus
- Journal of Oceanology and Limnology, 34(3): 430-440
- http://dx.doi.org/10.1007/s00343-016-4367-z
Article History
- Received: Jan. 5, 2015
- Accepted: Feb. 13, 2015


2. University of Chinese Academy of Sciences, Beijing 100049, China;
3. Fisheries College, Ocean University of China, Qingdao 266003, China
Water temperature is a fundamental extrinsic factor that affects biological and metabolic processes such as survival (Brett and Groves,1979) ,growth (Corey et al.,1983) ,energy budget (Person-Le Ruyet et al.,2004) ,and fish vaccination (Martins et al.,2011) in aquatic organisms. Elevated temperature correlates with an increase in growth up to an optimum point,above which thermal stress occurs,whereas decreased temperature suppresses growth rates and metabolism (Baum et al.,2005) .
In animals,blood transports nutrients and metabolic waste and carries out the body's immune functions. In fish,the blood is sensitive to endogenous and exogenous changes,such as those caused by virus infection,thermal stress,and altered nutritional status (Kenari et al.,2011) . Thus,a hematological examination is an essential part of evaluating the health status of fish (Řehulka et al.,2004) . Evaluation of blood cells,blood biochemistry,and hormone levels can be useful for the diagnosis of diseases and to monitor the physiological status of fish,and these parameters are commonly used as indicators of the physiological stress response in fish (Lermen et al.,2004) . In all vertebrates,including fish,plasma cortisol (COR) plays a key role in restoring homeostasis during or after stress and in mediating the suppressive effect of stress (Goos and Consten,2002) . Therefore,elevation of the serum COR concentration is regarded as the main hormonal response to stressors and is widely used as a stress response indicator (Barton and Iwama,1991) .
Heat shock proteins (HSPs) constitute a large family of proteins devoted to protecting newly synthesized proteins and ensuring proper folding of proteins (Lanneau et al.,2008) . The HSP70 and HSP90 families are the most highly conserved of all HSP families (Lund et al.,2003) . As molecular chaperones,HSP70 and HSP90 assist cells in their recovery from stress and promote cytoprotection (Wang et al.,2013) . Many types of stress,including temperature changes,can induce expression of the HSP70 and HSP90 genes in teleost fish (Basu et al.,2002) . For example,in crucian carp (Carassius carassius) ,the expressions of HSP70 and HSP90 increase distinctly in some tissues in response to decreases of the acclimation temperature (Rissanen et al.,2006) . Because they are highly conserved and their expression increases rapidly in response to adverse environmental changes (Guo et al.,2010) ,HSP70 and HSP90 are suitable molecular biomarkers of temperature stress (Luft et al.,1996) .
The turbot (β-actin) ,originated from the east Atlantic coast,is a highly valued cold water species. Since its introduction into China in 1992,it has become one of the most important economically fish and widely farmed in north China,where it is extremely cold in winter. Turbot exhibits high growth rates at optimum temperature range 13– 22°C,the maximum lethal temperature is 28–30°C,and the minimum lethal temperature is 1–2°C. Many studies have focused on the effects of heat stress on turbot,whereas very little is known about how these fish respond to cold stress (Piferrer et al.,2000) . Typically,low temperature stress includes two aspects: cold acclimation and acute temperature. Cold acclimation refers to lowering the water temperature slowly,in the process,compensation mechanism is aroused in fish body to maintain the stability of internal environment,while the temperature decreases dramatically,this stable environment is broken down,and then stress response occurs (Goos and Consten,2002; Engelsma et al.,2003) . The temperature range (18–1°C) chosen in the present study was within the optimal rearing temperature (18–13°C) ,and lower temperature (8–1°C) for turbot rearing. Therefore,the goal of this study was to assess the metabolic responses (i.e.,serum indices) and molecular responses (i.e.,gene expressions of HSP70 and HSP90) of S. maximus during exposure to acute low temperature.
2 MATERIAL AND METHOD 2.1 Collection and acclimation of turbotHealthy turbot (596.5±18.2 g mean weight) were obtained from Jiaonan Aquatic Farm,Qingdao,China. After transferred to the laboratory,fish were placed in tanks equipped with a circulation and filtration water system,temperature (18±1°C) ,dissolved oxygen content (6±0.5 mg/L) ,pH (7.5±0.5) ,and salinity (31±0.5) were measured by a SX751 multi-parameter water quality analyzer (Lohand biological,Hangzhou,China) . After 48 h without feeding,18 individuals were collected for use in the experiment.
2.2 Experimental designEighteen individuals were transferred into a tank equipped with a cooling and circulating device that can decrease the sea water temperature according to a set program. During the trial,the water temperature was lowered from 18 to 1°C at a rate of <4°C/h when the water temperature was above 10°C,<2°C/h in the range from 10 to 3°C,and <0.5°C/h when the water temperature was below 3°C. The cooling process lasted 9 h. During the process,three individuals were sampled at 18 (set as the control) ,13,8,5,3,and 1°C.
2.3 Sample collectionThe sampled individuals were placed in 3-aminobenzoic acid ethyl ester (MS-222,200 mg/L) for rapid and deep anesthesia. The temperature of the MS-222 liquid was the same as that of the corresponding samples. Blood samples (0.5 mL) were quickly extracted from the caudal vein of each anesthetized turbot using heparinized (500 U sodium heparinate/mL) syringes to measure blood physiological indices. Blood samples for biochemical analysis were collected using non-heparinized syringes; these samples were kept at 5°C for 5 h and centrifuged at 12 000 g for 20 min to obtain plasma,which was stored at -80°C. After blood collection,samples of brain,head kidney,muscle,gill,stomach,intestine,heart,liver,kidney,and spleen were taken,frozen quickly in liquid nitrogen,and stored at -80°C forHSPgene expressions analysis.
2.4 Hematological analysisThe blood samples extracted with heparinized syringes were used to measure the red blood cell (RBC) count,white blood cell (WBC) count,and hemoglobin (Hb) content. To determine the total WBC count,a 1 to 100 dilution of the blood was created in phosphate buffer saline (PBS 0.02 mol/L,pH 7.3) ,whereas a 1 to 1 000 dilution was made to obtain the RBC count. Counts were made using a Neubauer Haemocytometer (Hawksley and Son Ltd,Lancing,West Sussex,UK) and are expressed as cells/μL. The concentration of Hb (g/L) was determined colorimetrically by measuring the formation of cyanhemoglobin using a spectrophotometer with a wavelength of 540 nm (Van Kampen and Zijlstra,1961) .
A BS-200 automatic biochemical analyzer (Mindary,Shenzhen,China) was used to measure the serum biochemical parameters of the plasma. Activities of alanine transaminase (ALT) ,aspartic transaminase (AST) ,γ-glutamyl transpeptidase (γ- GT) ,lactate dehydrogenase (LDH) ,and creatine kinase (CK) were measured,as well as the concentrations of nonprotein nitrogen (NPN) including blood urea nitrogen (BUN) ,uric acid (UA) ,and creatinine (CREA) . The concentrations of blood lipids,including cholesterol (CHOL) and triglyceride (TG) ,and the concentration of serum glucose (GLU) were also measured. The concentration of plasma COR was measured using a DELFIAR time-resolved fluoroimmunoassay kit (Perkin-Elmer Life Sciences,Boston,MA,USA) .
2.5 RNA extraction and cDNA synthesisTotal RNA was extracted from each 50 mg sample of the 10 tissues described above using Trizol Reagent (MDBio Inc.,Shanghai,China) following the manufacturer’s suggested procedure. A Nanodrop-8000 Spectrophotometer (Nanodrop Technologies,Wilmington,DE,USA) was used to assess the purity of RNA by determining the ratio of the absorbance at 260/280 nm and to quantify the concentration of RNA. All samples had 260/280 nm ratios above 1.8. Additionally,the integrity of the RNA preparations was verified by visualization of the 18S and 28S ribosomal bands stained with ethidium bromide after electrophoresis on 1.0% agarose gels. A sample of 1 μg of RNA was used as the template for synthesis of the first strand of cDNA using the PrimeScript RT Reagent Kit with gDNA Eraser (TaKaRa,Dalian,China) .
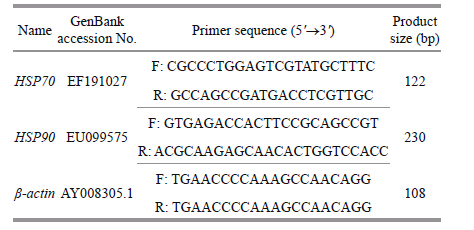
2.6 Real-Time PCR for HSP70 and HSP90 mRNA expressionA partial β-actin gene (108 bp) was used as the reference housekeeping gene to normalize the level of expression of HSP70 and HSP90 in different samples amplified using the specific primers. Primers of genes HSP70,HSP90,and β-actin were designed using Primer Premier 5.0 software (PREMIER Biosoft International,Palo Alto,CA,USA) based on the sequence from GenBank (http://www.ncbi.nlm.nih. gov) . The primers used in the trial are listed in Table 1. For all PCR primer pairs,optimal annealing temperatures were determined by examining the results of annealing temperature gradients. Reaction mixtures contained 12.5 μL of SYBR Green Supermix (TransGen,Beijing,China) ,0.5 μL of each primer,2 μL of template cDNA,and 9.5 μL of sterilized water in a final volume of 25 μL. Cycling parameters were: 95°C for 30 s,followed by 40 cycles of 5 s at 95°C,30 s at 60°C,followed by a dissociation curve stepping from 60 to 95°C in 0.5°C increments. Reactions were run in duplicate on a Fluorescence Quantitative PCR Detection System (Bioer,Hangzhou,China) . The relative levels ofHSPmRNA were expressed as ratios (HSP/β-actin) using the 2 (-∆∆Ct) method (Livak and Schmittgen,2001) .
|
Data were analyzed by one-way analysis of variance using SPSS 17.0 (SPSS,Chicago,IL,USA) . Differences between means were evaluated using Duncan’s multiple comparison test. Data are presented as means±SD (standard difference) of three replications. Values were considered to be signficantly different at P<0.05.
3 RESULT 3.1 Effect of low temperature stress on hematological parameters of S. maximusAs the temperature dropped from 18 to 8°C,the RBC count did not change signficantly,but it decreased signficantly (P<0.05) in the 5,3,and 1°C groups (Fig. 1a) . There was no significant difference in the WBC count among the 18,13,8,and 5°C groups,but it decreased signficantly (P<0.05) in the 3 and 1°C groups (Fig. 1b) . The concentration of Hb decreased signficantly (P<0.05) from 5 to 1°C and showed the same trend as the RBC count (Fig. 1c) . These results illustrate that blood physiological indices of S. maximus were affected by low temperature stress.

|
| Figure 1 Eff ect of temperature on red blood cells (RBC) count (a) , white blood cells (WBC) count (b) , and hemoglobin (Hb) concentration (c) in Scophthalmus maximus |
As the temperature dropped from 8 to 1°C,the activity of plasma ALT increased signficantly (P<0.05) ,and the highest activity occurred at 8°C b (Fig. 2a) . The activities of AST (Fig. 2b) and γ-GT (Fig. 2c) did not change signficantly in response to low temperature stress above 1°C. The activity of 7 LDH increased signficantly from 13 to 5°C (P<0.05) and then decreased to the initial level at 1°C (Fig. 2d) . The activity of CK increased signficantly (P<0.05) when temperature dropped at 8°C,reaching the highest (P<0.05) levels at 3 and 1°C (Fig. 2e) .

|
| Figure 2 Effect of temperature on the activities of serum alanine transaminase (ALT) (a) , aspartic transaminase (AST) (b) , γ-glutamyl transpeptidase (γ-GT) (c) , lactate dehydrogenase (LDH) (d) , and creatine kinase (CK) (e) in Scophthalmus maximus |
The plasma BUN concentration was highest at 8°C and lowest at 13 and 5°C (P<0.05) compared with the other groups (Fig. 3a) . The concentration of UA was highest at 8°C (P<0.05) and did not differ signficantly among the other groups (Fig. 3b) . The concentration

|
| Figure 3 Effect of temperature on concentrations of serum blood urea nitrogen (BUN) (a) , uric acid (UA) (b) , and creatinine (CREA) (c) in Scophthalmus maximus |
The concentrations of CHOL (Fig. 4a) and TG (Fig. 4b) did not change signficantly between 18 and 13°C,but both increased signficantly (P<0.05) from 8 to 1°C and had the highest value at 1°C. The concentration of plasma COR did not change signficantly between 18 and 13°C,increased signficantly (P<0.05) from 8 to 3°C,and increased signficantly (P<0.05) to the highest level at 1°C (Fig. 5a) . The concentration of GLU increased signficantly (P<0.05) from 13 to 3°C,and then decreased to the initial level at 1°C (Fig. 5b) .

|
| Figure 4 Eff ect of temperature on concentrations of serum cholesterol (CHOL) (a) and triglyceride (TG) (b) in Scophthalmus maximus |

|
| Figure 5 Eff ect of temperature on concentrations of serum cortisol (COR) (a) and glucose (GLU) (b) in Scophthalmus maximus |
These changes of plasma enzyme activities and NPN,lipid,GLU,and COR concentrations indicate that the blood biochemical indices of S. maximus were affected to varying degrees by low temperature stress.
3.2 Effect of low temperature stress on HSP70 and HSP90 gene expression in S. maximusIn brain and head kidney tissues,the abundance of HSP70 mRNA did not change signficantly from 18 to 3°C,but expression was up-regulated sharply at 1°C (P<0.05) (Fig. 6a) . In muscle,gill,stomach,and intestine tissues,the expression of HSP70 mRNA was up-regulated signficantly from 8 to 5°C (P<0.05) and then down-regulated to the initial level at 1°C. In heart,liver,kidney,and spleen tissues,the expression of HSP70 mRNA was up-regulated signficantly (P<0.05) at 13 or 8°C and then maintained a high level at the other temperatures (P<0.05) . HSP70 mRNA was most abundant in the 8 to 5°C temperature range in muscle,gill,stomach,and intestine tissues,whereas it was most abundant at 3°C in liver and a ab spleen tissues. The greatest abundances of HSP70 mRNA in brain,head kidney,heart,and kidney tissuesoccurred at 1°C.

|
| Figure 6 Eff ect of temperature on heat shock protein 70 (HSP70) (a) and heat shock protein 90 ( HSP90 ) (b) mRNA expressions in Scophthalmus maximus |
As the temperature dropped,the expression of HSP90 mRNA in all tissues showed the same tendency: it was up-regulated first and then down-regulated to the initial level. HSP90 mRNA was most abundant at 8°C in gill,stomach,intestine,heart,liver,kidney,and spleen tissues,whereas it was most abundant at 5°C in brain,head kidney,and muscle tissues (Fig. 6b) .
The changes in HSP70 and HSP90 gene expression indicated that HSP genes were affected by low temperature stress and that HSP70 gene expression showed more variability in different tissues compared with HSP90.
4 DISCUSSIONFish exposed to adverse conditions can undergo a stress response,which can be divided into primary (changes in hormone levels) and secondary (changes in plasma metabolite levels and hydromineral balance as well as hematological changes) responses (Barton,2002) . Under low temperature stress,fish can undergo physiological changes that are reflected in the hematological parameters,thus serum indexes can be sensitive indicators of physiological and pathological changes in fish (He et al.,2007) . Qiang et al. (2013) reported that the plasma RBC count,WBC count,and Hb concentration can be affected signficantly by temperature changes. In the optimum temperature range,biochemical reactions in the fish body can occur quickly when the need arises,leading to increased RBC count and Hb concentration to supply more oxygen (De Pedro et al.,2005) . When temperature is lowered,metabolism is suppressed,resulting in a reduced RBC count and Hb concentration (Bowden et al.,2007) .
In our study,the plasma RBC count and Hb concentration of S. maximus both decreased signficantly as the temperature dropped. This result had been observed in other species as well. For example,the RBC count and Hb concentration of tench (Tinca tinca) increased as water temperatureincreased,thus both were higher in summer than in winter (Guijarro et al.,2003) . Morgan et al. (2008) reported that the RBC count and WBC count in rainbow trout (Oncorhynchus mykiss) in the temperature range from 0 to 3°C were lower than those in the temperature range from 8 to 12°C. In fish,WBCs directly participate in the cell-mediated immune response and phagocytosis,which likely explains the higher immunity of fish at optimal water temperature (Secombes,1996) . In our study,the WBC count was lower at low temperature compared to the optimal temperature,which suggests reduced immunity at lower temperature. Overall,the changes in RBC count,WBC count,and Hb content that occurred with decreasing temperature in our study show that these blood physiological indices were affected by cold temperature stress.
Changes in serum enzyme activities in blood often directly reflect cell damage in specific organs (Casillas et al.,1983) . ALT,AST,and γ-GT mainly exist in the liver,and when the liver is stressed or damaged these enzymes can be released into the blood. Therefore,high activities of these enzymes may be indicative of liver impairment (Liu et al.,2007) . Our result indicates that the liver of turbot may be affected by low temperature and that ALT was more sensitive to low temperature compared with AST and γ-GT. AST,LDH,and CK are three important myocardial enzymes,and increased activities may reflect heart damage. Our result indicates that heart function may be affected and that CK may be a more effective indicator of the degreeof heart injury compared with AST and LDH. Because CK plays a key role in energy homeostasis of cells,high levels of CK may be indicative of heart injury (Shahsavani et al.,2010) .
BUN,UA,and CREA are three important components of NPN in serum,and changes in their concentrations may indicate changes in kidney function (Chang et al.,2006) . In our study,the highest concentrations of BUN and UA in S. maximus occurred at 8°C,and then declined. This trend likely reflects the high tolerance and acclimation ability of the kidney to low temperature. The concentration of CREA increased signficantly from 3 to 1°C,which may be related to weakening of the kidney’s filtration ability (Sano,1962) . The changes in BUN,UA,and CREA concentrations that occurred as temperature decreased may indicate the minor degree of kidney damage above 3°C.
CHOL and TG,which are both transported by lipoproteins in fish blood,are the main forms of stored lipids,and they are also important components of the cell membrane. As temperature dropped from 8 and 5°C,the concentrations of CHOL and TG increased signficantly. In this temperature range,lipid metabolism was accelerated and high levels of COR were present,resulting in the high levels of CHOL and TG (Sheridan,1986) . In addition,levels of unsaturated fatty acids may have been enhanced to help the fish acclimate to low temperature (Buda et al.,1994) .
Alterations of serum COR level are considered to be an indicator of the stress response (Cataldi et al.,1998) . In our experiment,plasma COR concentration increased signficantly as the temperature decreased,and the stress response became stronger with lower temperature. Weber and Bosworth (2005) reported that plasma COR concentration increased in channel catfish (Ictalurus punctatus) in response to cold stress,and Tanck et al. (2000) found that plasma COR levels increased in common carp (Cyprinus carpio) after single or multiple rapid temperature drops.
The serum GLU concentration is considered to be a reliable indicator of environmental stress in fish (Sun et al.,1992) . In this study,the concentration of GLU increased continuously as temperature dropped from 18 to 3°C and then decreased to the initial level at 1°C. This result was in agreement with the opinion of Janssens and Waterman (1988) ,they found while COR in high level,gluconeogenesis in liver was enhanced,resulting in a raised concentration of serum GLU. When the temperature dropped to 1°C,the fish required more energy to withstand the cold,thus GLU was transformed to ATP and the GLU concentration declined (Woo,1990) .
Typically,temperature stress leads to rapid molecular changes,which can be evaluated using molecular indicators (Sánchez et al.,2001) . HSPs are the most prominently induced proteins in response to temperature stress (Luft et al.,1996) . Thus,expression ofHSPgenes is always considered to be an indicator of stress (Feder and Hofmann,1999) . HSP70 and HSP90 gene expressions generally are enhanced after an abrupt temperature elevation (Wood et al.,1999) . A high level of HSPs mRNA indicates that stress may induce body damage and the corresponding organism starts to cope with environmental stressors (Feder and Hofmann,1999) . In the present study,the levels of HSP70 mRNA in brain and head kidney tissues increased sharply at 1°C,which was consistent with results for brain tissue of channel fish (Ju et al.,2002) . The brain and head kidney tissues may be affected or damaged only at the lowest temperature due to their strong resistance to the low temperature damage. HSP70 gene expression levels in muscle,gill,stomach,and intestine tissues increased as temperature changed from 8 to 3°C,which indicates a stress response at low temperature. However,HSP70 gene expression decreased to the initial level at 1°C,perhaps because they had acclimated to cold temperature by this point. HSP70 gene expression levels in heart,liver,kidney,and spleen tissues increased continuously throughout the entire cooling process,which may be because these tissues required constant protection of HSP70.
In the present study,HSP90 gene expression increased more abruptly as the temperature decreased from 8 to 3°C. A similar result was reported for sea lampreys (S. maximus) (Wood et al.,1999) . However,HSP90 gene expression decreased to the initial level in all tissues at 1°C. The differences between HSP70 and HSP90 gene expression suggest that HSP70 may be more important in dealing with temperature-induced damage in some tissues. The gene expression data showed that the stress response was induced by low temperature and that different tissues had different tolerance to cold shock. Some tissues could not acclimate to cold shock,which was demonstrated by the continuous increase ofHSPmRNA levels,whereas other tissues could cope with the temperature and recover after acclimation. Thus,more attention should be paid to the tissues that exhibited little tolerance to low temperature.
5 CONCLUSIONResults of our study indicate that S. maximus undergoes a stress response in the range of 8 to 5°C as temperature decreases rapidly from 18 to 1°C,which demonstrated by changes in the hematological indicators andHSPgene expressions. The blood RBC count,WBC count,and Hb content could be sensitive indicators in response to low temperature stress. Enzyme activities of serum ALT and CK are more sensitive than AST,γ-GT,and LDH. Concentrations of serum BUN,UA,and CREA likely reflect a high tolerance and acclimation ability of the kidney. Concentrations of serum CHOL and TG are also sensitive when stress response occurs. Concentrations of serum COR and GLU are more sensitive in response to low temperature stress,and often show the same tendency in a certain temperature range. The molecular indicator of HSP70 shows differential patterns in various tissues andproves to be a more diverse molecular indicator of temperature stress compared with HSP90. To avoid body damage of turbot in the aquaculture setting,temperature should be kept above 8°C.
| Barton B A, Iwama G K, 1991. Physiological changes in fish from stress in aquaculture with emphasis on the response and effects of corticosteroids. Annual R eview of Fish Diseases, 1 : 3 –26. Doi: 10.1016/0959-8030(91)90019-G |
| Barton B A, 2002. Stress in fishes:a diversity of responses with particular reference to changes in circulating corticosteroids. Integrative and Comparative Biology, 42 (3) : 517 –525. Doi: 10.1093/icb/42.3.517 |
| Basu N, Todgham A E, Ackerman P A, Bibeau M R, Nakano K, Schulte P M, Iwama G K, 2002. Heat shock protein genes and their functional significance in fish. Gene, 295 (2) : 173 –183. Doi: 10.1016/S0378-1119(02)00687-X |
| Baum D, Laughton R, Armstrong J D, Metcalfe N B, 2005. The effect of temperature on growth and early maturation in a wild population of Atlantic salmon parr. Journal of Fish Biology, 67 (5) : 1370 –1380. Doi: 10.1111/jfb.2005.67.issue-5 |
| Bowden T J, Thompson K D, Morgan A L, Gratacap R M L, Nikoskelainen S, 2007. Seasonal variation and the immune response:a fish perspective. Fish & Shellfish Immunology, 22 (6) : 695 –706. |
| Brett J R, Groves T D D, 1979. Physiological energetics. In:Hoar W S, Randall D J, Brett J R eds. Fish Physiology. Academic Press, New York279-352. |
| Buda C, Dey I, Balogh N, et al, 1994. Structural order of membranes and composition of phospholipids in fish brain cells during thermal acclimatization. Proceedings of the National Academy of Sciences of the United States of America, 91 (17) : 8234 –8238. Doi: 10.1073/pnas.91.17.8234 |
| Casillas E, Meyers M, Ames W E, 1983. Relationship of serum chemistry values to liver and kidney histopathology in English sole(Parophrys vetulus)after acute exposure to carbon tetrachloride. Aquatic Toxicology, 3 (1) : 61 –78. Doi: 10.1016/0166-445X(83)90007-3 |
| Cataldi E, Di Marco P, Mandich A, Cataudella S, 1998. Serum parameters of Adriatic sturgeon Acipenser naccarii(Pisces:Acipenseriformes):effects of temperature and stress. Comparative B iochemistry and P hysiology Part A:Molecular & Integrative Physiology, 121 (4) : 351 –354. |
| Chang Y M, Kuang Y Y, Cao D C, Liang L Q, Sun X W, Lei Q Q, 2006. Effects of cooling temperature stress on hematology and serum chemistry values of Cyprinus carpio. Journal of Fisheries of China, 30 (5) : 701 –706. |
| Corey P D, Leith D A, English M J, 1983. A growth model for coho salmon including effects of varying ration allotments and temperature. Aquaculture, 30 (1-4) : 125 –143. Doi: 10.1016/0044-8486(83)90157-6 |
| De Pedro N, Guijarro A I, López-Patiño M A, MartínezÁlvarez R, Delgado M J, 2005. Daily and seasonal variations in haematological and blood biochemical parameters in the tench, Tinca tinca Linnaeus, 1758. Aquaculture Research, 36 (12) : 1185 –1196. Doi: 10.1111/are.2005.36.issue-12 |
| Engelsma M Y, Hougee S, Nap D, Hofenk M, Rombout J H W M, Van Muiswinkel W B, Verburg-van Kemenade B M L, 2003. Multiple acute temperature stress affects leucocyte populations and antibody responses in common carp, Cyprinus carpio L. Fish & Shellfish Immunology, 15 (5) : 397 –410. |
| Feder M E, Hofmann G E, 1999. Heat-shock proteins, molecular chaperones, and the stress response:evolutionary and ecological physiology. A nnual R eview o f P hysiology, 61 (1) : 243 –282. |
| Goos H J Th, Consten D, 2002. Stress adaptation, cortisol and pubertal development in the male common carp,(Cyprinus carpio). M olecular and Cellular E ndocrinology, 197 (1-2) : 105 –116. Doi: 10.1016/S0303-7207(02)00284-8 |
| Guijarro A I, Lopez-Patiño M A, Pinillos M L, Isorna E, De Pedro N, Alonso-Gómez A L, Alonso-Bedate M, Delgado M J, 2003. Seasonal changes in haematology and metabolic resources in the tench. Journal of Fish Biology, 62 (4) : 803 –815. Doi: 10.1046/j.1095-8649.2003.00066.x |
| Guo B, Wang F, Dong S L, Hou C Q, 2010. Effects of rapid temperature changes on HK, PK and HSP70 of Litopenaeus vannamei in different seasons. Journal of Ocean Univ ersity of China, 9 (3) : 303 –308. Doi: 10.1007/s11802-010-1742-9 |
| He F L, Xiang J G, Li C J, Li Z Z, Chen K J, 2007. Preliminary study on the effect of water temperature on hematology indices of Rainbow Trout. Acta H ydrobiologica S inica, 31 (3) : 363 –369. |
| Janssens P A, Waterman J, 1988. Hormonal regulation of gluconeogenesis and glycogenolysis in carp(Cyprinus carpio)liver pieces cultured in vitro. Comparative B iochemistry and P hysiology Part A:Physiology, 91 (3) : 451 –455. Doi: 10.1016/0300-9629(88)90617-2 |
| Ju Z, Dunham R, Liu Z, 2002. Diff erential gene expression in the brain of channel catfish(Ictalurus punctatus)in response to cold acclimation. M olecular G enetics and G enomics, 268 (1) : 87 –95. |
| Kenari A A, Mozanzadeh M T, Pourgholam R, 2011. Effects of total fish oil replacement to vegetable oils at two dietary lipid levels on the growth, body composition, haematoimmunological and serum biochemical parameters in caspian brown trout(Salmo trutta caspius Kessler, 1877). Aquaculture Research, 42 (8) : 1131 –1144. Doi: 10.1111/j.1365-2109.2010.02701.x |
| Lanneau D, Brunet M, Frisan E, Solary E, Fontenay M, Garrido C, 2008. Heat shock proteins:essential proteins for apoptosis regulation. Journal of Cellular and M olecular M edicine, 12 (3) : 743 –761. Doi: 10.1111/j.1582-4934.2008.00273.x |
| Lermen C L, Lappe R, Crestani M, Vieira V P, Gioda C R, Schetinger M R C, Morsch V M, 2004. Eff ect of different temperature regimes on metabolic and blood parameters of silver catfish(Rhamdia quelen). Aquaculture, 239 (1) : 497 –507. |
| Liu S M, Zang X N, Liu B, Zhang X C, Arunakumara K K I U, Zhang X Q, Liang B, 2007. Eff ect of growth hormone transgenic Synechocystis on growth, feed efficiency, muscle composition, haematology and histology of turbot(Scophthalmus maximus L. ). Aquaculture Research, 38 (12) : 1283 –1292. Doi: 10.1111/are.2007.38.issue-12 |
| Livak K J, Schmittgen T D, 2001. Analysis of relative gene expression data using real-time quantitative PCR and the 2(-ΔΔCt) method. Methods, 25 (4) : 402 –408. Doi: 10.1006/meth.2001.1262 |
| Luft J C, Wilson M R, Bly J E, Miller N W, Clem L W, 1996. Identification and characterization of a heat shock protein 70 family member in channel catfish(Ictalurus punctatus). Comparative B iochemistry and P hysiology Part B:Biochemistry and Molecular Biology, 113 (1) : 169 –174. Doi: 10.1016/0305-0491(95)02022-5 |
| Lund S G, Lund M E, Tufts B L, 2003. Red blood cell Hsp70 mRNA and protein as bio-indicators of temperature stress in the brook trout(Salvelinus fontinalis). Canadian Journal of Fisheries and Aquatic Sciences, 60 (4) : 460 –470. Doi: 10.1139/f03-039 |
| Martins M L, Xu D H, Shoemaker C A, Kleisus P H, 2011. Temperature effects on immune response and hematological parameters of channel catfish Ictalurus punctatus vaccinated with live theronts of Ichthyophthirius multifiliis. Fish & Shellfish Immunology, 31 (6) : 774 –780. |
| Morgan A L, Thompson K D, Auchinachie N A, Migaud H, 2008. The effect of seasonality on normal haematological and innate immune parameters of rainbow trout Oncorhynchus mykiss L. Fish & Shellfish Immunology, 25 (6) : 791 –799. |
| Person-Le Ruyet J, Mahé K, Le Bayon N, Le Delliou H, 2004. Effects of temperature on growth and metabolism in a Mediterranean population of European sea bass, Dicentrarchus labrax. Aquaculture, 237 (1-4) : 269 –280. Doi: 10.1016/j.aquaculture.2004.04.021 |
| Piferrer F, Cal R M, Álvarez-Blázquez B, Sánchez L, Martinez P, 2000. Induction of triploidy in the turbot(Scophthalmus maximus):I. Ploidy determination and the effects of cold shocks. Aquaculture, 188 (1-2) : 79 –90. |
| Qiang J, Yang H, Wang H, Kpundeh M D, Xu P, 2013. Interacting effects of water temperature and dietary protein level on hematological parameters in Nile tilapia juveniles, Oreochromis niloticus(L. )and mortality under Streptococcus iniae infection. Fish & Shellfish Immunology, 34 (1) : 8 –16. |
| Řehulka J, Minařík B, Řehulková E, 2004. Red blood cell indices of rainbow trout Oncorhynchus mykiss(Walbaum)in aquaculture. Aquaculture Research, 35 (6) : 529 –546. Doi: 10.1111/are.2004.35.issue-6 |
| Rissanen E, Tranberg H K, Sollid J, Nilsson G E, Nikinmaa M, 2006. Temperature regulates hypoxia-inducible factor-1(HIF-1)in a poikilothermic vertebrate, crucian carp(Carassius carassius). Journal of E xperimental Biology, 209 (6) : 994 –1003. Doi: 10.1242/jeb.02103 |
| Sánchez A, Pascual C, Sánchez A, Vargas-Albores F, Le Moullac G, Rosas C, 2001. Hemolymph metabolic variables and immune response in Litopenaeus setiferus adult males:the effect of acclimation. Aquaculture, 198 (1-2) : 13 –28. Doi: 10.1016/S0044-8486(00)00576-7 |
| Sano T H, 1962. Haematological studies of the culture fishes in Japan. 6. Variation in blood constituents of Japanese eel, Anguilla japonica, during starvation. Journal of the Tokyo University of Fisheries, 48 : 105 –109. |
| Secombes C J, 1996. The nonspecific immune system:cellular defenses. In:Iwama G, Nakanishi T eds. The Fish Immune System:Organism, Pathogen and Environment. Academic Press, San Diego, CA, USA63-103. |
| Shahsavani D, Mohri M, Kanani H G, 2010. Determination of normal values of some blood serum enzymes in Acipenser stellatus Pallas. Fish Physiol ogy and Bioche mistry, 36 (1) : 39 –43. Doi: 10.1007/s10695-008-9277-3 |
| Sheridan M A, 1986. Effects of thyroxin, cortisol, growth hormone and prolactin on lipid metabolism of coho salmon(Oncorhynchus Kisutch), during smoltification. General and Comparative E ndocrinology, 64 (2) : 220 –238. Doi: 10.1016/0016-6480(86)90007-9 |
| Sun L T, Chen G R, Chang C F, 1992. The physiological responses of tilapia exposed to low temperatures. Journal of T hermal Biology, 17 (3) : 149 –153. Doi: 10.1016/0306-4565(92)90026-C |
| Tanck M W T, Booms G H R, Eding E H, Bonga S E W, Komen J, 2000. Cold shocks:a stressor for common carp. Journal of Fish Biology, 57 (4) : 881 –894. Doi: 10.1111/jfb.2000.57.issue-4 |
| Van Kampen E J, Zijlstra W G, 1961. Standardization of hemoglobinometry II. The hemiglobincyanide method. C linica C himica A cta, 6 (4) : 538 –544. |
| Wang Q L, Dong Y W, Qin C X, Yu S S, Dong S L, Wang F, 2013. Effects of rearing temperature on growth, metabolism and thermal tolerance of juvenile sea cucumber, Apostichopus japonicus Selenka:critical thermal maximum(CTmax)and hsps gene expression. Aquaculture Research, 44 (10) : 1550 –1559. Doi: 10.1111/are.2013.44.issue-10 |
| Weber T E, Bosworth B G, 2005. Effects of 28 day exposure to cold temperature or feed restriction on growth, body composition, and expression of genes related to muscle growth and metabolism in channel catfish. Aquaculture, 246 (1-4) : 483 –492. Doi: 10.1016/j.aquaculture.2005.02.032 |
| Woo N Y S, 1990. Metabolic and osmoregulatory changes during temperature acclimation in the red sea bream Chrysophyrys major:implications for its culture in the subtropics. Aquaculture, 87 : 197 –208. Doi: 10.1016/0044-8486(90)90275-R |
| Wood L A, Brown I R, Youson J H, 1999. Tissue and developmental variations in the heat shock response of sea lampreys(Petromyzon marinus):effects of an increase in acclimation temperature. Comparative B iochemistry and P hysiology A, 123 : 35 –42. |
| Yin F, Sun P, Peng S, Tang B, Zhang D, Wang C, Shi Z, 2013. The respiration, excretion and biochemical response of the juvenile common Chinese cuttlefish(Sepiella maindroni)at different temperatures. Aquaculture, 402 : 127 –132. |