 2016, 34
Institute of Oceanology, Chinese Academy of Sciences
Article Information
- Shiguang SHAO(邵世光), Lianqing XUE(薛联青), Cheng LIU(刘成), Jingge SHANG(商景阁), Zhaode WANG(王兆德), Xiang HE(何翔), Chengxin FAN(范成新)
- Assessment of heavy metals in sediment in a heavily polluted urban river in the Chaohu Basin, China
- Journal of Oceanology and Limnology, 34(3): 526-538
- http://dx.doi.org/10.1007/s00343-015-4240-5
Article History
- Received: Oct. 11, 2014
- Accepted: Apr. 2, 2015


2. State Key Laboratory of Lake Science and Environment, Nanjing Institute of Geography and Limnology, Chinese Academy of Sciences, Nanjing 210008, China;
3. College of Science, China Pharmaceutical University, Nanjing 210009, China
At present,heavy metal pollution of aquatic systems is a serious global environmental problem. In general,heavy metals are adsorbed onto particles (Förstner and Salomons,1980) ,and are then discharged into rivers with wastewater ( Hudson-Edwards et al.,1997; Rawat et al.,2003) . These sediment-associated metals settle temporarily in lakes (Chen and Lin,2001; Jong and Parry,2004) ,where they undergo complex physicochemical reactions (Teasdale et al.,2003) . However,these metals should be viewed as a “chemical time bomb” in the sediment because when the environmental conditions,such as the pH or redox potential (Stigliani et al.,1991) , change,they may be transformed to a more available form. Heavy metals have long-term toxic effects on ecosystems (Gaur et al.,2014) ,and have implications fo-r public health,such as Minamata disease and Itai- itai disease in Japan. Therefore,it is important to determine the degree of heavy metal pollution in sediment (Yi et al.,2011) .
Urban rivers that flow through residential,industrial,and agricultural areas and business centers inevitably transport large quantities of pollutants into lakes (Zan et al.,2011) . They can have severe impacts on the health of lake ecosystems because of their high pollutant inputs. Many rivers throughout the world are polluted with heavy metals (Järup,2003; Akinci et al.,2013) . Approximately 90% of urban rivers in China experience different degrees of pollution (MEPC,2013) and it was estimated that 900 tons of heavy metals were transported into freshwater bodies in China in 2007 (MEPC et al.,2010) . It is therefore clear that heavy metal pollution has become a major problem in recent years (MEPC,2011; He et al.,2013) .
Heavy metal-related research has been on-going for many years,but studies on changes in heavy metal pollution in urban river sediments are rare. This may reflect the fact that sources of heavy metals in cities that have experienced rapid industrialization and population expansion are very complicated and the pollution status is highly variable,even in adjacent river reaches. This means that it is very diffcult to carry out an objective and accurate assessment of spatial and temporal changes in heavy metal pollution. Such assessments are data-intensive,and rely on the choice of appropriate and effective methods. Multivariate statistical analysis methods are useful,reliable tools that can be used in studies of heavy metal pollution (Kazi et al.,2009) . Fuzzy comprehensive assessment (FCA) ,derived from the fuzzy set theory (Zadeh,1965) ,is an effective method for multi-factorial assessment (Wang,2002) . Results from this assessment directly reflect the status of the object being evaluated. To date,very few studies have assessed the spatial and temporal variability of heavy metal pollution in urban river sediments by the FCA method. Therefore,we used this method in this study to carry out a thorough and objective study of changes in pollution. We believe that this method can provide us with an improved understanding of the current ecological status of the region and the potential risks from heavy metal pollution.
The Nanfei River is an important inflow to Chaohu Lake. It contributes 15% of the inflow water,but more than 40% of the external pollutant load,to the lake (MEPC and CAEP,2000) . As far as we know,there have been no previous studies of heavy metal pollution in the Nanfei River watershed. Therefore,to address this gap in knowledge,we identified the sources of contamination and assessed spatial and temporal changes in heavy metal pollution. The specific aims of this study were (1) to determine the distribution of heavy metals in sediments in the Nanfei River; (2) to identify the sources of heavy metal pollution in the Nanfei River sediments,and (3) to assess the levels of heavy metals and demonstrate changes in the pollution of sediments in the Nanfei River watershed using the FCA method.
2 MATERIAL AND METHOD 2.1 Study areaThe Nanfei River is a typical urban river in Anhui Province,China. It covers an area of 1 640 km2 and has a channel length of 70 km. There is a reservoir in the upper reaches,and it flows into Chaohu Lake (Anhui Province,China) ,one of the five largest freshwater lakes in China. Its main channel and many of its tributaries flow through Hefei City,the capital of Anhui Province. Hefei has a population of 4 million and land use within its boundaries comprises residential,industrial and agricultural areas,and various business districts. In the past 30 years,Hefei has experienced rapid economic development and population growth,and large quantities of pollutants have been discharged into the river,meaning that the Nanfei River has become increasingly polluted and large volumes of heavy metals have accumulated in the sediments.
2.2 Sediment sampling strategySediment cores were collected from 21 sites in April 2012. Twelve sites were chosen in the Nanfei River,eight were chosen in the tributaries,and one site was chosen in Chaohu Lake (Fig. 1) . When selecting the sampling sites,we considered the characteristics of the riparian areas,possible pollution sources,and inputs from tributaries to the Nanfei River. The sampling sites were chosen to represent the different land use types (residential,industrial and agricultural areas,and business centers,downstream of tributary inflows) and were distributed along the main channel,from the upper reaches to the estuary of the Nanfei River. Sampling sites were also chosen in the lower reaches of the tributaries.

|
| Figure 1 Locations of the sampling sites |
The sediment cores (0-20 cm) were collected using a core sampler. The undisturbed sediment cores were stored at 4°C under nitrogen and transported to the laboratory. To enable examination of depth profiles of heavy metals in the Nanfei River sediments,the core samples were then sliced into segments (0-1,1-2,2-3,3-4,4-5,5-6,6-8,8-10,10-15,and 15-20 cm) in an anaerobic operation box.The samples were freeze-dried,crushed,passed through a 63-μm mesh sieve,and stored in the dark at 4°C until analysis.
2.3 Chemical analysis 2.3.1 Total heavy metal analysisThe total concentrations of heavy metals were determined using a microwave-assisted acid digestion procedure (USEPA,1995) . The concentrations of chromium (Cr) ,nickel (Ni) ,copper (Cu) ,zinc (Zn) ,arsenic (As) ,cadmium (Cd) ,lead (Pb) ,and mercury (Hg) were measured by inductively coupled plasma- atomic emission spectrometry (ICP-AES; PerkinElmer DV4300) ,and the precision was within 10 % of the relative standard deviation.
2.3.2 Loss on ignition (LOI) analysisA sample of the freeze-dried,ground and sieved (<63 μm) sediment was transferred to a crucible,placed in a desiccator for 12 h,and then weighed. It was then transferred to a muffle furnace,and calcined at 550°C for 4 h. After calcination,the crucible was placed in a desiccator until it reached room temperature and then weighed to calculate the LOI.
2.4 Quality assuranceQuality control was assured by analyzing duplicate samples and comparing analysis results with those for standard reference materials. Reagent blanks were carried out in parallel with all sample analyses. A mixed multi-element standard solution (CL-CAL-2) ,obtained from SpexTM Claritas PPT®,was used for calibration. Samples were analyzed in duplicate at intervals of 10 measurements to calibrate the concentrations of the eight metals. Certified reference materials of the sediment (GBW07408,GSBZ50013-88) were used for total metal analysis and recoveries of the measured metals were within 90%-115% of the range of the reference materials.
2.5 Statistical analysisData were summarized using the average,maximum,minimum,standard deviation,and coeffcient of variation (CV) . Robust statistical methods were used for the data analysis. The statistical significance of the relationships between the factors was assessed. Principal components analysis (PCA) ,correlation analysis,and cluster analysis were performed using SPSS version 19.0.
2.6 Fuzzy comprehensive assessment analysisThe FCA model is presented in Eq.1:
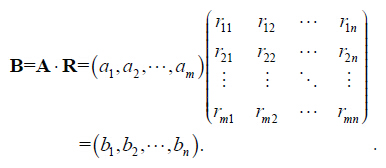 (1)
(1)The fuzzy comprehensive assessment (FCA) method is based on the fuzzy mathematics theory.The weight vector (A) is established by the entropy method (Shannon,1948) ; the membership matrix (R) is calculated using the membership function shown in Eq.2 (Fang et al.,2010) ,and the assessment results are given by vector B. In Eq.1,the term ai (i=1,2,…,m) represents the i-th weighting factor and vector A comprises the individual weights. ai must satisfy ai≥0 and ∑ai=1. rij (i=1,2,…,m; j=1,2,…,n) (0≤rij≤1) corresponds to the parameter being evaluated and it evaluates the factor relative to the grade of membership of the fuzzy subset. bj (j=1,2,…,n) indicates the membership degree of the parameter being evaluated relative to the evaluation ratings of the fuzzy subset and is calculated from the standard scores for heavy metals that are based on the Chinese Environmental Quality Standards for Soils (CSEPA,1995) (Table 1) .
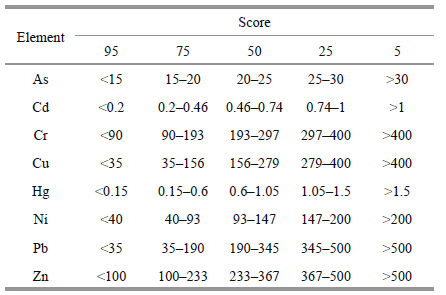
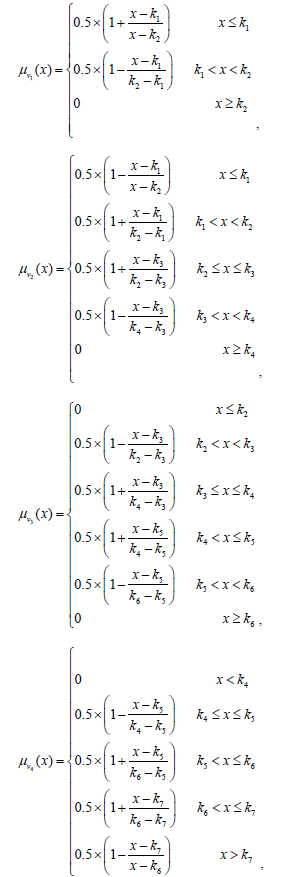
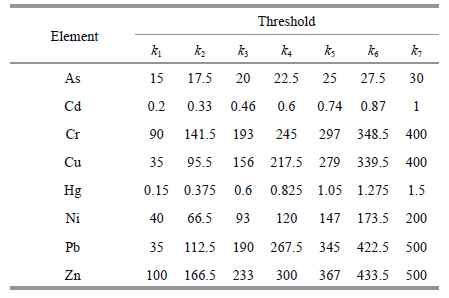
where μvi (x) is the membership degree; x is the heavy sediments from the main channel of the Nanfei River is significantly different from the distribution in metal concentration,and k represents the thresholds shown in Table 2. Scores of 95,75,50,25,and 5 have critical values of k1,k3,k5,and k7,respectively,and the midpoint scores (75,50,and 25) have values of k2,k4,and k6,respectively.
The metal concentrations in the surface (0-1 cm) sediments from the Nanfei River watershed are shown in Table 3. At all of the sampling sites,the average concentrations of the eight heavy metals were higher than the average environmental background values (CSEPA and CNEMC,1990) ,which indicates widespread heavy metal pollution. Maximum concentrations of Cd,Cu,Hg,Cr,Ni,Pb,Zn,and As were detected at sites B1,B1,B1,B2,B2,F8,F8,and F10,respectively,which indicates that sites B1,B2,F8,and F10 are heavily polluted and should be investigated. The high levels of metals in the surface sediments demonstrate that there are ongoing pollutant inputs,and ongoing transport of metals from known and partly unknown sources (Bergbäck et al.,2001) . The CV values of Cd,Cu,and Hg indicate point source pollution (Table 3) . Surface sediments are at the sediment-water interface,where the potential to impact on biological systems and water bodies is greatest (Santschi et al.,1990) . In addition,surface sediments are freshly deposited (Friedman and Sanders,1978) ,and may help us to detect current pollution sources and problems.

|
Chaohu Lake. Interestingly,the absolute levels of the same element were very different at adjacent sampling sites,such as at sites F1,F2,and F3,which may reflect the complex effects of human activities on urban rivers (Cheng,2003) . Results indicate that this region has been severely polluted from a range of sources. The vertical profiles of some heavy metals fluctuated notably along the Nanfei River,which contrasts with the results of Feng et al. (1998) who,in their study of the Hudson River,found that heavy metals decreased gradually due to sediment transport. However,our results are consistent with studies on the Gomati River (Singh et al.,1997) and the Yamuna River (Singh,2001) . The significant differences in the distribution of metal pollution may reflect the very gentle hydraulic gradient of the Nanfei River (1/15 000-1/30 000) . River flow decreases to almost zero during the dry season because of the Dongpu Reservoir impoundment,and may also influence the distribution of metal pollution.
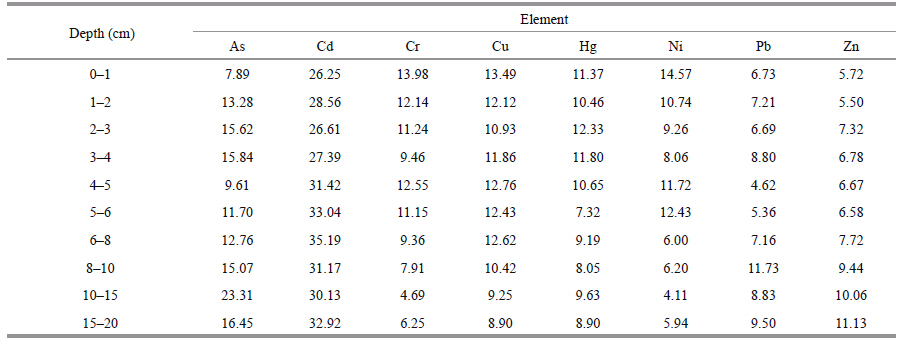
The concentrations of As, Cd, Cr, Cu, Hg, Ni, Pb,and Zn in the upper 20 cm of sediments ranged from 5.67-113, 0.08-40.2, 41.6-524, 15.5-460, 0.03-4.84,13.5-180, 18.8-250, and 47.9-1 996 mg/kg,respectively. The mean concentrations of heavy metals in all sediment samples exceeded the average background values of Anhui Province and China.In particular, the maximum concentrations of As, Cd, Cr,Cu, Hg, Ni, and Zn were greater than the maximum background concentrations of Anhui Province, and the maximum concentrations of Cd, Cu, and Zn exceeded the maximum background values of China (CSEPA and CNEMC,1990) . Examination of the vertical profiles of metals shows that there was variation in the absolute levels of heavy metals in the sediment layers between sampling sites (Fig. 2) . In particular, the distribution of heavy metals in sediments from the main channel of the Nanfei River is significantly different from the distribution in Chaohu Lake. Interestingly, the absolute levels of the same element were very different at adjacent sampling sites, such as at sites F1, F2, and F3, which may refl ect the complex effects of human activities on urban rivers (Cheng, 2003) . Results indicate that this region has been severely polluted from a range of sources.The vertical profiles of some heavy metals fluctuated notably along the Nanfei River, which contrasts with the results of Feng et al. (1998) who, in their study of the Hudson River, found that heavy metals decreased gradually due to sediment transport. However, our results are consistent with studies on the Gomati River (Singh et al., 1997) and the Yamuna River (Singh , 20017) . The significant differences in the distribution of metal pollution may refl ect the very gentle hydraulic gradient of the Nanfei River (1/15 000-1/30 000) . River flow decreases to almost zero during the dry season because of the Dongpu Reservoir impoundment, and may also influence the distribution of metal pollution.

|
| Figure 2 Vertical distribution of heavy metal concentrations in sediments |
The maximum and mean concentrations of As,Cd,Cr,Cu,Hg,Ni,and Zn in sediments were much higher than the background levels for Anhui Province (CSEPA and CNEMC,1990) . The maximum Cd concentration was 115 times greater than the background value. The average values of the eight metals were between 1.33 and 38.66 times greater than the average background level in Anhui Province,which clearly indicates anthropogenic effects (Nriagu et al.,1979) . The Cd concentration was highest at site F3 (4-5 cm) ,and was much higher than the concentrations at either F2 (upstream) or F4 (downstream) . The Cd concentrations at B1 and B2 (upstream of F3,in the Banqiao River) were similar to the concentration at F3. This indicates that the Banqiao River is severely polluted by Cd; it also plays a vital role in metal transport (Miller et al.,2003) and is a major source of metal pollution to the Nanfei River.
3.2 Determination of pollution sourcesThe Nanfei River flows through Hefei City,where large quantities of untreated industrial wastewater and domestic sewage are discharged directly into the river (MEPC,2008) . The components of sewage are very complicated (MEPC,2011) . Multivariate statistical analysis can be used to identify pollutant sources,categorize contaminants,and analyze the relationships between them (Lu et al.,2010) . Multivariate statistical analysis comprises many useful tools for environmental data analysis,including PCA,correlation analysis and cluster analysis.
3.2.1 Principal components analysis and correlation analysisThe results of PCA of the heavy metals in the Nanfei River sediments are shown in Fig. 3. Heavy metals were loaded on PC1 and PC2. The variances of PC1 (eigenvalue=4.413) and PC2 (eigenvalue=2.004) were 55.16% and 25.05%,respectively. Eight components were extracted,but only the two components with eigenvalues greater than one were considered valid (Reid and Spencer,2009) . As shown in Fig. 3,PC1 included Hg,Cu,Cr,Cd,and Ni,all of which had much higher loadings for PC1 than PC2. PC2 included As and Pb,both of which had much higher loadings for PC2 than PC1. Zn had similar loadings on PC1 (0.711) and PC2 (0.634) .

|
| Figure 3 Heavy metal loading diagram for PC1 and PC2 |
The metals that sat together (Hg,Cu,Cr,Cd,and Ni) in the loading diagram had higher correlation coeffcients (Table 4) . Table 4 shows the results of correlation of the LOI with eight heavy metals. The Pearson’s correlation coeffcients for Cd,Cr,Cu,Hg,Ni,and Zn were greater than 0.5 and those for Cr,Cu,Hg,and Ni exceeded 0.7. LOI was correlated with the concentrations of most metals except As and Pb,which indicates that the release of some heavy metals into the sediment might be associated with degradation of organic matter (Loska and Wiechuła,2003) . More specifically,there have been combined discharges of domestic sewage and industrial wastewater into the Nanfei River over the past few decades (Zheng et al.,2010) ,which shows that these heavy metals were derived from anthropogenic industrial activities. Ni and Cr were strongly correlated and had a correlation coeffcient of 0.951. This suggests that they had a common source,most probably plating,stainless steel,and metallurgical processing industries that use large volumes of Ni and Cr. The Pearson’s correlation coeffcients for As and Pb (0.523) belonged to PC2 and they had a similar distribution pattern,indicating that As and Pb were mainly from agricultural production activities.
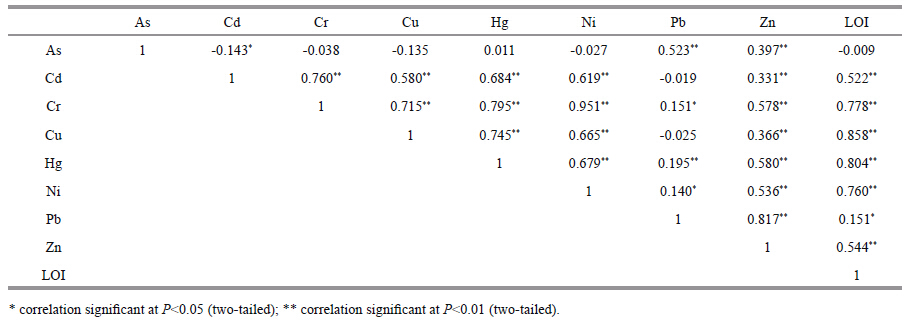
|
Results from cluster analysis for the eight heavy metals are shown in Fig. 4. The dendrogram shows that all of the heavy metals (a total of 1 680 data points) can be clustered into three categories (similarity>86 %) : the first cluster comprised Cd; the second cluster was made up of Cu,Hg,Cr,and Ni,and the third cluster was made up of As,Zn,and Pb. The cumulative concentrations of the heavy metals can be classified as high,intermediate,or low pollution levels based on the heavy metal background values (CSEPA and CNEMC,1990) . Pollution from Cd was most severe and should be a concern for the regulators.

|
| Figure 4 Dendrogram of heavy metals in the Nanfei River watershed |
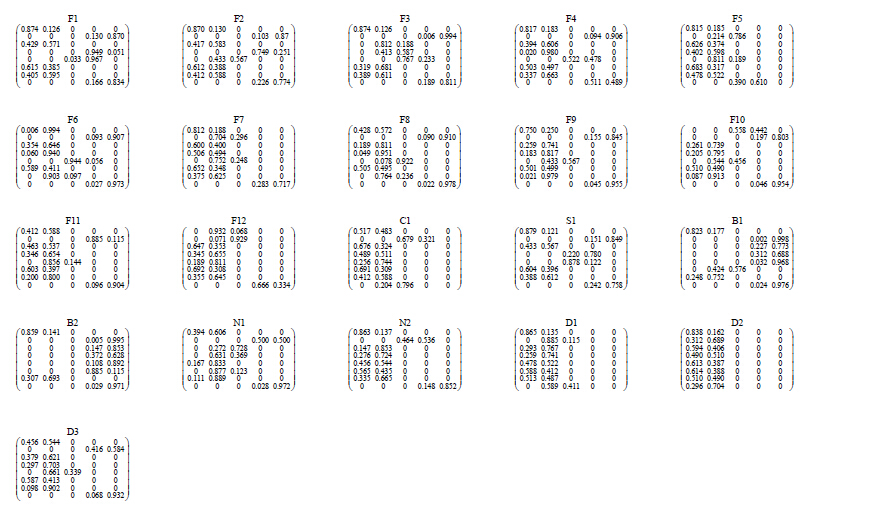
The membership represents the degree to which an evaluated and ranked object belongs to the fuzzy set (Chen and Hwang,1992) . The proportions of the various metals in the evaluation grade reflect their membership. The degrees of membership for the different metals in the surface (0-1 cm) sediments from the Nanfei River watershed are shown in Table 5,where each row corresponds to As,Cd,Cr,Cu,Hg,Ni,Pb,and Zn (from top to bottom) and each column corresponds to the assessment score (Table 1) from left to right in the membership matrix.
3.3.2 Weights of heavy metalsThe entropy method (Shannon,1948) is used for calculating weights from disordered data (Wu,1997) ,and can measure the amount of useful information in the provided data,so that the results of complex calculations are not skewed by subjective factors (Zou et al.,2006) . It is therefore an appropriate method for determining the weights for the metals. The weight values of the various metals at different sediment depths are shown in Table 6. Cd had the highest weight (>25 % in all layers) ,followed by As and Cu. With the exception of the surface sediment (0-1 cm layer) ,the weight values of these three metals accounted for up to 50 % of the overall profile. Therefore,these three metals controlled the evaluation results.
Standard FCA scores range from 0-100,and a higher score indicates better sediment quality. The FCA results are shown in Fig. 5. The scores range from 20.99 at site B1 to 89.24 at site N2,which indicates that all of the sediments have been subjected to some degree of heavy metal pollution. The highest scores were obtained from sites in the Nianbu and Dianbu Rivers,Chaohu Lake,and in the estuary of the Nanfei River. The lowest score was obtained from the Banqiao River. Tu (1990) estimated that the sediment deposition rate in Chaohu Lake was 5.6 mm/a. The sediment depth examined in this study therefore directly reflects the cumulative inputs of pollutants from the 1980s onwards,since which point,the combination of the rapid economic growth and population expansion has caused serious pollution in the Nanfei River watershed (MEPC,2008) . The sediment scores clearly show the degree of pollution at different depths,and allow us to observe changes in pollution. The scores for sites F2,F3,F10,F11,F12,N2,and B2 decreased as depth decreased,and indicate continuous accumulation of heavy metals. However,the scores for sites C1,B1,and D2 increased beyond a certain depth (4-8 cm) ,which indicates that these sites have been subject to heavy metal pollution for a long time. The scores for sites F4,F5,F6,F7,F8,and F9 were higher at the surface than at the bottom,which shows that loads of heavy metals have decreased in recent years.

|
| Figure 5 Fuzzy comprehensive assessment (FCA) scores for sites in the Nanfei watershed |
In general,the heavy metal concentrations in the sediments increase gradually from upstream to downstream in a watershed because of flow-related transport (Gruiz et al.,1998) . The pollution status is therefore usually much more severe in the lower reaches than in the upper reaches. The patterns of heavy metal pollution in the Nanfei River watershed were however quite different. FCA results indicated that there was moderate pollution in the downstream tributaries,i.e.,in the Nianbu and Dianbu Rivers. FCA results also highlighted the severe pollution of the main channel and the upstream tributaries,i.e.,the Sili and Banqiao Rivers. Surprisingly,the score at site F12,located in the estuary of the Nanfei River,was higher than the scores at sites F11 and C1. This unexpected result may be attributed to environmental dredging that has been ongoing in the area since the 1990s.
4 CONCLUSIONThe results of this study show that the mean concentrations of heavy metals in all sampled sediments of the Nanfei River watershed exceeded the average background values of both Anhui Province and China. In particular,the concentrations of As,Cd,Cr,Cu,Hg,Ni,and Zn exceeded the maximum background values of Anhui Province. Further,Cd,Cu,and Zn concentrations exceeded the maximum background values for China. The Pearson’s correlation coeffcient and the principal components loading diagram show that Hg,Cu,Cr,Cd,and Ni were closely interrelated,implying that these metals were derived from anthropogenic industrial activities. As and Pb were correlated and may come from agricultural production activities. The weight values calculated by the entropy method showed that Cd pollution was the most severe in each sediment layer. FCA results showed that the scores for most sampling sites decreased as depth decreased,indicating continuous accumulation of heavy metals in this region. Our investigation and assessment of the Nanfei River watershed shows that pollutants have been accumulating in sediments as a result of anthropogenic activities over the past 30 years.
5 ACKNOWLEDGEMENTWe are grateful to associate Professor YIN Hongbin for assisting with revision of the manuscript.
| Akinci G, Guven D E, Ugurlu S K, 2013. Assessing pollution in Izmir Bay from rivers in western Turkey:heavy metals. Environmental Science:Processes&Impacts, 15 (12) : 2252 –2262. |
| Bergbäck B, Johansson K, Mohlander U, 2001. Urban metal flows-a case study of Stockholm. Review and conclusions. Water, Air and Soil Pollution:Focus, 1 (3-4) : 3 –24. |
| Chen S J, Hwang C L. 1992. Fuzzy Multiple Attribute Decision Making. Springer, Berlin. |
| Chen S Y, Lin J G, 2001. Bioleaching of heavy metals from sediment:significance of pH. Chemosphere, 44 (5) : 1093 –1102. Doi: 10.1016/S0045-6535(00)00334-9 |
| Cheng S P, 2003. Heavy metal pollution in China:origin, pattern and control. Environmental Science and Pollution Research, 10 (3) : 192 –198. Doi: 10.1065/espr2002.11.141.1 |
| CSEPA (China State Environmental Protection Administration), CNEMC (China National Environmental Monitoring Centre), 1990. China Soil Element Background Value. Beijing, China: China Environmental Science Press330-378. |
| CSEPA(China State Environmental Protection Administration). 1995. GB 15618-1995 Environmental Quality Standard for Soils.(in Chinese) |
| Fang G H, Guo T X, Huang X F, 2010. The fuzzy comprehensive evaluation model for the carrying capacity of regional water resources. Haihe Water Resources (4) : 1 –4. |
| Feng H, Cochran J K, Lwiza H, Brownawell B J, Hirschberg D J, 1998. Distribution of heavy metal and PCB contaminants in the sediments of an urban estuary:the Hudson River. Marine Environmental Research, 45 (1) : 69 –88. Doi: 10.1016/S0141-1136(97)00025-1 |
| Förstner U, Salomons W, 1980. Trace metal analysis on polluted sediments:part I:assessment of sources and intensities. Environmental Technology Letters, 1 (11) : 494 –505. Doi: 10.1080/09593338009384006 |
| Friedman G M, Sanders J E. 1978. Principles of Sedimentology. Wiley, New York. |
| Gaur N, Flora G, Yadav M, Tiwari A, 2014. A review with recent advancements on bioremediation-based abolition of heavy metals. Environmental Science:Processes&Impacts, 16 (2) : 180 –193. |
| Gruiz K, Murányi A, Molnár M, Horváth B, 1998. Risk assessment of heavy metal contamination in Danube sediments from Hungary. Water Science and Technology, 37 (6-7) : 273 –281. Doi: 10.1016/S0273-1223(98)00208-X |
| He B, Yun Z J, Shi J B, Jiang G B, 2013. Research progress of heavy metal pollution in China:sources, analytical methods, status, and toxicity. Chinese Science Bulletin, 58 (2) : 134 –140. Doi: 10.1007/s11434-012-5541-0 |
| Hudson-Edwards K, Macklin M, Taylor M, 1997. Historic metal mining inputs to Tees river sediment. Science of the Total Environment, 194-195 : 437 –445. Doi: 10.1016/S0048-9697(96)05381-8 |
| Järup L, 2003. Hazards of heavy metal contamination. British Medical Bulletin, 68 (1) : 167 –182. Doi: 10.1093/bmb/ldg032 |
| Jong T, Parry D L, 2004. Heavy metal speciation in solid-phase materials from a bacterial sulfate reducing bioreactor using sequential extraction procedure combined with acid volatile sulfide analysis. Journal of Environmental Monitoring, 6 (4) : 278 –285. Doi: 10.1039/b316586h |
| Kazi T G, Arain M B, Jamali M K, Jalbani N, Afridi H I, Sarfraz R A, Baig J A, Shah A Q, 2009. Assessment of water quality of polluted lake using multivariate statistical techniques:a case study. Ecotoxicology and Environmental Safety, 72 (2) : 301 –309. Doi: 10.1016/j.ecoenv.2008.02.024 |
| Loska K, Wiechuła D, 2003. Application of principal component analysis for the estimation of source of heavy metal contamination in surface sediments from the Rybnik Reservoir. Chemosphere, 51 (8) : 723 –733. Doi: 10.1016/S0045-6535(03)00187-5 |
| Lu X W, Wang L J, Li L Y, Lei K, Huang L, Kang D, 2010. Multivariate statistical analysis of heavy metals in street dust of Baoji, NW China. Journal of Hazardous Materials, 173 (1-3) : 744 –749. Doi: 10.1016/j.jhazmat.2009.09.001 |
| MEPC(Ministry of Environmental Protection of the People's Republic of China), CAEP(Chinese Academy for Environmental Planning). 2000. The 10th 5-Year Planning for Prevention and Control of Water Pollution of Chaohu Lake Basin.(in Chinese) |
| MEPC(Ministry of Environmental Protection of the People's Republic of China). 2008. The Planning for Prevention and Control of Water Pollution of Chaohu Lake Basin(2006-2010).(in Chinese) |
| MEPC(Ministry of Environmental Protection of the People's Republic of China), NBSC(National Bureau of Statistics of the People's Republic of China), MAC(Ministry of Agriculture of the People's Republic of China). 2010. The First National Pollution Sources Census Bulletin.(in Chinese) |
| MEPC(Ministry of Environmental Protection of the People's Republic of China). 2011. The 12th 5-Year Planning for Comprehensive Prevention and Control of Heavy Metal Pollution.(in Chinese) |
| MEPC(Ministry of Environmental Protection of the People's Republic of China). 2013. China Environmental Situation Bulletin in 2012.(in Chinese) |
| Miller C V, Foster G D, Majedi B F, 2003. Baseflow and stormflow metal fluxes from two small agricultural catchments in the Coastal Plain of the Chesapeake Bay Basin, United States. Applied Geochemistry, 18 (4) : 483 –501. Doi: 10.1016/S0883-2927(02)00103-8 |
| Nriagu J O, Kemp A L, Wong H K T, Harper N, 1979. Sedimentary record of heavy metal pollution in Lake Erie. Geochimica et Cosmochimica Acta, 43 (2) : 247 –258. Doi: 10.1016/0016-7037(79)90243-6 |
| Rawat M, Moturi M C Z, Subramanian V, 2003. Inventory compilation and distribution of heavy metals in wastewater from small-scale industrial areas of Delhi, India. Journal of Environmental Monitoring, 5 (6) : 906 –912. Doi: 10.1039/b306628b |
| Reid M K, Spencer K L, 2009. Use of principal components analysis(PCA)on estuarine sediment datasets:the effect of data pre-treatment. Environmental Pollution, 157 (8) : 2275 –2281. |
| Santschi P, Höhener P, Benoit G, Buchholtz-ten Brink M, 1990. Chemical processes at the sediment-water interface. Marine Chemistry, 30 : 269 –315. Doi: 10.1016/0304-4203(90)90076-O |
| Shannon C E, 1948. A mathematical theory of communication. Bell System Technical Journal, 27 (3) : 379 –423. Doi: 10.1002/bltj.1948.27.issue-3 |
| Singh M, Ansari A A, Müller G, Singh I B, 1997. Heavy metals in freshly deposited sediments of the Gomati River(a tributary of the Ganga River):effects of human activities. Environmental Geology, 29 (3-4) : 246 –252. Doi: 10.1007/s002540050123 |
| Singh M, 2001. Heavy metal pollution in freshly deposited sediments of the Yamuna River(the Ganges River tributary):a case study from Delhi and Agra urban centres, India. Environmental Geology, 40 (6) : 664 –671. Doi: 10.1007/s002549900091 |
| Stigliani W M, Doelman P, Salomons W, Schulin R, Smidt G R B, van der Zee S E A T M, 1991. Chemical time bombs:predicting the unpredictable. Environment:Science and Policy for Sustainable Development, 33 (4) : 4 –30. Doi: 10.1080/00139157.1991.9931383 |
| Teasdale P R, Apte S C, Ford P W, Batley G E, Koehnken L, 2003. Geochemical cycling and speciation of copper in waters and sediments of Macquarie Harbour, Western Tasmania. Estuarine, Coastal and Shelf Science, 57 (3) : 475 –487. Doi: 10.1016/S0272-7714(02)00381-5 |
| Tu Q Y, 1990. The Chaohu Lake-Study on Eutrophication. Hefei: Press of University of Science and Technology of China63-64. |
| USEPA(United States Environmental Protection Agency). 1995. Method 3052:Microwave Assisted Acid Digestion of Siliceous and Organically Based Matrices. Test Methods for Evaluating Solid Waste. United States Environmental Protection Agency. |
| Wang H Y, 2002. Assessment and prediction of overall environmental quality of Zhuzhou City, Hunan Province, China. Journal of Environmental Management, 66 (3) : 329 –340. Doi: 10.1016/S0301-4797(02)90590-6 |
| Wu N L. 1997. The Maximum Entropy Method. Springer, Berlin. 327p. |
| Yi Y J, Yang Z F, Zhang S H, 2011. Ecological risk assessment of heavy metals in sediment and human health risk assessment of heavy metals in fishes in the middle and lower reaches of the Yangtze River basin. Environmental Pollution, 159 (10) : 2575 –2585. Doi: 10.1016/j.envpol.2011.06.011 |
| Zadeh L A, 1965. Fuzzy sets. Information and Control, 8 (3) : 338 –353. Doi: 10.1016/S0019-9958(65)90241-X |
| Zan F Y, Huo S L, Xi B D, Su J, Li X, Zhang J T, Yeager K M, 2011. A 100 year sedimentary record of heavy metal pollution in a shallow eutrophic lake, Lake Chaohu, China. Journal of Environmental Monitoring, 13 (10) : 2788 –2797. Doi: 10.1039/c1em10385g |
| Zheng L G, Liu G J, Kang Y, Yang R K, 2010. Some potential hazardous trace elements contamination and their ecological risk in sediments of western Chaohu Lake, China. Environmental Monitoring and Assessment, 166 (1-4) : 379 –386. Doi: 10.1007/s10661-009-1009-3 |
| Zou Z H, Yun Y, Sun J N, 2006. Entropy method for determination of weight of evaluating indicators in fuzzy synthetic evaluation for water quality assessment. Journal of Environmental Sciences, 18 (5) : 1020 –1023. Doi: 10.1016/S1001-0742(06)60032-6 |