 2016, 34
Institute of Oceanology, Chinese Academy of Sciences
Article Information
- Peng ZHAO(赵鹏), Wenjie GONG(龚文杰), Guohua MAO(毛国华), Jige LI(李继革), Fenfen XU(徐奋奋), Jiawei SHI(施家威)
- Pollution of HCHs, DDTs and PCBs in tidal flat of Hangzhou Bay 2009-2013
- Journal of Oceanology and Limnology, 34(3): 539-548
- http://dx.doi.org/10.1007/s00343-016-4384-y
Article History
- Received: Jan. 5, 2015
- Accepted: Mar. 4, 2015


2. Cixi Center for Disease Control and Prevention, Ningbo 315300, China;
3. Ningbo Municipal Center for Disease Control and Prevention, Ningbo 315010, China
For many years,persistent organic pollutants (POPs) have been widely applied for agricultural (as insecticide) and industrial purposes. Numerous by- product pollutants result from industrial production processes. The presence of POPs in the environment has been extensively investigated. Broadly,POPs are chemical substances that persist in the environment,bioaccumulate in food chains,and adversely affect human health and the environment (Tan et al.,2008) . In addition,POPs are a regional and global environmental issue due to their propensity for transboundary transportation. Previous studies regarding POPs have focused on POPs in coastal sediments,soils and other environmental compartments and agents (Mangani et al.,1991; Iwata et al.,1994) . Coastal sediments are an important reservoir of historical information regarding the source,distribution,migration and transformation of numerous pollutants. Therefore,coastal sediments represent an optimal tool for tracking ocean pollution. In particular,intertidal zones are highly active zones that are exposed to interactions between the land and the ocean,and are hence fragile ecological zones that support multiple functions,interfaces,and processes (Lubchenco and Menge,1978; Zhao et al.,2010) .
Hangzhou Bay is an estuarine bay with a horn-like mouth,located in the northeastern portion of Zhejiang Province,China. It belongs to the subtropical zone enjoying a monsoon climate,the rainfall is relatively high and concentrate in the period of March to September. The high temperature season is from July to October,due to adjustment of the oceanic air current,the tempearature is a litter lower at the outside of mouth than the inside. The East China Sea is located to the east of the bay,which divides the adjacent coastal wetlands into northern and southern portions. The southern portion is a silted tidal flat to which a large area of wetland is added every year. Meanwhile,because of the level of economic development,this area is undergoing continuous reclamation. In this study,we collected sediments from coastal wetlands of Hangzhou Bay to investigate their planar distribution and temporal variation,as well as their sources of historically accumulated hexachlorocyclohexanes (HCHs) ,dichlorodiphe-nyltrichloroethanes (DDTs) and polychlorinated biphenyls (PCBs) .
2 MATERIAL AND METHOD 2.1 Sample collection and pretreatmentA global positioning system (GPS) approach was used to select 7 sites from west to east along the tidal flats of the wetlands in the southern portion of Hangzhou Bay,which were monitored from 2009 to 2013 (Fig. 1) . The sampling sites designated as a,b,c and d are tidal flats that formed after reclamation within the last 20 years. The population density in this area is high,the economy is relatively well developed,and many aquaculture farms are present. The sampling sites designated as e,f,and g are tidal flats that formed naturally without reclamation and are located in areas of low population density. Surface sediments (0-5 cm) were collected at each sampling site,wrapped in aluminum foil,placed into a cooler,and maintained at a temperature of less than -20°C for storage in the lab. The samples were freeze-dried,ground,and passed through an 80-mesh sieve (0.18 mm) before analysis.

|
| Figure 1 Sampling locations in Hangzhou Bay |
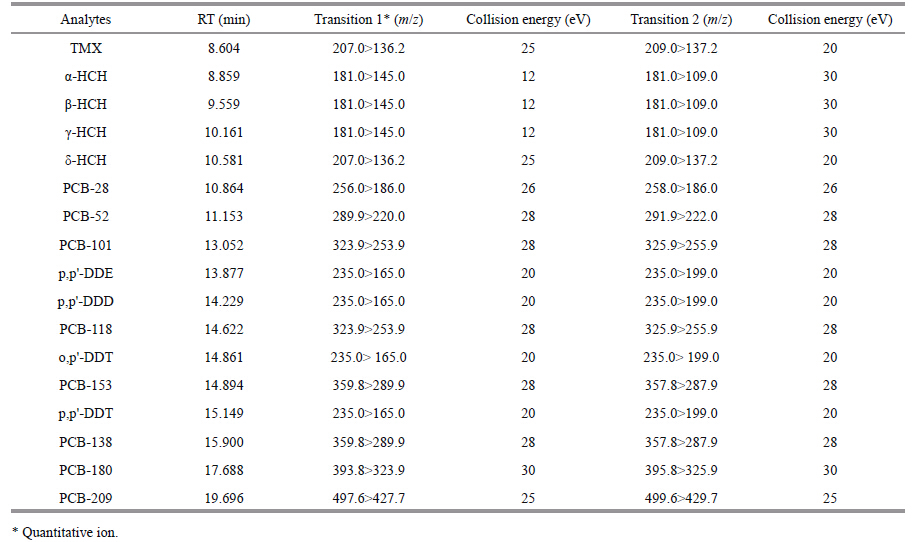
According to US EPA methods EPA8080A,EPA8081B,and EPA3550B,a GC/MS/MS method was used to quantify 4 isomers of HCHs (α-HCH,β-HCH,γ-HCH and δ-HCH) ,4 components of DDTs (p,p'-DDT,o,p'-DDT,p,p'-DDE and p,p'-DDD) and 7 congeners of PCBs (PCB-28,PCB-52,PCB-101,PCB-118,PCB-138,PCB-153 and PCB-180) .
2.2.1 Sample pretreatmentFor pretreatment,200 ng of 2,4,5,6-tetrachloro-m- xylene (TMX) and 10 ng of polychlorinated biphenyls (PCB209) were added to each 15-g sediment sample as internal standards. Then,the sediment samples were extracted using a Soxhlet extractor with 250 mL of a hexane/acetone (1:1,v/v) solution. Soxhlet extraction was performed for 24 hours in a water bath at 57°C to 59°C. After this extraction step,subsamples from the Soxhlet extraction were concentrated using rotary evaporation at a reduced pressure to approximately 2 mL. Then,5 mL of n-hexane was added to each concentrated sample,which was then further concentrated to approximately 1 mL using rotary evaporation to achieve solvent substitution.
The concentrate was transferred into a ProElut Florisil solid phase extraction (SPE) column (Florisil,5 g,20 mL) that was pre-activated with 2 mL of n-hexane. Next,the column and concentrate were equilibrated for 5 min to ensure that the concentrate fully contacted the column. Then,5 mL of diethyl ether/n-hexane (6:94,v/v) was used to wash the rotary- evaporated bottle twice and then transferred into the column. Next,25 mL of diethyl ether/n-hexane (6:94,v/v) was used to leach the SPE column. All of the eluent was collected and dried using rotary evaporation. Finally,the dried sample was dissolved in 1 mL of n-hexane and set aside for later use.
2.2.2 MeasurementThe samples were analyzed using an Agilent 7000B Triple Quadrupole gas chromatograph/gas chromatograph-mass spectrometer. The chromatographic column was an Agilent DB-35 ms (30 m × 0.25 mm × 0.25 μm) . The following operating conditions were used: the temperature of the injection port was 260°C; constant pressure mode was used with a pressure of 23.883 psi; the carrier gas was He at 99.999%; the ion source temperature was 230°C; the IE energy was 70 eV; the quadrupole rod temperature was 150°C; the mass spectrum connector temperature was 280°C; the collision gas flow velocity was 1.5 mL/min (N2) ; the analytical mode was conducted using multiple reaction monitoring (MRM) (Table 1) ; the column temperature was initially held at 70°C for 2 min,increased to 150°C at a rate of 25°C/min,increased to 200°C at a rate of 3°C/min,and finally increased to 280°C at a rate of 8°C/min and maintained for 10 min; and the injection volume was 2 μL. TMX was used as the internal standard for OCPs,and PCB209 was used as the internal standard for PCBs.
|
To evaluate the accuracy and recovery of the extraction method,surface sediments were collected from tidal flat areas of a wetland in the south bank of Hangzhou Bay for a preliminary test. The procedure used was as follows: To each sediment sample (15 g each) ,10.0 ng of the target compound was added and allowed to equilibrate for 24 h. Then,the extraction,purification,and measurement of the target compounds were conducted according to the method described in Section 1.2. The recovery rates for the HCH,DDT and PCB standards were 76.3%-106.3%,72.3%-96.2% and 66.4%-117.1%,respectively,and their relative standard deviations were less than 12%. Hence,all of the results met the requirements of the US EPA method standards.
To control the contamination during the extraction and separation process,a method blank test was conducted before the sample analysis. The quantity of the target compound was below the detection limit. During sample analysis,1 method blank was analyzed every 10 samples,and the detection limit was 3 times greater than the signal to noise ratio. The detection limits for the HCH,DDT and PCB analyses were 0.01- 0.04 μg/kg,0.04-0.10 μg/kg and 0.007-0.011 μg/kg,respectively.
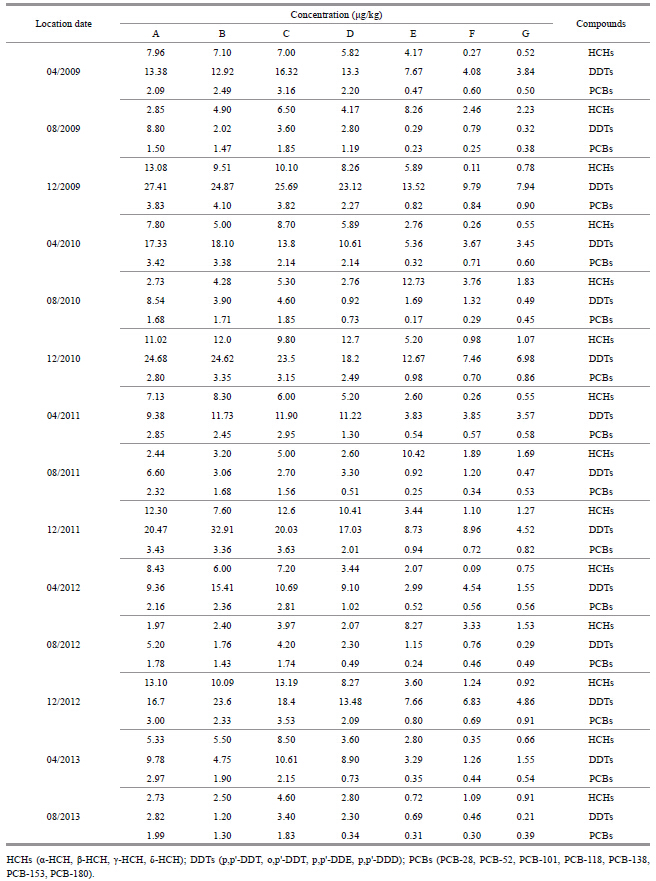
3 RESULTThe total residue concentrations of HCHs,DDTs and PCBs were determined for all 98 samples,collected at 14 time points from 7 sampling sites between April 2009 and August 2013 (Table 2) .
|
The mean HCH concentration was 4.33 μg/kg,and the highest concentration was 13.19 μg/kg,which was recorded at site C in December 2012. From west to east,the concentration increased and then decreased (Fig. 2a) . Regarding the spatial distribution,the mean concentration in sediment was the lowest at F (1.10 μg/kg) and the highest at C (7.74 μg/kg) . In terms of seasonal temporal variation,the highest mean concentration (7.29 μg/kg) occurred in December,followed by April (4.12 μg/kg) ,with the lowest concentration occurring inAugust (2.18 μg/kg) . From 2009 to 2013,the HCH concentration decreased slightly (Fig. 2b) .

|
| Figure 2 Spatial and temporal variation of HCHs |
Regarding HCH isomers,the detection rate of α-HCH was 100%,and the detection rates of the other HCHs were 30.9%-87.5%. The proportion of HCHs attributed to α-HCH was greater than 57% in all sediment samples.
3.2 Pollution levels and distribution characteristics of DDTsThe DDT pollution was clearly more severe than the HCH pollution. The mean DDT concentration was 8.50 μg/kg,and the highest DDT concentration of 32.91 μg/kg was recorded at site B in December 2011. Similar to the distribution of HCHs,DDT concentrations varied considerably among the 7 sampling sites. From west to east,the pollution level increased and then decreased (Fig. 3a) . Regarding the spatial distribution,the mass fraction was the lowest (2.86 μg/kg) at G and the highest (12.92 μg/kg) at B. In terms of seasonal temporal variation,the highest mean concentration (16.21 μg/kg) occurred in December,followed by April (8.37 μg/kg) ,with the lowest mean concentration (2.43 μg/kg) occurring in August. From 2009 to 2013,the pollution levels of DDTs decreased gradually (Fig. 3b) .

|
| Figure 3 Spatial and temporal variation of DDTs |
For all of the samples,the detection rate of p,p'- DDE was 100%. The detection rates of o,p'-DDT and p,p'-DDD were 84.4%-89.1%,and the detection rate of p,p'-DDT was 17.2% (the lowest observed ratio) . Among the samples,the proportion of average concentration of p,p'-DDT was the lowest,only accounting for 1% of the DDTs; the proportion of average concentration of p,p'-DDE was the highest,contributing more than 89%.
3.3 Pollution level and distribution characteristics of PCBsSeven congeners,including PCB-28,PCB-52,PCB-101,PCB-118,PCB-138,PCB-153 and PCB- 180,were measured to evaluate the pollution level of PCBs. The pollution by PCBs was less severe than the contamination by HCHs and DDTs. The mean PCB concentration was 1.51 μg/kg,and the highest value was 4.10 μg/kg,which was recorded at site B in December 2009. No apparent differences in PCB pollution levels were observed among sites A,B and C in the west. However,the PCB concentrations at these sites were clearly greater than those at E,F and G,and the concentrations at D were intermediate. The spatial distribution of PCBs was the opposite of those observed for HCHs and DDTs. (Fig. 4a) . The mean concentration was the lowest at E (0.50 μg/kg) and the highest at C (2.58 μg/kg) . In terms of seasonal temporal variation,the trend was similar to those for HCHs and DDTs from 2009 to 2013 (Fig. 4b) .

|
| Figure 4 Spatial and temporal variation of PCBs |
Across all of the samples,the high detection rates for PCB-118,PCB-138,and PCB-180 were 96.9%,85.9%, and 84.4%, respectively. PCB-118, PCB-138 and PCB-180 accounted for 74.3% of the total PCB concentration.
4 DISCUSSION 4.1 Analysis of the compositional characteristics and sources of HCHs and DDTsAccording to previous research,HCHs have been identified as the main form of global organochlorine pollutants. The ratio between α-HCH and γ-HCH is often used as an indicator of pollutant source (Davidson et al.,2003) . Generally,two types of HCH products have been used as pesticides. Industrial HCH is a multi-space congener compound that contains 55%-80% α-HCH,5%-14% β-HCH,8%-15% γ-HCH,and 2%-16% δ-HCH,with an α/γ-HCH ratio of 4-15. The other HCH product is lindane,which is dominated by γ-HCH,with a content of up to 99%; the α/γ-HCH ratio remains lower than 0.1. It has been generally acknowledged that if the α/γ-HCH ratio in a sample is between 4 and 7,then the HCH components in the sample resulted from industrial products. If the α/γ-HCH ratio is greater than 7,the HCHs potentially resulted from remote atmospheric transport (Law et al.,2001) . In addition,the degradation rates of these 4 isomers in the sediments are different. The β-HCH isomer is the most stable,and a high value of β-HCH indicates historical pollution. The α/γ-HCH ratio ranged from 5.82 to 23.75 across the sampling sites (Table 3) . These values are higher than α/γ-HCH ratios (0.2-1.0) reported for the atmosphere of North America,where lindane is used,but are similar to the atmospheric α/γ- HCH ratios (6.1-14.2) reported for western mountainous areas along the Atlantic coast of Canada (Shen et al.,2004) . Meanwhile,the average concentration of β-HCH accounts for 12%-20% of the total HCHs (Table 3) ,which is greater than the proportion of β-HCH found in industrial HCHs. Therefore,the results indicate that the source of HCH pollution in the tidal flat sediments located in the southern bank of Hangzhou Bay was remote transmission and that the impacts of remote atmospheric transmission are substantially greater at the marine outfall.

|
Industrial DDT consists of 77.0% p,p'-DDT,14.9% o,p'-DDT,and 4.0% p,p'-DDE. Residual DDT in the sediment is converted into DDD under anaerobic conditions or to DDE under aerobic conditions. Therefore,the DDD/DDE ratio is indicative of degradation conditions (Guenzi and Beard,1967) . If DDD/DDE>1,anaerobic decomposition dominates the degradation of DDTs. Otherwise,aerobic decomposition is the dominant process. When new and recent inputs of DDT have occurred,the DDD + DDE content can be either low or high (Hong et al.,1999; Purnomo et al.,2011) . Therefore,the ratio (DDD + DDE) / DDTs is often used to determine the source and form of degradation of DDT. If (DDD + DDE) / DDTs is greater than 0.5,the DDTs in the environment potentially resulted from historical residues. In contrast,if (DDD + DDE) / DDTs is lower than 0.5,recent inputs of DDT have occurred (Wang et al.,2010) .
Similar to results reported for a sewage treatment plant in Hong Kong (Zhou et al.,1999) ,the contribution of p,p,-DDE to total DDT was greater than 89% for the tidal flat sediments in the south bank of Hangzhou Bay (Table 3) . The DDD/DDE ratio was less than 0.10 at all of the sampling sites,and the (DDD + DDE) / DDTs ratio was greater than 0.93. Hence,aerobic decomposition is the dominant process of DDT degradation in this tidal flat environment,and no new DDT inputs have recently occurred in this area. Instead,the presence of DDT is attributed to historical residuals.
The HCH and DDT content in the sediments of Hangzhou Bay was lower than values in other areas (Table 4) and decreased in samples from closer to the estuary. The occurrence and deposition of numerous suspended particles in Hangzhou Bay diluted the organic pollutant levels in the surface sediments,which were similar to those observed in the Changjiang River estuary (Chen et al.,2003) . Regarding sample pollutant levels,the mean measured concentrations of DDT were greater than the mean HCH concentrations,which was attributed to differences in the migration and transformation of these classes of compounds. Furthermore,DDTs are lipid-soluble and are readily absorbed by organic matter in sediments. The water solubility and saturated vapor pressure of HCHs are higher than those of DDTs. Thus,HCHs are more readily dispersed in the atmosphere or in water. Therefore,the DDT content in sediment was greater than the sediment HCH content.

|
As shown in Table 4,the pollutant concentrations measured in this study were similar to values observed at other domestic and international locations. To explore the relationships among the evaluated pollutants,a correlation analysis was conducted for the spatial distribution. The results demonstrate that the distributions of the average concentration of DDTs and HCHs were highly correlated (R=0.839) . The DDTs and HCHs in this area likely originated from the same pollution source.
4.2 Analysis of compositional characteristics and PCB sourcesGenerally,PCBs are historical organic pollutants that were once extensively used as industrial products. Among the 7 sampling sites,a large number of dyeing and printing factories and waste recycling companies were located at site D from the 1980s to the beginning of the 2000s. When the government established an economic development zone at A at the beginning of the 2000s,a number of these enterprises moved from D to A. The presence of these industries explains the greater ∑PCB pollution levels at A and D compared with the other sampling sites. Table 4 includes a comparison of the average concentration of PCBs in the sediments at this study with values obtained at locations overseas. The average concentration of PCBs measured in the sediments from our research area were lower than those from other areas,except Xiamen. Regarding PCB congeners,the mean concentrations of PCB-118,PCB-138 and PCB-180 were the highest,and PCB-118,PCB-138 and PCB-180 accounted for 74.3% of the total PCB concentration.
To identify the source of PCBs in the sediments in his area,the PCB composition in terms of the relative proportions of the 7 PCB congeners in the surface sediment samples were compared with the compositions of the PCBs used in China,including No. 1 PCBs (transformer oil) ,Aroclor 1242 (Lot A3) and Aroclor 1254 (Lot A4) (Wu et al.,2011) . The PCB-118 content was used as the standard when calculating the relative values of the other 6 indicator PCBs (Table 5) . The results demonstrated that the relative proportions of PCBs in the tidal fl at sediments from Hangzhou Bay were correlated with the PCBs congeners content of Aroclor 1254 (Lot A4) (R=0.592) . Meanwhile, in Aroclor 1254 (Lot. A4) , the main congeners were PCB-118 and PCB-138 (Frame et al.,1996) ,it was the similar with the results in the tidal flat sediments from Hangzhou Bay. We also found that high-chlorinated biphenyls were the main components in this area. Thus these could be used to predict PCBs pollution primarily originated from Aroclor 1254 (Lot A4) ,which might root in the illegal demolition and stacking of abandoned paint,transformer or electronic equipment.
4.3 Seasonal changes in HCH,DDT and PCB contentAs shown in Figs. 2b,3b and 4b,the annual variations observed in HCH,DDT and PCB content presented similar features,with a peak appearing in December,followed by a peak in April. The lowest concentrations were observed in August. This annual variation was probably caused by variations in temperature (in winter (December) ,when the temperature is low,organic pollutants do not volatilize rapidly,and in spring and summer (April and August) ,organic pollutants are volatized rapidly) and by the occurrence of rainfall during the spring and summer,which accelerates the dilution of the pollutants. In addition,given the site’s location at 30°N latitude in the Northern Hemisphere,variations in sunlight,with increased sunlight in the spring and summer,might cause these annual variations in HCH degradation.
5 CONCLUSIONHCHs,DDTs and PCBs are typical POPs that reside in marine sediments. Substantial differences were observed in the pollution levels of HCHs,DDTs and PCBs among the 7 sampling sites. However,these pollutants were detected at low mean concentrations in the sediments of this study area. The HCH pollution in the tidal flat sediments of the south bank of Hangzhou Bay originated from historical industrial pollution,while the impacts of the remote atmospheric transmission of HCH were considerably greater for marine outfall. Aerobic decomposition was the dominant process for DDT degradation in the local tidal flat environment. No recent DDT inputs have occurred,and the DDT was mainly associated with historical residues. The DDT and HCH present potentially originated from the same pollution source. In addition,the PCBs pollution potentially originated from Aroclor 1254 (Lot A4) . The surrounding recycling companies and printing factories have an enormous influence on the pollution levels of PCBs in this area.
| Chen M R, Yu L Z, Xu S Y, Feng K, Han X F, 2003. Spatial distribution of polychlorinated biphenyls(PCBs)contaminants in the tidal-flat sediments of Yangtze Estuary. Marine Science Bulletin, 5 (2) : 22 –28. |
| Davidson D A, Wilkinson A C, Blais J M, Kimpe L E, McDonald K M, Schindler D W, 2003. Orographic coldtrapping of persistent organic pollutants by vegetation in mountains of western Canada. Environ. Sci. Technol., 37 (2) : 209 –215. Doi: 10.1021/es020605q |
| Frame G M, Cochran J W, Bøwadt S S, 1996. Complete PCB congener distributions for 17 aroclor mixtures determined by 3 HRGC systems optimized for comprehensive, quantitative, congener-specific analysis. J. High Resol. Chromatogr., 19 (12) : 657 –668. Doi: 10.1002/(ISSN)1521-4168 |
| Glynn P W, Rumbold D G, Snedaker S C, 1995. Organochlorine pesticide residues in marine sediment and biota from the northern Florida reef tract. Mar. Pollut. Bull., 30 (6) : 397 –402. Doi: 10.1016/0025-326X(94)00206-O |
| Guenzi W D, Beard W E, 1967. Anaerobic biodegradation of DDT to DDD in soil. Science, 156 (3778) : 1116 –1117. Doi: 10.1126/science.156.3778.1116 |
| Hong H S, Chen W Q, Xu L, Wang X H, Zhang L P, 1999. Distribution and fate of organochlorine pollutants in the Pearl River Estuary. Mar. Pollut. Bull., 39 (1-12) : 376 –382. Doi: 10.1016/S0025-326X(99)00081-8 |
| Hong H, Xu L, Zhang L, Chen J C, Wong Y S, Wan T S M, 1995. Special guest paper:environmental fate and chemistry of organic pollutants in the sediment of Xiamen and Victoria Harbours. Mar. Pollut. Bull., 31 (4-12) : 229 –236. Doi: 10.1016/0025-326X(95)00115-4 |
| Iwata H, Tanabe S, Sakai N, Nishimura A, Tatsukawa R, 1994. Geographical distribution of persistent organochlorines in air, water and sediments from Asia and Oceania, and their implications for global redistribution from lower latitudes. Environ. Pollut., 85 (1) : 15 –33. Doi: 10.1016/0269-7491(94)90234-8 |
| Khim J S, Lee K T, Kannan K, Villeneuve D L, Giesy J P, Koh C H, 2001. Trace organic contaminants in sediment and water from Ulsan Bay and its vicinity, Korea. Arch. Environ. Con. Tox., 40 (2) : 141 –150. Doi: 10.1007/s002440010157 |
| Law S A, Diamond M L, Helm P A, Jantunen L M, Alaee M, 2001. Factors affecting the occurrence and enantiomeric degradation of hexachlorocyclohexane isomers in northern and temperate aquatic systems. Environ. Tox. Chem., 20 (12) : 2690 –2698. Doi: 10.1002/etc.v20:12 |
| Li H, Fu Y Z, Zhou C G, Xu H Z, 1998. Distribution characteristics of organic chlorine pesticide and PCB in the surface sediments in Dalian Bay and Jinzhou Bay. Mar. Environ. Sci., 17 (2) : 73 –76. |
| Liu W X, Chen J L, Lin X M, Tao S, 2006. Distribution and characteristics of organic micropollutants in surface sediments from Bohai Sea. Environ. Pollut., 140 (1) : 4 –8. Doi: 10.1016/j.envpol.2005.08.074 |
| Lubchenco J, Menge B A, 1978. Community development and persistence in a low rocky intertidal zone. Ecol. Monogr., 48 (1) : 67 –94. Doi: 10.2307/2937360 |
| Mangani F, Crescentini G, Sisti E, Bruner F, Cannarsa S, 1991. PAHs, PCBs and chlorinated pesticides in Mediterraneal coastal sediments. Int. J. Environ. An. Ch em., 45 (2) : 89 –100. Doi: 10.1080/03067319108026979 |
| Purnomo A S, Mori T, Kamei I, Kondo R, 2011. Basic studies and applications on bioremediation of DDT:a review. Int. Biodeter. Biodegr., 65 (7) : 921 –930. Doi: 10.1016/j.ibiod.2011.07.011 |
| Shen L, Wania F, Lei Y D, Teixeira C, Muir D C G, Bidleman T F, 2004. Hexachlorocyclohexanes in the North American atmosphere. Environ. Sci. Technol., 38 (4) : 965 –975. Doi: 10.1021/es034998k |
| Tan J, Loganath A, Chong Y S, Obbard J P, 2008. Persistent organic pollutants in human blood:a review of global data with a comparison to the Singapore population. Toxicol. Environ. Chem., 90 (5) : 837 –859. Doi: 10.1080/02772240701699179 |
| U. S. Environmental Protection Agency:Method 3550C Ultrasonic Extraction. EPA. 2007. Accessed at http://www3.epa.gov/epawaste/hazard/testmethods/sw846/pdfs/3550c.pdf. |
| U. S. Environmental Protection Agency:Method 8081B Organochlorine Pesticides by Gas Chromatography. EPA.2007. Accessed at http://www3.epa.gov/epawaste/hazard/testmethods/sw846/pdfs/8081b.pdf. |
| U. S. Environmental Protection Agency:Method 8082A Polychlorinated Biphenyls(PCBs)by Gas Chromatography). EPA. 2007. Accessed at http://www3.epa.gov/epawaste/hazard/testmethods/sw846/pdfs/8082a.pdf. |
| Wang J T, Tan L J, Zhang W H, Lian Z R, 2010. Concentrations and distribution characteristic of PAHs, PCBs and OCPs in the surface sediments of Qingtao coastal area. Environ. Sci., 31 (11) : 2713 –2722. |
| Wu S, Xia X H, Yang L Y, Liu H, 2011. Distribution, source and risk assessment of polychlorinated biphenyls(PCBs)in urban soils of Beijing, China. Chemosphere, 82 (5) : 732 –738. Doi: 10.1016/j.chemosphere.2010.10.090 |
| Zhang K, Zhang B Z, Li S M, Zeng E Y, 2011. Regional dynamics of persistent organic pollutants(POPs)in the Pearl River Delta, China:implications and perspectives. Environ. Pollut., 159 (10) : 2301 –2309. Doi: 10.1016/j.envpol.2011.05.011 |
| Zhang Y B, Lin H, 2004. Concentrations and distributions of DDTs, HCHs and PCBs in surface sediments of Xiamen sea areas. Journal of Oceanography in Taiwan Strait, 23 (4) : 423 –428. |
| Zhao X R, Zheng B H, Qin Y W, Jiao L X, Zhang L, 2010. Grain size effect on PBDE and PCB concentrations in sediments from the intertidal zone of Bohai Bay, China. Chemosphere, 81 (8) : 1022 –1026. Doi: 10.1016/j.chemosphere.2010.09.007 |
| Zhou H Y, Cheung R Y H, Wong M H, 1999. Residues of organochlorines in sediments and tilapia collected from inland water systems of Hong Kong. Arch. Environ. Con. Tox., 36 (4) : 424 –431. Doi: 10.1007/PL00006615 |