 2016, 34
Institute of Oceanology, Chinese Academy of Sciences
Article Information
- Fuwen QIU(丘福文), Aijun PAN(潘爱军), Shanwu ZHANG(张善武), Jing CHA(查晶), Haowei SUN(孙豪为)
- Sea surface temperature anomalies in the South China Sea during mature phase of ENSO
- Journal of Oceanology and Limnology, 34(3): 577-584
- http://dx.doi.org/10.1007/s00343-016-4290-3
Article History
- Received: Nov. 24, 2014
- Accepted: Feb. 19, 2015


The South China Sea (SCS) is one of the largest tropical marginal seas in the world,which is connected to the western Pacific Ocean via the Luzon Strait and to the Sulu Sea via the Mindoro Strait (Fig. 1) . The upper circulation within the SCS is characterized by a strong seasonal cycle,which is associated with monsoonal winds that are southwesterly in summer and northeasterly in winter. The seasonal variability of the sea surface temperature (SST) in the SCS has been documented in previous studies (Chu et al.,1997) . There are two dominant seasonal features of SST in the SCS: a cold filament and basin-wide mid-summer cooling associated with the wind jet offshore to the southeast of Saigon (Xie et al.,2003) ,and a distinct cold tongue in the winter SST climatology related to cold-water advection induced by the western boundary current (Liu et al.,2004) .
The El Niño/Southern Oscillation (ENSO) originates in the equatorial Pacific Ocean and modulates global climate on an interannual time scale. Previous studies have suggested that the Walker and Hadley circulations can serve as an atmospheric bridge that transmits ENSO signals to the tropical oceans (Klein et al.,1999) . As an Asian marginal sea,the SCS is largely influenced by the ENSO and it exhibits remarkable interannual variability (Fang et al.,2006; Wang et al.,2006) . During the mature ENSO warm phase,the East Asian winter monsoon becomes weaker. Consistent with this monsoonal anomaly,the SCS generally exhibits weakened circulatory gyres and warming of the SST (Klein et al.,1999; Wang and Zhang,2002; Xie et al.,2003; Qu et al.,2004; Fang et al.,2006; Wang et al.,2006) . Klein et al. (1999) reported that SST variability in the SCS lagged the ENSO index by 5 months,whereas Fang et al. (2006) found that the first empirical orthogonal function (EOF) of SST lagged the Niño3.4 index by about 8 months,characterized by basin-wide warming.

|
| Figure 1 Map of the South China Sea |
The interannual variability of the upper ocean heat content in the SCS also demonstrates good correspondence with ENSO events but with the opposite phase (Yan et al.,2010) . Chao et al. (1996) studied the effects on the SCS of the 1982-1983 El Niño. They found that the anomalously high heat content in the SCS from 1982-1983 was caused primarily by weak surface circulation rather than by the decrease in latent heat flux. However,Qu et al. (2004) highlighted that transport via the Luzon Strait is the most important process for conveying the impact of the ENSO to the SCS. The reductions of the western boundary current and of its thermal advection under the weak winter monsoon during an El Niño event result in a warming of the SCS winter cold tongue (Liu et al.,2004) . During an El Niño event,SST anomalies in the SCS show a double-peak evolution (Wang et al.,2006) . The first peak appears during the mature phase of the El Niño because of the reduction in cloud coverage and the increase of the net shortwave radiation flux (Du et al.,2009) . The second peak occurs in the year subsequent to the El Niño,and it is mainly affected by the weakening of the southwest monsoon (Xie et al.,2009) . Recent studies (Wu et al.,2014) have suggested that the observed SST anomalies of the SCS in the boreal summer are related mainly to shortwave radiation and latent heat flux anomalies,as well as meridional advection and vertical upwelling processes near the south coast of the Indochina Peninsula,during the decaying years of an ENSO episode. The variability of the East Asian winter monsoon,independent of ENSO episodes,plays a significant role in the SST anomalies of the SCS during January-March. In addition,the SST anomalies of the SCS show distinct asymmetry after the mature phase of El Niño/La Niña,which is more robust during El Niño than during La Niña (Huang et al.,2013) .
The abovementioned studies have revealed the close relationship between SST in the SCS and the ENSO,but they have focused mainly on the SST variability during the decaying phase of an ENSO event or have used low-resolution data. Currently,the spatial patterns of SSTAs in the SCS during the mature phase of ENSO are not clear. The availability of long-term time series and high-resolution SST data make it possible to perform an integrated analysis to establish the spatial distribution characteristics of SSTAs in the SCS during the mature phase of ENSO events. In this study,we investigated the SSTAs in the SCS during the mature phase of ENSO and here,we discuss some possible mechanisms for the anomalous features.
2 DATA AND METHODThe SST dataset used in the present study was the monthly National Centers for Environmental Prediction (NCEP) optimum interpolation (OI) SST analysis product,which has 1/4°×1/4° resolution. This dataset merges satellite and in situ SST observations using the OI method (Reynolds and Smith,1994) . Monthly mean data with 0.5°×0.5° resolution,obtained from the simple ocean data assimilation (SODA) dataset (Carton et al.,2000a,2000b; Carton and Giese,2008) were used for the heat budget calculation. Monthly sea surface wind,outgoing longwave radiation (OLR) ,and sea level pressure (SLP) data with 2.5°×2.5° spatial resolution,obtained from the NCEP National Center for Atmospheric Research (NCEP-NCAR) (Kalnay et al.,1996) were also used to study the air-sea interaction in the SCS. The monthly anomalies of surface geostrophic velocity were computed from monthly sea level anomaly data,which comprise the (1/3°×1/3°) Mercator-gridded products of TOPEX/ Poseidon (T/P) ,ERS-1/2,and Jason-1 SLA provided by the Archiving Validation and Interpretation of Satellite Data in Oceanography (AVISO) . The altimeter products were produced by SSALTO/ DUACS and distributed by AVISO,with support from CNES (http://www.aviso.altimetry.fr/duacs/) .
To study interannual variability,seasonal cyclicity must be removed. Here,the climatological monthly means from January-December during 1993-2009 were calculated and removed from the monthly values to obtain monthly anomalies from the climatology. The intraseasonal signals were also removed from the time series at each spatial grid point using a 5-month running mean. Then,the EOF method was used to obtain the spatial patterns and temporal variations of the interannual signals of the SSTAs in order to study the patterns of SSTA in the SCS during the mature phase of the ENSO.
3 RESULT 3.1 SSTA during mature phase of the ENSOAccording to the Niño3.4 index (monthly SST anomalies in the region 5°N-5°S,120°-170°W: positive anomalies >0.5°C indicate El Niño events and negative anomalies <-0.5°C indicate La Niña events (McPhaden,2008) ) ,five El Niño episodes (1994/1995,1997/1998,2002/2003,2006/2007,and 2009/2010) and five La Niña episodes (1995/1996,1999/2000,1999/2000,2007/2008,and 2008/2009) occurred during 1993-2010.
Figure 2 displays the SSTAs in the SCS associated with the five El Niño episodes and five La Niña episodes averaged from December-February (ENSO mature phase) . The most notable characteristics of the variations during the El Niño mature phase are the positive SSTAs along the western boundary current areas with maxima centered southeast of the Vietnam coast. Liu et al. (2004) highlighted that the correlation between SST and ENSO features a local maximum near the cold tongue area in the southwestern SCS,which is higher than in either the Indian Ocean or the western Pacific Ocean north of the equator. However,relatively small positive SSTAs or negative SSTAs appear in the northeastern SCS,indicating that the variations of the SSTAs during the mature phase of ENSO are out of phase between the eastern and western parts of the basin,except for the 2006/2007 El Niño event,which was anomalously weak. However,during the La Niña mature phase,SSTAs in the SCS appear negative in the southwest of the basin and positive in the northeast. Extreme negative SSTAs occur in the southwest of the basin during the 1995/1996 and 2007/2008 La Niña episodes,whereas an extreme positive SSTA appears in the northeast during the 1998/1999 La Niña episode. Although the distribution of SSTAs in the SCS changes considerably in the different El Niño and La Niña years,the common feature is the antiphase variation of SSTA between southwestern and northeastern parts of the basin.

|
| Figure 2 Sea surface temperature anomalies (°C) in the South China Sea during the mature phase of the ENSO (December-February) |
Figure 3 shows the spatial patterns and time coeffcients of the second EOF modes of the SSTAs in the SCS. The spatial pattern associated with mode 2 indicates out-of-phase variations between the southwestern and northeastern SCS,with maximum positive values centered to the southeast of Vietnam,in association with the winter cold tongue areas (Liu et al.,2004) ,and maximum negative values in the areas west of Luzon,accounting for 19.0% of the total variance (Fig. 3a) . The time coeffcient of mode 2 shows large positive values during the winters of 1994/1995,1997/1998,2002/2003,and 2009/2010 and negative values during the winters of 1998/1999,1999/2000,2007/2008,and 2008/2009,which coincides with the mature phases of both El Niño and La Niña. The time coeffcient of mode 2 is well correlated with the Niño3.4 index at the 99% confidence level,lagging by about 1 month with a correlation coeffcient of 0.80 (Fig. 3b) . This indicates that the spatial pattern of mode 2 corresponds to the SSTA pattern in the SCS during the mature phase of ENSO. As revealed in Fig. 3,a positive phase of the second mode represents the SSTA pattern during the mature phase of El Niño in the SCS,which has a negative SSTA in the northeastern SCS and a positive SSTA in the southwest. A negative phase of the second mode represents the SSTA pattern during the mature phase of La Niña episodes in the SCS,which has a positive SSTA in the northeastern SCS and a negative SSTA in the southwest.

|
| Figure 3 Second empirical orthogonal function mode of sea surface temperature anomaly in the South China Sea (see Qiu et al.,2012; Fig. 6c and d) |
Figure 4 shows the composite distributions of SSTAs from December [0] to February [+1] for El Niño (EN) and La Niña (LN) episodes during 1993-2010,based on the SODA and OISST datasets. In this study,[0] refers to the El Niño (La Niña) year and [+1] refers to the year subsequent to the El Niño (La Niña) year. The maps for both the SODA and the OISST datasets show that SSTAs in the southwestern SCS are apparently higher (lower) than normal during El Niño (La Niña) episodes and lower during La Niña episodes,with antiphase variations in the northern and eastern parts of the SCS.

|
| Figure 4 Composite distributions of sea surface temperature anomalies (°C) for December [0] to February [+1] for the five El Niño (a, c) and five La Niña episodes (b, d) from the SODA and OISST datasets (1993-2010) |
The processes generating the large SSTA in the southwestern SCS during the mature phase of ENSO can be assessed by examining the heat budget over the mixed layer based on the SODA dataset:
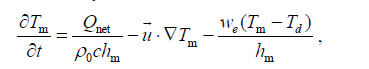 (1)
(1)
where Tm is the temperature in the mixed layer,Td is the temperature in the bottom of the mixed layer,Qnet denotes the net surface heat flux,hm is the mixed-layer depth,

During El Niño episodes, the warming in the southwestern SCS began from the end of September and continued until the end of January (not shown) ,whereas negative a SSTA appeared in the northeastern SCS. A comparison of different physical processes controlling the SSTA in the SCS during the mature phase of the ENSO can be quantitatively assessed further by averaging over the southwestern (5°-10°N,106°-111°E) and northeastern (19°-22°N,118°-121°E) SCS. Figure 5 displays the net surface heat flux,horizontal advection,and vertical entrainment averaged over the southwestern and northeastern SCS for the five El Niño episodes. In the southwestern SCS,the dominant process behind the positive SSTA is the net surface flux except for the 1994/1995 El Niño event. In November 1994,horizontal advection leads to significant warming of about 1°C/month in the southwestern SCS,while the amplitudes of the other terms remain very small. In November of 2002 and 2009,the warming in the southwestern SCS is due to the contributions of both net surface heat flux and horizontal advection. Overall,the major contribution to the warming in the southwestern SCS comes from the air-sea flux,but horizontal advection also adds to the warming during the mature phase of El Niño. Although vertical entrainment could also cause warming,its contribution is considered very small.

|
| Figure 5 Heat budget (°C/month) averaged over (a) the southwestern South Chinas Sea (SCS) (5°-10°N,106°-111°E) and (b) the northeastern SCS (19°-22°N,118°-121°E) during the mature phase of the five El Niño episodes during 1993-2010 |
Figure 6 displays the composite of surface wind anomalies,OLR anomalies,and SLP anomalies during the mature phase (December-February) of the five El Niño episodes from 1993-2010. The positive OLR and SLP anomalies around the areas between the equator and 10°N indicate enhanced sinking motion and weakened convection in these areas. During El Niño episodes,descending motion is dominant over maritime continental areas. This enhanced subsidence reduces cloud cover and increases the amount of solar radiation absorbed by the ocean,which leads to enhanced SSTs over the eastern Indian Ocean and western SCS (Klein et al.,1999) . In addition,previous investigations have indicated that ocean dynamics play an important role in the climatic variability of the SCS (Liu et al.,2004) . Figure 7 shows the geostrophic current anomalies during the mature phase of ENSO. During the mature phase of El Niño,the geostrophic current anomalies exhibit two sub-basin anticyclonic anomalies: one in the southern SCS off the Vietnam coast and the other,over the northern SCS west of Luzon. Although the anomalous patterns of circulation are not identical during the five El Niño episodes,the common feature is the reduced western boundary current. This reduces cold-water advection from north to south and results in the warming of the southwestern SCS.

|
| Figure 6 Composite surface wind anomalies (vector,m/s) ,outgoing longwave radiation anomalies (shaded,W/ m2) ,and sea level pressure anomalies (contours,mb) during the mature phase (December-February) of the five El Niño episodes from 1993-2010 |
Cooling of the northeastern SCS during the mature phase of the ENSO is also caused by the contributions of both the net surface heat flux and the horizontal advection,except for 2003. In January 2003,the net surface flux plays a warming role,whereas the ocean dynamics of horizontal advection lead to a negative SSTA in the northeastern SCS. During the mature phase of El Niño,anticyclonic wind anomalies persist over the areas of the Luzon Strait and northern SCS (Fig. 6) ,which is the most southwestern portion of the western North Pacific anticyclone (Wang et al.,2000; Fang et al.,2006) . Previous studies have revealed that negative (positive) ocean heat content anomalies first appear in the northern SCS during ENSO warm (cold) phases,which are related to transport from the western Pacific Ocean through the Luzon Strait (Yan et al.,2010) . The distribution of ocean heat content anomalies is demonstrated to be consistent with that of SSTA patterns during the ENSO mature phase. During El Niño episodes,western Pacific Ocean water is anomalous colder because the net atmospheric heat flux is reduced. Therefore,cold-water advection into the SCS via the Luzon Strait cools the northern SCS,which could lead to a negative SSTA in the northeast SCS during the mature phase of El Niño. During La Niña episodes,the intrusion of abnormally warmer western Pacific Ocean water increases the ocean heat content in the northern SCS,resulting in a warm SSTA in the northeastern SCS during the mature phase of La Niña (Rong et al.,2007; Swapna et al.,2009) . Additionally,in the surface layer,the intrusion of Pacific Ocean waters depends on the strength of the local winds,which tend to be weaker during El Niño years and stronger during La Niña years (Ho et al.,2004) .

|
| Figure 7 Geostrophic current anomalies (cm/s) in the South China Sea during the mature phase of ENSO (December-February) |
Based on the 18-year (1993-2010) high-resolution OISST dataset,altimeter-observed data,NCEP-NCAR global atmospheric reanalysis data,and SODA dataset,this study provided a detailed description of SSTA patterns in the SCS during the mature phase of the ENSO. The conclusions are summarized as follows.
The most dominant feature of the SSTA patterns in the SCS during the mature phase of ENSO is the different distributions of SSTAs between the southwestern and northeastern parts of the basin,with a positive (negative) SSTA in the southwest and a negative (positive) SSTA in the northeast during El Niño (La Niña) episodes. Net surface heat flux and horizontal thermal advection by ocean currents have considerable influence on the SSTA patterns in the SCS during the mature phase of ENSO. The negative SSTA in the northeastern SCS during the El Niño mature phase is caused mainly by the loss of heat to the atmosphere and by cold-water advection from the western Pacific Ocean through the Luzon Strait. During El Niño episodes,descending atmospheric motion over maritime continental areas reduces cloud cover and increases the amount of solar radiation absorbed by the ocean. This leads to enhanced SSTs over the eastern Indian Ocean and the western SCS. Furthermore,weakening of the western boundary current reduces cold-water advection from north to south,which leads to warming in the southwestern SCS.
| Carton J A, Chepurin G, Cao X H, Giese B, 2000a. A simple ocean data assimilation analysis of the global upper ocean 1950-95. Part Ⅰ:methodology. J. Phys. Oceanogr., 30 (2) : 294 –309. Doi: 10.1175/1520-0485(2000)030<0294:ASODAA>2.0.CO;2 |
| Carton J A, Chepurin G, Cao X H, 2000b. A simple ocean data assimilation analysis of the global upper ocean 1950-95. Part Ⅱ:results. Journal of Physical Oceanography, 30 (2) : 311 –326. Doi: 10.1175/1520-0485(2000)030<0311:ASODAA>2.0.CO;2 |
| Carton J A, Giese B S, 2008. A reanalysis of ocean climate using Simple Ocean Data Assimilation(SODA). Monthly Weather Review, 136 (8) : 2999 –3017. Doi: 10.1175/2007MWR1978.1 |
| Chao S Y, Shaw P T, Wu S Y, 1996. El Niño modulation of the South China Sea circulation. Progress in Oceanography, 38 (1) : 51 –93. Doi: 10.1016/S0079-6611(96)00010-9 |
| Chu P C, Lu S H, Chen Y C, 1997. Temporal and spatial variabilities of the South China Sea surface temperature anomaly. J. Geophys. Res., 102 (C9) : 20937 –20955. Doi: 10.1029/97JC00982 |
| Du Y, Xie S P, Huang G, Hu K M, 2009. Role of air-sea interaction in the long persistence of El Niño-induced North Indian Ocean Warming. J. Climate, 22 (8) : 2023 –2038. Doi: 10.1175/2008JCLI2590.1 |
| Fang G H, Chen H Y, Wei Z X, Wang Y G, Wang X Y, Li C Y, 2006. Trends and interannual variability of the South China Sea surface winds, surface height, and surface temperature in the recent decade. J. Geophys. Res., 111 (C11) : C11S16 . |
| Ho C R, Zheng Q A, Kuo N J, Tsai C H, Huang N E, 2004. Observation of the Kuroshio intrusion region in the South China Sea from AVHRR data. International Journal of Remote Sensing, 25 (21) : 4583 –4591. Doi: 10.1080/0143116042000192376 |
| Huang Z, Du Y, Wu Y L, Xu H M, 2013. Asymmetric response of the South China Sea SST to El Niño and La Niña. Journal of Ocean University of China, 12 (2) : 272 –278. Doi: 10.1007/s11802-013-2169-x |
| Kalnay E, Kanamitsu M, Kistler R, et al, 1996. The NCEP/NCAR 40-year reanalysis project. Bulletin of the American Meteorological Society, 77 (3) : 437 –471. Doi: 10.1175/1520-0477(1996)077<0437:TNYRP>2.0.CO;2 |
| Klein S A, Soden B J, Lau N C, 1999. Remote sea surface temperature variations during ENSO:evidence for a tropical atmospheric bridge. J. Climate, 12 (4) : 917 –932. Doi: 10.1175/1520-0442(1999)012<0917:RSSTVD>2.0.CO;2 |
| Liu Q Y, Jiang X, Xie S P, Liu W T, 2004. A gap in the Indo-Pacific warm pool over the South China Sea in boreal winter:Seasonal development and interannual variability. J. Geophys. Res., 109 (C7) : C07012 . |
| McPhaden M J, 2008. Evolution of the 2006-2007 El Niño:the role of intraseasonal to interannual time scale dynamics. Advances in Geosciences, 14 : 219 –230. Doi: 10.5194/adgeo-14-219-2008 |
| Qiu F W, Fang W D, Fang Y, Guo P, 2012. Anomalous oceanic characteristics in the South China Sea associated with the large-scale forcing during 2006-2009. Journal of Marine System, 100-101 : 9 –18. Doi: 10.1016/j.jmarsys.2012.03.010 |
| Qu T D, Kim Y Y, Yaremchuk M, Tozuka T, Ishida A, Yamagata T, 2004. Can Luzon Strait Transport Play a Role in Conveying the Impact of ENSO to the South China Sea?. J. Climate, 17 (18) : 3644 –3657. Doi: 10.1175/1520-0442(2004)017<3644:CLSTPA>2.0.CO;2 |
| Reynolds R W, Smith T M, 1994. Improved global sea surface temperature analyses using optimum interpolation. J. Clim ate, 7 (6) : 929 –948. Doi: 10.1175/1520-0442(1994)007<0929:IGSSTA>2.0.CO;2 |
| Rong Z R, Liu Y G, Zong H B, Cheng Y C, 2007. Interannual sea level variability in the South China Sea and its response to ENSO. Global and Planetary Change, 55 (4) : 257 –272. Doi: 10.1016/j.gloplacha.2006.08.001 |
| Swapna P, Gan J P, Lau A, Fung J, 2009. On the warm/cold regime shift in the South China Sea:observation and modeling study. Deep Sea Research Part Ⅰ:Oceanographic Research Papers, 56 (7) : 1039 –1056. Doi: 10.1016/j.dsr.2009.03.008 |
| Wang B, Wu R G, Fu X H, 2000. Pacific-East Asian teleconnection:how does ENSO affect East Asian climate? J. Climate, 13 (9) : 1517 –1536. Doi: 10.1175/1520-0442(2000)013<1517:PEATHD>2.0.CO;2 |
| Wang B, Zhang Q, 2002. Pacific-East Asian teleconnection. Part Ⅱ:how the Philippine sea anomalous anticyclone is Established during El Niño development. J. Climate, 15 (22) : 3252 –3265. |
| Wang C Z, Wang W Q, Wang D X, Wang Q, 2006. Interannual variability of the South China Sea associated with El Niño. J. Geophys. Res., 111 (C3) : C03023 . |
| Wu R G, Chen W, Wang G H, Hu K M, 2014. Relative contribution of ENSO and East Asian winter monsoon to the South China Sea SST anomalies during ENSO decaying years. J. Geophys. Res., 119 (9) : 5046 –5064. |
| Xie S P, Hu K M, Hafner J, Tokinaga H, Du Y, Huang G, Sampe T, 2009. Indian ocean capacitor effect on indowestern pacific climate during the summer following El Niño. J. Climate, 22 (3) : 730 –747. Doi: 10.1175/2008JCLI2544.1 |
| Xie S P, Xie Q, Wang D X, Liu W T, 2003. Summer upwelling in the South China Sea and its role in regional climate variations. J. Geophys. Res., 108 (C8) : 3261 . Doi: 10.1029/2003JC001867 |
| Yan Y F, Qi Y Q, Zhou W, 2010. Interannual heat content variability in the South China Sea and its response to ENSO. Dynamics of Atmospheres and Oceans, 50 (3) : 400 –414. Doi: 10.1016/j.dynatmoce.2010.07.002 |