 2016, 34
Institute of Oceanology, Chinese Academy of Sciences
Article Information
- Guoli WU(吴国丽), Fangguo ZHAI(翟方国), Dunxin HU(胡敦欣)
- Interannual variations of North Equatorial Current transport in the Pacific Ocean during two types of El Niño
- Journal of Oceanology and Limnology, 34(3): 585-596
- http://dx.doi.org/10.1007/s00343-015-4352-y
Article History
- Received: Dec. 9, 2014
- Accepted: Feb. 16, 2015


2. University of Chinese Academy of Sciences , Beijing 100049 , China;
3. College of Science , China University of Petroleum , Qingdao 266580 , China;
4. College of Oceanic and Atmospheric Sciences, Ocean University of China, Qingdao 266100, China
Flowing westward in the tropical North Pacific Ocean,the North Equatorial Current (NEC) bifurcates into the northward-flowing Kuroshio Current (KC) and southward-flowing Mindanao Current (MC) near the Philippine coast,comprising the NEC-MC-KC (NMK) current system (Nitani,1972; Hu and Cui,1989; Toole et al.,1990; Qu et al.,1998; Qu and Lukas,2003) . The NEC is the core of the NMK current system and is critical not only to the heat budget of the western Pacific warm pool (Qiu and Lukas,1996; Qu et al.,1997) but also to the global Qiu and Joyce,1992; Gu,1996; Qiu and Lukas,1996; Qu et al.,1997,1998; Qu and Lukas,2003; Kim et al.,2004; Yaremchuk and Qu,2004; Wang and Hu,2006; Kashino et al.,2009; Xie et al.,2009; Qiu and Chen,2010; Zhai and Hu,2012,2013; Zhai et al.,2013) .
Variations of NEC transport on both seasonal and interannual time scales have been frequently researched,and the amplitude of the latter is much larger than that of the former (Qiu and Joyce,1992; Qiu and Lukas,1996; Kim et al.,2004; Yaremchuk and Qu,2004) . On the interannual time scale,NEC transport variability is closely associated with El Niño-Southern Oscillation (ENSO) events (Qiu and Joyce,1992; Qiu and Lukas,1996; Kim et al.,2004; Kashino et al.,2009; Qiu and Chen,2010; Zhai and Hu,2012) . The NEC transport tends to increase/ decrease during the ENSO warm/cold phase (ElNiño/ La Niña) . The underlying dynamics of these phenomena mainly involves westward-propagating baroclinic Rossby waves generated by wind anomalies in the western-central tropical North Pacific Ocean (Qiu and Joyce,1992; Qiu and Lukas,1996; Kim et al.,2004; Kashino et al.,2009; Qiu and Chen,2010; Zhai and Hu,2012) .
ElNiños are phenomena of anomalous sea surface temperature (SST) warming in the eastern/central Pacific Ocean (Rasmusson and Carpenter,1982; Trenberth,1997; Trenberth and Stepaniak,2001) . Recent studies have indicated that ElNiños can be distinguished into two types,conventional ones with SST warming in the eastern equatorial Pacific and non-conventional ones with such warming in the central equatorial Pacific (Fu and Fletcher,1985; Larkin and Harrison,2005; Ashok et al.,2007; Kao and Yu,2009; Kug et al.,2009; Takahashi et al.,2011) . Circulation and wind anomalies in the western-central tropical North Pacific Ocean vary between the two types (Hsin and Qiu,2012) . Changes of the flow field strongly affect NEC transport variations. Thus,the aim of the present study is to investigate the impacts of the two types of ElNiños on interannual variations of NEC transport,using a long-term,three-dimensional ocean reanalysis dataset.
2 DATA AND METHOD 2.1 ECMWF ORA-S3We used outputs of European Centre for Medium-Range Weather Forecast (ECMWF) Ocean Analysis/ Reanalysis System 3 (ORA-S3; Balmaseda et al.,2008) ,which were obtained from the Asia-Pacific Data Research Center of the International Pacific Research Center (http://apdrc.soest.hawaii.edu/) .ECMWF ORA-S3 covers the global ocean and provides monthly mean potential temperature,salinity,current velocity,sea level height,and wind stress. It spans 51 years,from January 1959 through December 2009,with horizontal resolution 1°×1° and 29 levels in the vertical. An ocean assimilation scheme is used in this reanalysis system and available observations are assimilated,which include altimeter-derived sea level anomalies and subsurface temperature and salinity data above 2 000 m depth.Refer to Balmaseda et al. (2008) for more detailed descriptions of this product and comparisons with observational data.
The ocean reanalysis has been validated in other studies against many observations in the northwestern tropical Pacific Ocean (Zhai and Hu,2013; Zhai et al.,2013) ,including tidal gauge observed sea level and hydrographic observations along 137°E,acquired by the Japan Meteorological Agency. Figure 1 compares annual mean zonal velocities and monthly NEC transport across 137°E from ECMWF ORA-S3 with those from observations over the period 2001-2009. Observations used here are from the Grid Point Value of the Monthly Objective Analysis (Hosoda et al.,2008) ,which is constructed mainly from Argo float data using interpolation. This provides monthly temperature and salinity from January 2001 through December 2013 with horizontal resolution 1°×1° and 25 vertical levels from 10 to 2 000 dbar. Along 137°E,the main body of the NEC with velocities <-5 cm/s lies between about 7°N and 20°N and above the 26.7 σθ isopycnal surface; its maximum westward velocity core is around 11°N at the sea surface and moves northward with depth (Qiu and Joyce,1992; Qiu and Lukas,1996; Zhai and Hu,2013; Zhai et al.,2013) . Seen from Fig. 1a and b,the ECMWF ORA-S3 captures well the observed meridional structure of zonal velocities. The linear correlation coeffcient of NEC transport from these two products is ~0.8,above the 95% confidence level. This comparison strengthens our confidence in using this ocean reanalysis for the present study.

|
| Figure 1 Annual mean zonal velocities (cm/s) across 137°E from the Grid Point Value of the Monthly Objective Analysis (MOAA GPV; a) and ECMWF ORA-S3 (b) |
According to Fig. 1b,the main climatological body of the NEC across 137°E is between 8°N and 18°N and above the 26.7 σθ isopycnal surface. Thus,we define NEC transport (TNEC) across a given meridian x=x0 as
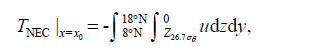 (1)
(1)where x,y and z are longitude,latitude and depth,respectively; u is zonal westward velocity from ECMWF ORA-S3,as the NEC is regarded as a westward flow. The minus sign in this equation makes NEC westward transport positive.
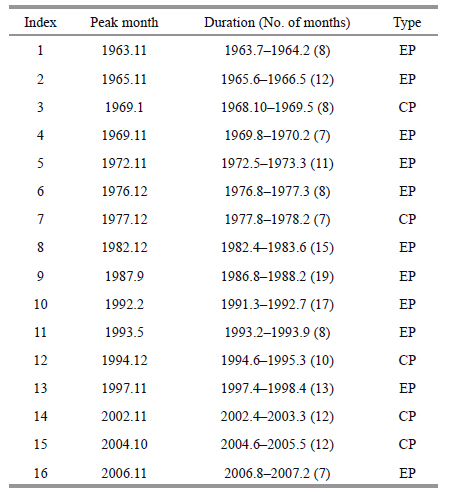
2.3 Eastern-Pacific and Central-Pacific ElNiñosDefinitions and names of the two types of ElNiños are different in previous studies (Larkin and Harrison,2005; Ashok et al.,2007; Kao and Yu,2009; Kug et al.,2009; Takahashi et al.,2011) . In our study,the conventional and non-conventional ElNiños are called “Eastern-Pacific ElNiño (EP-ElNiño) ” and “Central-Pacific ElNiño (CP-ElNiño) ,” respectively. The method to distinguish them is the same as that in Hsin and Qiu (2012) . First,following the definition of Trenberth (1997) ,we define an ElNiño by SST anomalies in the Niño-3.4 area (5°N-5°S,170°W-120°W) exceeding 0.4°C for 6 months or more. Then,referring to the results of Kug et al. (2009) ,an ElNiño event is regarded as an EP-ElNiño if SST anomalies in the Niño-3 area (5°S-5°N,150°W-90°W) are greater than those in the Niño-4 area (5°S-5°N,160°E-150°W) during the ElNiño event. Conversely,an ElNiño event is regarded as a CP-ElNiño when the SST anomalies in the Niño-4 area are greater than those in the Niño-3 area. The classification of ElNiños during 1959-2009 based on the ECMWF ORA-S3 SST is shown in Table 1,with the peak month indicating when the Niño-3.4 SST had the warmest anomalies. EP and CP represent the EP-ElNiño and CP-ElNiño,respectively. As seen in the table,there were 16 ElNiños over the past 51 years. Among them,11 were EP-ElNiños and five CP-ElNiños,which mainly appeared after 1990. The ElNiño events obtained here are generally consistent with those from the observed Niño index (http://www.cpc.ncep.noaa.gov/data/indices) ,albeit with one-or two-month lead or lag between them for some events.
For monthly variables such as sea surface height (SSH) ,current velocity,wind vectors,Ekman pumping velocity (EPV) ,and others,monthly climatology is first subtracted from the original monthly means to yield monthly mean anomalies. Then,to remove sub-annual signals,a 13-month running mean filter was applied to those anomalies. Last,a high-pass filter was used to extract interannual signals shorter than 8 years.
3 RESULT 3.1 Interannual variations of NEC transport and ElNiñosFigure 2a shows the Niño-3.4 SST anomaly,with yellow bars representing EP-ElNiño events and blue bars CP-ElNiño events. We focused on NEC interannual variations in the western Pacific Ocean during these ElNiño events. Therefore,Fig. 2b depicts NEC transport interannual anomalies at integer longitudes from 135°E to 180°E. Generally,that transport is greater than average during ElNiño events and less than average during La Niña events,and magnitudes of the interannual variations increase from east to west (Zhai and Hu,2013) . As shown in Fig. 2,impacts of the ElNiño events on NEC transport are very strong,especially for EP-ElNiños. In addition,significant positive anomalies of NEC transport during ElNiño events are mainly during EP-ElNiños rather than CP-ElNiños. These phenomena are more evident in Fig. 3,which shows the NEC transport anomaly averaged over 135°E-180°E.

|
| Figure 2 Anomalies of (a) Niño-3.4 sea surface temperature (SST) with EP-ElNiños and CP-ElNiños marked by yellow and blue bars,respectively,and (b) NEC transport (Sv) at integer longitudes from 135°E to 180°E in ECMWF ORA-S3 |

|
| Figure 3 NEC transport anomaly averaged over 135°-180°E in ECMWF ORA-S3,with EP-ElNiños and CP-ElNiños marked by yellow and blue bars,respectively |
To show in detail the impacts of the two types of ElNiños on NEC transport interannual variations,we show in Fig. 4 composite anomalies of that transport during evolutions of the two types. In Fig. 4,negative/ positive values on the vertical axis denote months before/after the peak month (T=0) of each ElNiño event (similarly hereafter) . Interannual variations of NEC transport during the EP-ElNiños and CP-ElNiños are evidently different. In EP-ElNiños,the transport had positive anomalies in the area 135°E-180°E from T=-8 month to T=6 month,with maximum values from T=-3 month to T=3 month west of 160°E. During the CP-ElNiño events,positive anomalies of the transport only appeared in the area 135°-155°E before T=0 month,with maxima appearing at T=-8 month in the area 140°-150°E. After T=0 month,the NEC transport had negative anomalies. The magnitude of positive transport anomalies during the CP-ElNiño events was much weaker than that during the EP-ElNiño events.

|
| Figure 4 Composite anomalies of NEC transport (Sv) from 11 EP-El Niño events (left) and 5 CP-El Niño events (right) in ECMWF ORA-S3 |
In this section,we investigate the evolution of circulation anomalies during the two types of ElNiño events. Figure 5 shows composite anomalies of 200-m depth integral flow and SSH during the 11 EP-ElNiño events in ECMWF ORA-S3. At T=-8 month,negative SSH anomalies and a cyclonic gyre anomaly appear in the area 10°-15°N,130°-170°E in the northwestern tropical Pacific Ocean. Subsequently,with the decrease of negative SSH anomalies,the cyclonic gyre anomaly gradually strengthened and its center migrated southward. Around T=0 month,that anomaly had maximum strength. After this,it gradually weakened. The anomaly strengthened the wind-driven cyclonic tropical gyre in the western North Pacific.

|
| Figure 5 Composite anomalies of 200-m depth integral flow (Sv; arrows) and sea surface height (SSH) (m; color shading) from the 11 EP-ElNiño events in ECMWF ORA-S3 |
To investigate in detail the vertical distributions of circulation variations in the western tropical Pacific during the EP-ElNiños,we show in Fig. 6 composite anomalies of zonal velocity at 140°E during the 11 EP-ElNiño events in ECMWF ORA-S3. At T=-8 month,there were westward and eastward flow anomalies north and south of 10°N,respectively. These zonal velocity anomalies are part of the cyclonic gyre anomaly presented in Fig. 5. With strengthening of that anomaly,the westward flow anomalies intensified and spread southward. Therefore,integration of the westward velocity anomalies between 8°N and 18°N resulted in westward NEC transport anomalies.

|
| Figure 6 Composite anomalies of zonal velocity (m/s) at 140°E during the 11 EP-ElNiño events in ECMWF ORA-S3 |
Figure 7 shows composite anomalies of 200-m depth integral flow and SSH during the CP-ElNiño events. Anomalies of the flow and SSH during those events appear much weaker and have different spatial patterns than those during the EP-ElNiño events. At T=-8 month,there were negative SSH anomalies and a cyclonic gyre anomaly south of 10°N. In contrast,weak positive SSH anomalies and an anticyclonic gyre anomaly are north of 10°N. Afterward,the positive SSH anomalies gradually weakened and disappeared,while the negative SSH anomalies gradually strengthened and spread to the north of 10°N.

|
| Figure 7 Composite anomalies of 200-m depth integral flow (Sv; arrow) and SSH (m; color shading) during the five CP-ElNiño events in ECMWF ORA-S3 |
Figure 8 depicts composited zonal velocity anomalies at 140°E during the five CP-ElNiño events in ECMWF ORA-S3. As seen in the figure,there were westward flow anomalies near 10°N at T=-8 month,which then weakened with time. At T=0 month,those anomalies fully transformed into eastward flow anomalies. Therefore,the NEC transport had a maximum positive anomaly at T=-8 month and then weakened with time. After T=0 month,the transport had a negative anomaly.

|
| Figure 8 Composite anomalies of zonal velocity (m/s) at 140°E during the five CP-ElNiño events in ECMWF ORA-S3 |
Low-frequency circulation variations in the northwestern tropical Pacific have been proven to be induced mainly by sea surface wind forcing (Qiu and Joyce,1992; Qiu and Lukas,1996; Qu et al.,1998; Kim et al.,2004; Kashino et al.,2009; Zhai and Hu,2012) . Therefore,in this section we address the impacts of such forcing. Figures 9 and 10 show composite anomalies of the wind stress vector and associated EPV dividing the phase speed of first-mode baroclinic Rossby waves from the 11 EP-ElNiño and five CP-ElNiño events,respectively. The baroclinic Rossby wave speed is calculated with the first-mode baroclinic Rossby deformation radius obtained by Chelton et al. (1998) . As shown in Fig. 9,from T=-8 month to T=-2 month there were strong positive EPV anomalies north of the equator and south of 20°N in the western-central tropical North Pacific. These positive EPV anomalies excite upwelling Rossby waves that propagate westward to produce negative SSH anomalies and the cyclonic gyre anomaly in the northwestern tropical Pacific. From about T=-2 month,negative EPV anomalies appeared in the far western tropical Pacific off the Philippine coast,which would subsequently weaken the negative SSH anomalies.

|
| Figure 9 Composite anomalies of wind stress vector (N/m2; arrows) and associated Ekman pumping velocity dividing the baroclinic Rossby wave speed (10-6 m/s; color shading) from the 11 EP-ElNiño events in ECMWF ORA-S3 |
During the CP-ElNiño events,however,anomalies of the wind stress and associated EPV were much weaker than those during the EP-ElNiño events (Fig. 10) . Takahashi et al. (2011) also indicated shorter durations and weaker magnitudes of wind fluctuations during those events. As seen in Fig. 10,during CP-ElNiño events there were also positive EPV anomalies in the western-central North Pacific. However,these anomalies extended beyond 20°N and generally decreased southward. Thus,the resulting cyclonic gyre anomaly center during CP-ElNiño events was slightly north of that during EP-ElNiño events.

|
| Figure 10 Same as Fig. 9,but for the five CP-ElNiño events in ECMWF ORA-S3 |
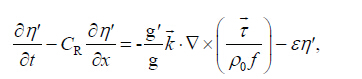
In the tropical Pacific Ocean,the anomalous sea surface wind forcing induces local SSH anomalies that propagate westward in the form of baroclinic Rossby waves. This dynamic process can be explained by the linear vorticity equation in the framework of a 1.5-layer reduced gravity model (Meyers,1979; Kessler,1990; Qiu and Joyce,1992; Capotondi et al.,2003; Qiu and Chen,2010; Zhai and Hu,2012,2013) . Under the long wave approximation and assumptions of quasi-geostrophy and low frequency,the linear vorticity equation governing the SSH anomaly (η') is
 (2)
(2)
where CR=βλ2 is the phase speed of the first-mode baroclinic Rossby waves,β is the meridional gradient of the Coriolis parameter f,λ is the baroclinic Rossby radius,
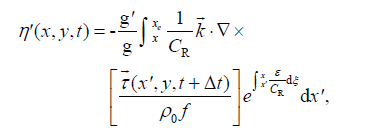 (3)
(3)Monthly wind stress vector anomalies were from ECMWF ORA-S3. Given the above parameters,the modeled η' is a function of g' and ε. Those two parameters are empirically determined by comparing the modeled SSH anomalies and those in ECMWF ORA-S3.
We obtained two optimal ε for different parts of the North Pacific along a given latitude. Here, we calculated the modeled SSH anomalies along 8°N and 11°N,which corresponded well to the SSH anomaly centers during the EP-ElNiño and CP-ElNiño events, respectively. Along 8°N,the optimal g' was estimated at 0.076 m/s2,whereas ε=0 west of 180°E and 0.197 per month to its east. Along 11°N,the optimal g' was estimated at 0.059 m/s2,whereas ε=0 west of 180°E and 0.247 per month to its east. Figure 11 shows time-longitude plots of interannual SSH anomalies in ECMWF ORA-S3 and modeled ones along 8°N and 11°N. Overall,the linear vorticity model effectively captured the low-frequency SSH signals in ECMWF ORA-S3 over the region of interest. In the westerncentral North Pacific Ocean, correlation coefficients between the modeled SSH anomalies and those in ECMWF ORA-S3 were generally >0.65 at both latitudes. Seen from the figure,the westward Rossby wave signals are obvious during both types of ElNiño.

|
| Figure 11 a. time series of Niño-3.4 SST anomaly with EP-ElNiños and CP-ElNiños marked by yellow and blue bars,respectively; b. time-longitude plot of SSH anomaly (m) derived from ECMWF ORA-S3 along 8°N; c. same as (b) ,but along 11°N; d. same as (b) ,but for modeled SSH anomaly; d. same as (c) ,but for modeled SSH anomaly |
Interannual variability of NEC transport is strongly correlated with ENSO events (Qiu and Joyce,1992; Qiu and Lukas,1996; Kim et al.,2004; Wang and Hu,2006; Qiu and Chen,2010) . Because ElNiños have been distinguished as conventional and non-conventional types in recent years (Fu and Fletcher,1985; Larkin and Harrison,2005; Ashok et al.,2007; Kao and Yu,2009; Kug et al.,2009; Takahashi et al.,2011) ,we investigated herein the impacts of these two types on interannual variability of NEC transport,using a three-dimensional ocean reanalysis and composite analysis method. Results indicate that during the EP-ElNiño and CP-ElNiño events,the interannual variations were very different. In EP-ElNiños,positive anomalies of NEC transport occurred from the developing to decay phases,and the largest anomalies appeared around the mature phase to the west of 160°E. In the CP-ElNiños,however,positive transport anomalies appeared prior to the mature phase and their strength was much weaker than in the EP-ElNiños. After T=0 month,the NEC transport showed negative anomalies to the west of 160°E.
During the EP-ElNiño events,strong westerly wind anomalies and positive EPV anomalies in the tropical North Pacific Ocean excited upwelling Rossby waves that propagated westward,lowering SSH and generating a cyclonic flow anomaly in the western tropical Pacific. During the CP-ElNiño events,however,the strength of the wind anomalies and associated EPV anomalies were very weak. Positive EPV anomalies extended over a large area,from the equator to 30°N in the North Pacific,and generally decreased southward. Therefore,the negative SSH and cyclonic flow anomalies were slightly north of those during the EP-ElNiño events. In our future work,we will investigate the impact of the two types of ElNiños on seasonal variability of NEC transport and the relationship between interannual variations of that transport and La Niña events.
| Ashok K, Behera S K, Rao S A, Weng H Y, Yamagata T, 2007. El Niño Modoki and its possible teleconnection. J. Geophys. Res., 112 (C11) : C11007 . Doi: 10.1029/2006JC003798 |
| Balmaseda M A, Vidard A, Anderson D L T, 2008. The ECMWF ocean analysis system:ORA-S3. Mon. Wea. Rev., 136 (8) : 3018 –3034. Doi: 10.1175/2008MWR2433.1 |
| Capotondi A, Alexander M A, Deser C, 2003. Why are there Rossby wave maxima in the Pacific at 10°S and 13°N? J. Phys. Oceanogr., 33 (8) : 1549 –1563. Doi: 10.1175/1520-0485(2003)033<1549:WATRWM>2.0.CO;2 |
| Chelton D B, De Szoeke R A, Schlax M G, El Naggar K, Siwertz N, 1998. Geographical variability of the first baroclinic Rossby radius of deformation. J. Phys. Oceanogr., 28 (3) : 433 –460. Doi: 10.1175/1520-0485(1998)028<0433:GVOTFB>2.0.CO;2 |
| Fu C B, Fletcher J, 1985. Two patterns of Equatorial warming associated with El Niño. Chin. Sci. Bull., 30 (10) : 1360 –1364. |
| Gordon A L, 1986. Interocean exchange of thermocline water. J. Geophys. Res., 91 (C4) : 5037 –5046. Doi: 10.1029/JC091iC04p05037 |
| Gu Y H, 1996. Zonal volume transports at 137°E in the northwestern Pacific. Oceanol. Limnol. Sinica, 27 (1) : 79 –85. |
| Hosoda S, Ohira T, Nakamura T, 2008. A monthly mean dataset of global oceanic temperature and salinity derived from Argo fl oat observations. JAMSTEC Rep. Res. Dev., 8 : 47 –59. Doi: 10.5918/jamstecr.8.47 |
| Hsin Y C, Qiu B, 2012. The impact of Eastern-Pacific versus Central-Pacific El Niños on the north equatorial countercurrent in the Pacific Ocean. J. Geophys. Res., 117 (C11) . |
| Hu D X, Cui M C, 1989. The western boundary current in the far western Pacific Ocean. In:Picaut J, Lukas R, Delcroix T eds. Proceedings of Western International Meeting and Workshop on TOGA COARE, May 24-30, 1989 : 123 –134. |
| Hu D X, Cui M C, 1991. The western boundary current of the Pacific and its role in the climate. Chin. J. Oceanol. Limnol., 9 (1) : 1 –14. Doi: 10.1007/BF02849784 |
| Kao H Y, Yu J Y, 2009. Contrasting eastern-Pacific and central-Pacific types of ENSO. J. Clim ate, 22 (3) : 615 –632. Doi: 10.1175/2008JCLI2309.1 |
| Kashino Y, España N, Syamsudin F, Richards K J, Jensen T, Dutrieux P, Ishida A, 2009. Observations of the north equatorial current, mindanao current, and kuroshio current system during the 2006/07 El Niño and 2007/08 La Niña. J. Oceanogr., 65 (3) : 325 –333. Doi: 10.1007/s10872-009-0030-z |
| Kessler W S, 1990. Observations of long Rossby waves in the northern tropical Pacific. J. Geophys. Res., 95 (C4) : 5183 –5217. Doi: 10.1029/JC095iC04p05183 |
| Kim Y Y, Qu T D, Jensen T, Miyama T, Misudera H, Kang H W, Ishida A, 2004. Seasonal and interannual variations of the north equatorial current bifurcation in a highresolution OGCM. J. Geophys. Res., 109 (C3) : C03040 . |
| Kug J S, Jin F F, An S I, 2009. Two types of El Niño events:cold tongue El Niño and warm pool El Niño. J. Clim ate, 22 (6) : 1499 –1515. Doi: 10.1175/2008JCLI2624.1 |
| Larkin N K, Harrison D E, 2005. On the definition of El Niño and associated seasonal average U. S. weather anomalies. Geophys. Res. Lett., 32 (13) : L13705 . Doi: 10.1029/2005GL022738 |
| Meyers G, 1979. On the annual Rossby wave in the tropical North Pacific Ocean. J. Phys. Oceanogr., 9 (4) : 663 –674. Doi: 10.1175/1520-0485(1979)009<0663:OTARWI>2.0.CO;2 |
| Nitani H, 1972. Beginning of the Kuroshio. Seattle, Wash: In:Stommel H, Yoshida K eds. Kuroshio:Physical Aspects of the Japan Current. Univ. of Washington Press129-163. |
| Qiu B, Chen S M, 2010. Interannual-to-decadal variability in the bifurcation of the North Equatorial Current offthe Philippines. J. Phys. Oceanogr., 40 (11) : 2525 –2538. Doi: 10.1175/2010JPO4462.1 |
| Qiu B, Joyce T M, 1992. Interannual variability in the mid- and low-latitude Western North Pacific. J. Phys. Oceanogr., 22 (9) : 1062 –1079. Doi: 10.1175/1520-0485(1992)022<1062:IVITMA>2.0.CO;2 |
| Qiu B, Lukas R, 1996. Seasonal and interannual variability of the North Equatorial Current, the Mindanao Current, and the Kuroshio along the Pacific western boundary. J. Geophys. Res., 101 (C5) : 12315 –12330. Doi: 10.1029/95JC03204 |
| Qu T D, Lukas R, 2003. The bifurcation of the North Equatorial Current in the Pacific. J. Phys. Oceanogr., 33 (1) : 5 –18. Doi: 10.1175/1520-0485(2003)033<0005:TBOTNE>2.0.CO;2 |
| Qu T D, Meyers G, Godfrey J S, Hu D X, 1997. Upper ocean dynamics and its role in maintaining the annual mean western Pacific warm pool in a global GCM. Int. J. Climatol., 17 (7) : 711 –724. Doi: 10.1002/(ISSN)1097-0088 |
| Qu T D, Mitsudera H, Yamagata T, 1998. On the western boundary currents in the Philippine Sea. J. Geophys. Res., 103 (C4) : 7537 –7548. Doi: 10.1029/98JC00263 |
| Rasmusson E M, Carpenter T H, 1982. Variations in tropical sea surface temperature and surface wind fields associated with the Southern Oscillation/El Niño. Mon. Wea. Rev., 110 (5) : 354 –384. Doi: 10.1175/1520-0493(1982)110<0354:VITSST>2.0.CO;2 |
| Takahashi K, Montecinos A, Goubanova K, Dewitte B, 2011. ENSO regimes:reinterpreting the canonical and Modoki El Niño. Geophys. Res. Lett., 38 (10) : L10704 . |
| Toole J M, Millard R C, Wang Z, Pu S, 1990. Observations of the Pacific North Equatorial current bifurcation at the Philippine coast. J. Phys. Oceanogr., 20 (2) : 307 –318. Doi: 10.1175/1520-0485(1990)020<0307:OOTPNE>2.0.CO;2 |
| Toole J M, Zou E, Millard R C, 1988. On the circulation of the upper waters in the western equatorial Pacific Ocean. Deep Sea Res. A:Oceanpgr. Res. Paper., 35 (9) : 1451 –1482. Doi: 10.1016/0198-0149(88)90097-0 |
| Trenberth K E, 1997. The definition of El Niño. Bull. Am. Meteor. Soc., 78 (12) : 2771 –2777. Doi: 10.1175/1520-0477(1997)078<2771:TDOENO>2.0.CO;2 |
| Trenberth K E, Stepaniak D P, 2001. Indices of El Niño evolution. J. Clim ate, 14 (8) : 1697 –1701. Doi: 10.1175/1520-0442(2001)014<1697:LIOENO>2.0.CO;2 |
| Wang Q Y, Hu D X, 2006. Bifurcation of the north equatorial current derived from altimetry in the Pacific Ocean. J. Hydrodyn. B, 18 (5) : 620 –626. Doi: 10.1016/S1001-6058(06)60144-3 |
| Xie S P, Hu K M, Hafner J, Tokinaga H, Du Y, Huang G, Sampe T, 2009. Indian Ocean capacitor effect on Indo-Western Pacific climate during the summer following El Niño. J. Clim ate, 22 (3) : 730 –747. Doi: 10.1175/2008JCLI2544.1 |
| Yaremchuk M, Qu T D, 2004. Seasonal variability of the largescale currents near the coast of the philippines. J. Phys. Oceanogr., 34 (4) : 844 –855. Doi: 10.1175/1520-0485(2004)034<0844:SVOTLC>2.0.CO;2 |
| Zhai F G, Hu D X, Qu T D, 2013. Decadal variations of the North Equatorial Current in the Pacific at 137°E. J. Geophys. Res., 118 (10) : 4989 –5006. Doi: 10.1002/jgrc.20391 |
| Zhai F G, Hu D X, 2012. Interannual variability of transport and bifurcation of the North Equatorial Current in the tropical North Pacific Ocean. Chin. J. Oceanol. Limnol., 30 (1) : 177 –185. Doi: 10.1007/s00343-012-1194-8 |
| Zhai F G, Hu D X, 2013. Revisit the interannual variability of the North Equatorial Current transport with ECMWF ORA-S3. J. Geophys. Res., 118 (3) : 1349 –1366. Doi: 10.1002/jgrc.20093 |