Institute of Oceanology, Chinese Academy of Sciences
Article Information
- Bailing ZHOU(周百灵), Kuidong XU(徐奎栋)
- Spatiotemporal variation in community structure of marine benthic ciliates in the Yellow Sea during and after macroalgal and giant jellyfish blooms
- Journal of Oceanology and Limnology, 34(4): 629-641
- http://dx.doi.org/10.1007/s00343-016-5115-0
Article History
- Received: Apr. 9, 2015
- Accepted: Jun. 26, 2015
2. University of Chinese Academy of Sciences, Beijing 100049, China
Ciliates form an important component in the benthic microbial food web as well as in planktonic ecosystems, feeding on bacteria, algae and other protists, even small metazoan, and providing an important avenue for energy transfer from pico-and nano-sized organisms to higher trophic levels (Kuipers et al., 1981; Epstein, 1997; Calbet and Saiz, 2005; Fenchel, 2008) . In contrast to the many previous studies on the planktonic ciliates, few focus on benthic ciliates. The situation is mainly due to the difficulties in quantifying, extracting and identifying ciliates from sediments. By combining Percoll as well as Ludox density gradient centrifugation with the quantitative protargol stain (QPS) (Wickham et al., 2000; Xu et al., 2010) for the quantitative and qualitative analyses of benthic ciliates, more research on benthic ciliates have been conducted (Hamels et al., 2004, Hamels et al., 2005; Du et al., 2012; Meng et al., 2012) . However, most studies have been confined to the intertidal environments and the community composition and function of ciliates in offshore sediments are largely not known. Only Meng (2012) reported the benthic ciliates in the Yellow Sea in June 2007.
The Yellow Sea is located between China and the Korean Peninsula, and has a characteristic Yellow Sea Cold Water Mass (YSCWM) , which annually develops well in July and August and declines in autumn (Yu et al., 2006) . The southern Yellow Sea has suffered recurrent green macroalgal (Ulva prolifera) blooms since 2008. In 2011, the green macroalgae occurred in the southern Yellow Sea from late May through the end of August. On July 19, the coverage of green macroalgae achieved a maximum of approximately 560 km 2, and accumulated mainly in the sea areas of Rizhao and Qingdao cities along the Shandong Peninsula (China Oceanic Information Network, 2012) . As well as the green macroalgal bloom, the giant jellyfish Nemopilema nomurai bloom also happened in the southern Yellow Sea in summer, disappearing by October 2011. Dead macroalgae and giant jellyfish mostly sink to the seafloor and decompose, thus directly and indirectly impacting the benthos (Yamamoto et al., 2008; Lyons et al., 2014) . However, the patterns of benthos including ciliates during and after these events have never been evaluated.
In this study, we sampled for the investigation in July, during the maximum occurrence of the green macroalgal bloom, and in November, after the bloom events of the giant jellyfish. The aims of this study are (i) to investigate the distribution and community structure of benthic ciliates in the Yellow Sea during and after the macroalgal and giant jellyfish blooms; and (ii) to explore the possible effects of the blooms on benthic ciliates.
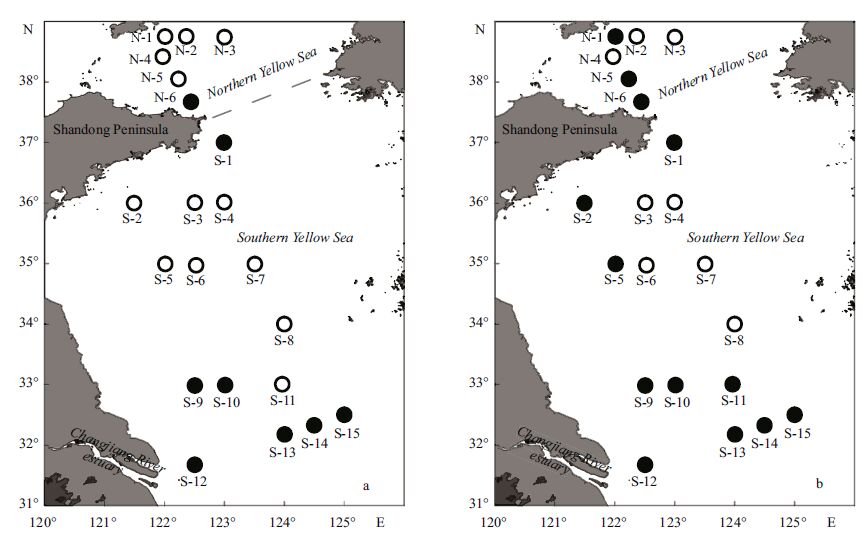
2 MATERIAL AND METHOD 2.1 Study region and environmental conditionsSediment samples were collected for the investigation of ciliates in the Yellow Sea, by R/V Kexue No . 3 between 10 and 17 July (summer) and between 11 and 17 November (autumn) 2011. A total of 21 stations were successfully collected in both seasons (Fig. 1a, b) .
|
| Figure 1 The sampling stations in the Yellow Sea in July (a) and November (b) 2011 |
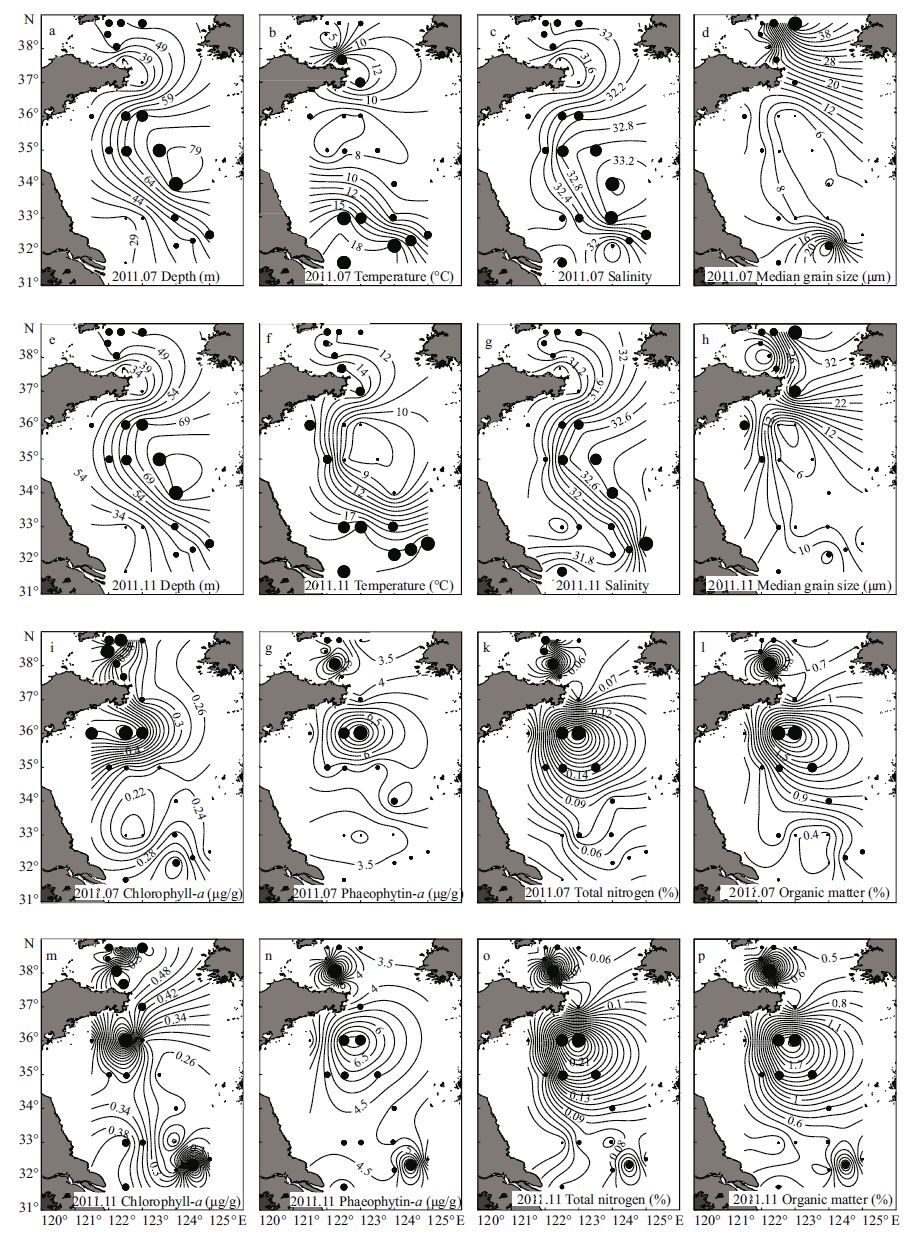
The water depth ranged from about 27 m to 80 m in the sampling area (Fig. 2a, e) . Bottom water temperature was 10.2±4.6°C (range: 4.1-18.4°C) in July and 14.2±4.4°C (range: 7.5-20.7°C) in November. Compared with that in July, bottom water temperature in November decreased in the inshore area but increased in the offshore area (Fig. 2b, f) . The YSCWM, which was delineated by a combination of temperature <12°C, salinity >32 and water depth >40 m, had already formed in July and comprised five stations in the northern Yellow Sea and eight stations in the southern Yellow Sea (Fig. 1a) . In November the YSCWM became smaller and encompassed only three stations in the northern Yellow Sea and five stations in the southern Yellow Sea (Fig. 1b) . The bottom water salinity was slightly higher in July than in November at all stations except for those near the Changjiang (Yangtze) estuary, and the salinity was higher in the offshore sea area than in coastal region (Fig. 2c, g) .
|
| Figure 2 Benthic environmental variables in the Yellow Sea in July and November 2011 |
In the surface 0-2 cm layers, the sediment was mostly fine sand. The median grain size of sediments in the southern coastal region of the Shandong Peninsula, where a large quantity of green macroalgae was observed, was close to that in the central southern Yellow Sea in July (Fig. 2d) , while in November the median grain size decreased obviously from inshore to offshore areas (Fig. 2h) . Both chlorophyll-a (Chl-a) and phaeophytin-a (Ph-a) concentrations decreased with increasing sediment depth. High Chl-a concentrations were obvious in the southern coastal region of the Shandong Peninsula in July (Fig. 2i) , while in November the high values decreased and concentrated at station S-3 in the YSCWM (Fig. 2m) . The total nitrogen contents were high in the YSCWM (Fig. 2k, o) . The organic matter had the same distribution pattern as total nitrogen contents (Fig. 2l, p) .
A paired t-test indicated that the bottom water temperature was significantly lower and the bottom water salinity was significantly higher in July than in November in the Yellow Sea (P<0.01) . In the two seasons, independent t -tests indicated that the bottom water temperature was significantly lower (P<0.01) and the total nitrogen contents of sediments were significantly higher (P<0.05) in the YSCWM than its surrounding area. In July, the sediment Chl-a and Ph-a concentrations were significantly higher in the YSCWM than its surrounding area (P<0.05) , and the temperature was significantly lower and the median grain size of sediments was significantly higher in the northern than the southern Yellow Sea (P<0.05) . In November, the bottom water salinity and sediment organic matter content were significantly higher in the YSCWM than its surrounding area (P<0.05) .
2.2 Sample collection and preservationUsing a 0.1-m 2 modified Gray-O’Hara box corer, three replicates of sediment samples were randomly collected from each station. Three replicates of samples of ciliates were collected from the upper 8 cm of sediment using cut-offdisposable syringes (inner diameter 23 mm) . In the field, the sediment was extruded through the bottom of the cores, and sliced into 0-2, 2-5 and 5-8 cm depth layers, and immediately fixed with an equal volume of ice-cold 4% glutaraldehyde (Hamels et al.,2005; Meng et al.,2012) .
2.3 Counts and identification of ciliatesCiliates were analyzed following the Ludox-QPS method described by Xu et al. (2010) . Roughly, ciliates were quantitatively extracted from sediments with Ludox HS 40 density centrifugation, prepared with the quantitative protargol stain, and analyzed under a Leica DM4500B microscope at 200×-1 000× magnifications. Identification of ciliates was based on relevant literature (Lynn and Small, 2002; Song et al.,2009) . The cell sizes of ciliates were measured and their biovolumes were estimated based on their geometrical shapes. The biovolumes were converted to carbon biomass assuming a conversion factor of 200 fg C/μm 3 for aldehyde fixed protozoa (Børsheim and Bratbak, 1987; Sherr and Sherr, 1993; Hamels et al.,2005) .
Based on their food preferences, which were derived either from the literature (Fenchel, 1968) or from our own observations on the contents of food vacuoles, benthic ciliates were classified into four functional groups: bacterivores, carnivores, algivores and omnivores. Bacterivorous ciliates encompass those that feed primarily or entirely on bacteria. Only ciliate taxa that feed mainly on microphytobenthos in particular diatoms were defined as algivores. Carnivores are those that feed mainly on other protozoa including heterotrophic flagellates and ciliates and even small metazoans. Omnivores are those ciliates that graze on a variety of food sources that may include bacteria, microphytobenthos and protozoa.
2.4 Statistical analyses and graphicsThe ArcGIS 10.2 (Esri Inc., USA) was employed to detect the existence of spatial autocorrelation for the ciliate community parameters (ArcGIS 10.2 Help, 2014) . Only the spatial pattern of Pielou evenness in July 2011 had a significant and positive spatial autocorrelation (Moran’s I =0.241, P =0.016) . Since the abundance, biomass and other diversity indices of ciliates in July and November 2011 all had no significant spatial autocorrelation (P >0.05) , the statistical methods assuming independence were used in this study.
The CLUSTER analysis and SIMPROF test in PRIMER 6 package (Plymouth Marine Laboratory) were used to divide ciliate communities at all stations into different groups. ANOSIM was utilized to test differences between the ciliate community compositions in different groups. DIVERSE was used to calculate species number, Margalef, Shannon- Wiener and Pielou diversity indices of ciliates. The relationship between the environmental factors and the biomass of ciliates was carried out using BIOENV procedure (Clarke and Gorley, 2006) . The t -test and the Spearman correlation analysis between the biotic and abiotic factors were estimated using the SPSS software (version 19.0, SPSS Inc.) . Data were log (x +1) transformed to fit the assumptions of normality and homogeneity of variances. The distribution maps of stations, environmental factors and diversity indices of ciliates were drawn by Surfer 11 (Golden Software Inc., USA) . The ArcGIS 10.2 was used to draw the distribution maps of the groups and feeding types of ciliates.
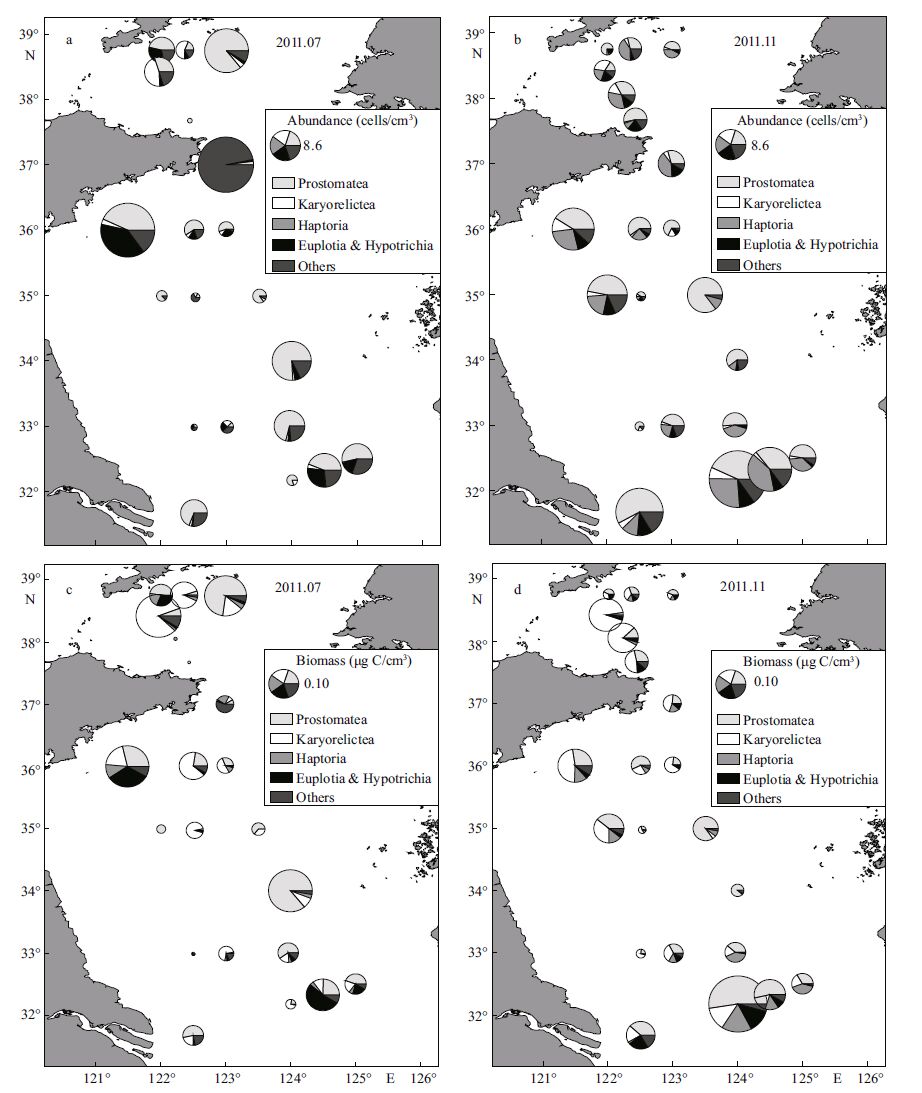
3 RESULT 3.1 The standing crops and distribution of ciliatesIn July, the abundance of ciliates was 7±8 cells/cm 3 and biomass was 0.08±0.08 μg C/cm 3 in the upper 8 cm of sediment. Ciliates had high standing crops in the northern Yellow Sea, and in the inshore area off the southern Shandong Peninsula (Fig. 3a, c) , where large numbers of green macroalgae accumulated during the study. The highest abundance was 29 cells/ cm 3 at station S-1 near the Shandong Peninsula, and the lowest was 0.13 cells/cm 3 at station N-5. The lowest (8.80×10 -4 μg C/cm 3 at station N-6) and the highest (0.24 μg C/cm 3 at station N-4) biomass were both found in the northern Yellow Sea. The mean abundance was 6 ± 7 cells/cm 3 and biomass was 0.10± 0.10 μg C/cm 3 in the northern Yellow Sea, and those in the southern Yellow Sea were 8 ± 9 cells/cm 3 and 0.07 ± 0.07 μg C/cm 3, respectively. The mean abundance was 7 ± 8 cells/cm 3 and biomass was 0.10± 0.09 μg C/cm 3 in the YSCWM, and those in area surrounding the YSCWM were 7 ± 9 cells/cm 3 and 0.04 ± 0.04 μg C/cm 3, respectively. Independent t - tests indicated the abundance and biomass of ciliates had no significant difference between different compartments of the Yellow Sea.
|
| Figure 3 Abundance and biomass as well as group composition of ciliates in July (a and c) and November (b and d) 2011 |
In November, the abundance of ciliates was 8.8 cells/cm 3 and biomass was 0.08±0.09 μg C/cm 3 in the upper 8 cm of sediment. A paired t -test indicated that neither the abundance nor the biomass had significant difference between seasons. The abundance and biomass of ciliates were high in the sea areas off the Shandong Peninsula and the Changjiang estuary, where a large quantity of jellyfish was observed in August (Fig. 3b, d) . The highest abundance (31 cells/ cm 3) and biomass (0.42 μg C/cm 3) were both found at station S-13 near the Changjiang estuary. The lowest abundance was 1 cell/cm 3 at station S-9 in the north of the Changjiang estuary. The lowest biomass (6.87×10 - 3 μg C/cm 3) was found at station S-6. The mean abundance was 4 ± 2 cells/cm 3 and biomass was 0.06± 0.05 μg C/cm 3 in the northern Yellow Sea, and corresponding values in the southern Yellow Sea were 10± 9 cells/cm 3 and 0.09 ± 0.10 μg C/cm 3, respectively. The mean abundance was 4 ± 3 cells/cm 3 and biomass was 0.05 ± 0.05 μg C/cm 3 in the YSCWM, and those in the area surrounding the YSCWM were 11 ± 9 cells/ cm 3 and 0.10 ± 0.10 μg C/cm 3, respectively. Consistent with that in July, independent t-tests indicated the abundance and biomass of ciliates also had no significant difference between different compartments of the Yellow Sea.
A CLUSTER analysis based on the biomass of ciliates classified the stations in July into five groups at a 7.35% similarity level (SIMPROF test, P =0.033) : stations N-5 and S-1 each as a distinct group, stations N-6 and S-9, S-3 and S-6 respectively gathered into two groups and other stations clustered as a group. In November, the CLUSTER analysis did not classify the stations into groups with significant differences. An ANOSIM analysis revealed the ciliate community composition had no significant differences between July and November, or between different parts of the Yellow Sea.
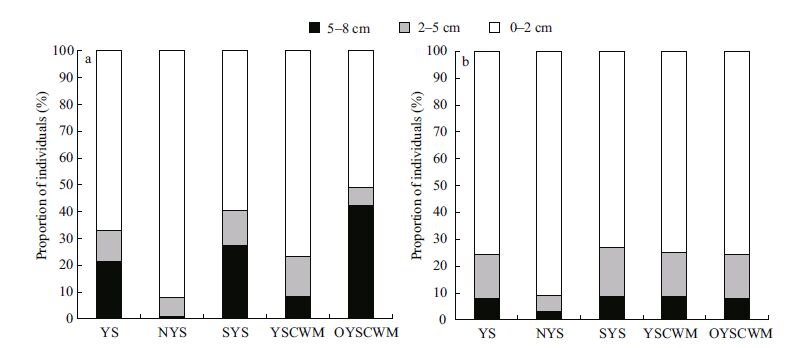
With increasing sediment depth, the abundance and biomass of ciliates generally decreased. Approximately 67% of ciliates were observed in the 0.2 cm sediment layers, 12% in the 2-5 cm layers and 21% in the 5-8 cm layers in July (Fig. 4a) . High abundance of Chilodonella cf. uncinata (29 cells/ cm 3) and Orthotrochilia sp. (35 cells/cm 3) occurred in the 5-8 cm sediment layer at station S-1, leading to a rather high proportion of individuals in this layer in the southern Yellow Sea as well as in area outside the YSCWM (Fig. 4a) . In November, ciliates tended to distribute in the surface sediments, with proportions reaching approximately 76% in the 0-2 cm sediment layers, 16% in the 2-5 cm layers and 8% in the 5-8 cm layers (Fig. 4b) . The vertical distributions were similar in different compartments of the Yellow Sea, except the proportion in the 0-2 cm sediment layers was relatively high in the northern Yellow Sea in November (Fig. 4b) .
|
| Figure 4 The vertical distribution of ciliates in the Yellow Sea in July (a) and November (b) 2011 |
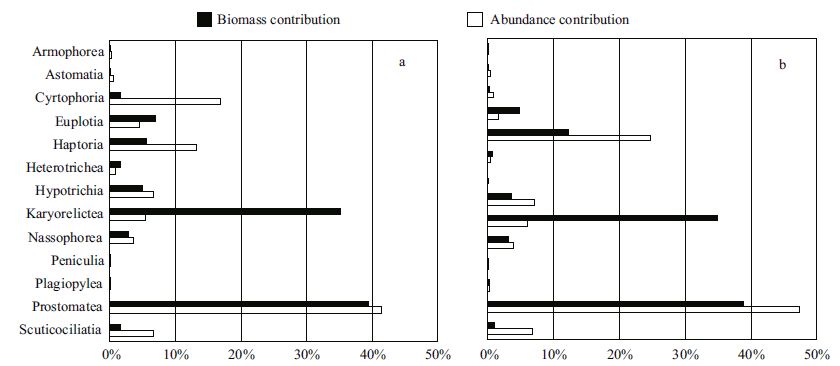
A total of 249 species of ciliates were identified, belonging to 14 classes/subclasses and 73 genera. Haptorians were the most abundant group comprising 70 species, followed by prostomateans (54 species) , scuticociliates (27 species) , hypotrichs (24 species) and karyorelicteans (20 species) . In the two seasons, prostomateans were both the most dominant group contributing 39% of the total biomass and 41%-47% of the total abundance, followed by karyorelicteans which contributed 35% of the total biomass in spite of their merely 5%-6% of the total abundance (Fig. 5a, b) . In July, euplotians was the third most important group in biomass and the second most abundant group (Fig. 5a) . In November, haptorians was the second most abundant group with high biomass (Fig. 5b) . The proportion of euplotians and hypotrichians was relatively high in the inshore area off the southern Shandong Peninsula and in the offshore area of the Changjiang estuary in July (Fig. 3a, c) . Compared with those in July, the proportions of haptorians increased at most stations in the southern Yellow Sea in November (Fig. 3b, d) .
|
| Figure 5 Proportions of ciliate major groups in abundance and biomass in July (a) and November (b) 2011 |
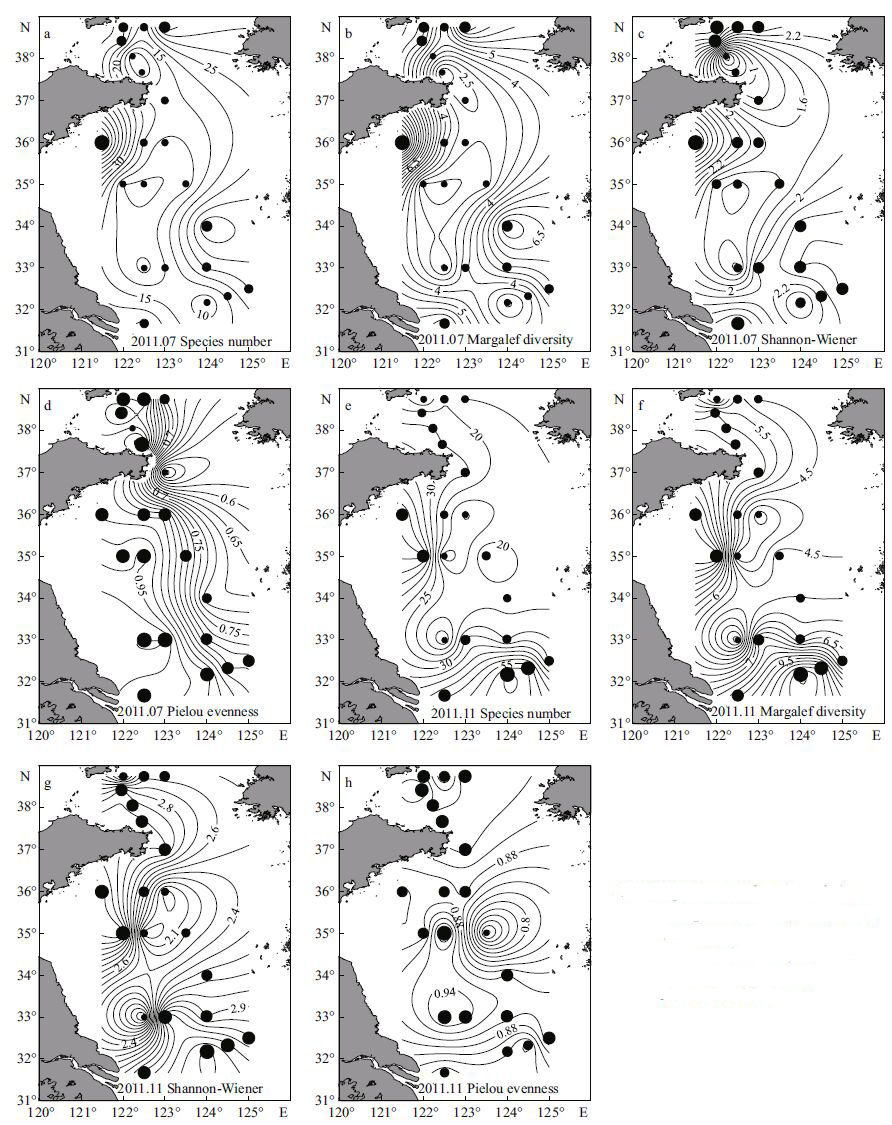
The average number of species was 19 (range: 1-72) in July, and was high in the inshore area off the Shandong Peninsula and low in the central southern Yellow Sea (Fig. 6a) . In November, the average number of species increased to 28 (range: 5-66) , and the species number near the Changjiang estuary was high (Fig. 6e) . The average value of Margalef diversity index was 4.6 (range: 1.4-12.6) in July (Fig. 6b) , and increased to 6.3 (range: 2.1-12.1) in November (Fig. 6f) . The Margalef and Shannon-Wiener indices showed similar patterns with the species number in both seasons, with high values in the inshore area as well as in area near the Changjiang estuary (Fig. 6c, g) . The average value of Shannon-Wiener index was 2.1 (range: 0-3.8) in July and 2.8 (range: 1.6-3.5) in November. The Pielou evenness index values showed rather low variation, and were about 0.86 (range: 0.45-1) in July and 0.89 (range: 0.68-1) in November (Fig. 6d, h) .
|
| Figure 6 Species number (a and e) , Margalef (b and f) , Shannon-Wiener (c and g) and Pielou evenness (d and h) indices of ciliates in July and November 2011 |
According to the paired t-test, the species number and all the index values except of Pielou index were significantly higher in November than in July (P<0.05) . In November, the independent t-test indicated that the Margalef and Shannon-Wiener diversity index values were significantly higher in the area outside the YSCWM than in the YSCWM (P<0.05) . There was no difference between the northern and southern Yellow Sea in either season.
According to the abundance and number of ciliate species at each station, curves were drawn to show the relationship of the two. In the two seasons, the two relationships fitted a power-function model (Fig. 7a, b) . With increasing abundance at each station, the ciliate species number increased. The major exception occurred at station S-1, where the species number was rather low in July, while the abundance peaked due to the mass occurrence of Chilodonella cf. uncinata and Orthotrochilia sp.

|
| Figure 7 The relationship between ciliate abundance and number of species in July (a) and November (b) 2011 |
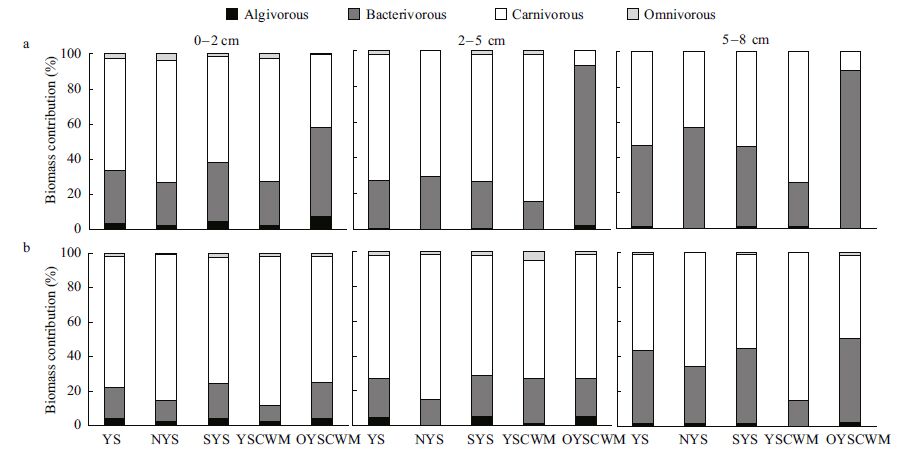
Among the 249 ciliate morphospecies identified, 117 species were classified as carnivores, 95 as bacterivores, 22 as algivores and 15 as omnivores. The carnivores mainly included haptorians, the prostomatean Holophrya spp. and some karyorelicteans. In the upper 8 cm of sediments, carnivorous ciliates accounted for 45% of the total abundance and 65% of the total biomass in July, while in November the proportions increased to 59% and 74%, respectively. The bacterivores were mainly composed of Metacystis spp., Euplotes spp. and members of scuticociliates, contributing 49% of the total abundance and 30% of the total biomass in July, while in November the proportions decreased to 34% and 20%, respectively. The algivores mainly involved members of cyrtophorians and nassophoreans and accounted for merely 4% of the total abundance and 3% of the total biomass in July, and 6% and 4%, respectively, in November. The omnivores contributed only 2% of the total abundance and biomass in July and November. Generally, with increasing sediment depth, the relative biomass contribution of carnivorous ciliates decreased, while that of bacterivores increased (Fig. 8a, b) .
|
| Figure 8 Relative contribution of the four trophic types to ciliate biomass in the three sediment layers of the 21 sampling stations in July (a) and November (b) 2011 |
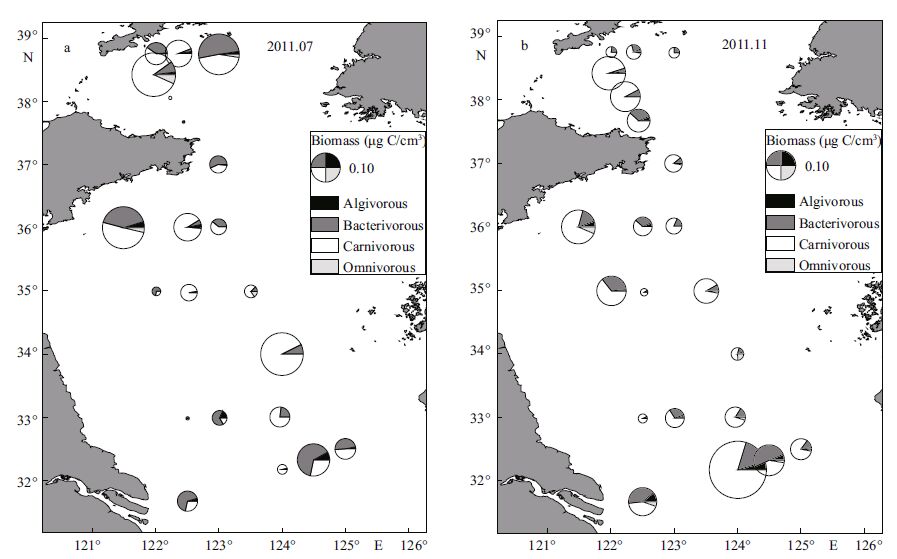
In July, carnivores constituted the most important trophic type in biomass in the northern and southern Yellow Sea as well as in the YSCWM, and were followed by bacterivores, while in the area outside the YSCWM bacterivores constituted the primary type in biomass, followed by carnivores; high biomass of bacterivores occurred near the Changjiang estuary and inshore stations (Fig. 9a) . In November, carnivores and bacterivores were respectively the first and second most important types in each compartments of the Yellow Sea (Fig. 9b) .
|
| Figure 9 Biomass partitioning of the four trophic types of ciliates in sediments of the Yellow Sea in July (a) and November (b) 2011 |
parameters and environmental factors In July, Spearman correlation analyses showed no significant correlation between the ciliate community parameters and environmental factors. In November, Spearman correlation analyses showed that the ciliate abundance (R =0.54, P<0.05) , biomass (R =0.45, P<0.05) , species number (R =0.62, P<0.01) , and Margalef (R =0.73, P<0.01) and Shannon-Wiener indices (R =0.57, P<0.01) all had significantly positive correlations with the bottom water temperature. The Margalef (R =-0.74, P<0.01) and Shannon-Wiener indices (R =-0.45, P<0.05) had significantly negative correlations with water depth. In both seasons, all the diversity indices except the Pielou evenness were positively correlated with both ciliate abundance and biomass (P<0.01) . The Pielou evenness was negatively correlated with ciliate abundance (R = -0.57, P<0.01) in November.
A BIOENV analysis revealed that in July the biomass of ciliates had the highest correlation with a combination of bottom water temperature and Chl-a concentrations (R =0.184, P =0.033) , and in November with a combination of bottom water temperature and total nitrogen contents (R =0.245, P =0.006) .
4 DISCUSSION 4.1 Distribution and community structure ofbenthic ciliates in July The macroalgal bloom may have had a positive effect on ciliates in July 2011, as indicated by the comparatively high standing crops in the inshore area off the southern Yellow Sea, where a large quantity of green macroalgae was seen. In June 2007 when no macroalgal bloom occurred, the average abundance of ciliates was approximately 1.8 times higher in the northern than the southern Yellow Sea, and the average biomass was about 1.6 times higher (Meng et al.,2012) . The biomass ratio still attained a value 1.5 times higher in the northern than the southern Yellow Sea in July 2011, and also in June 2007. By contrast, the abundance ratio in the southern Yellow Sea was about 1.3 times higher than in the northern part, indicating that smaller ciliates dominated the community in July. The high abundance of ciliates was mainly contributed by small, opportunistic bacterivores, such as Metacystis spp., Euplotes spp. and scuticociliates (Fig. 5a) . As such the abundance proportion of bacterivores in the Yellow Sea increased from about 30% in June 2007 to about 49% in July 2011, and the biomass proportion increased from about 21% to 30% (Meng et al., 2012) . In the inshore area where a large amount of green macroalgae occurred, the biomass proportion of bacterivorous ciliates even reached 57% at station S-1 and 41% at station S-2 (Fig. 9a) . The increase in the proportion of bacterivores might be a response to the deposition and degradation of macroalgae, which may stimulate detritic trophic webs within the sediments (Bohórquez et al.,2013) .
The macroalgal bloom seemingly resulted in an increase of the ciliate diversity because the species number as well as the Margalef, Shannon-Wiener and Pielou diversity indices were highest in the inshore area off the southern Shandong Peninsula and decreased from the inshore area towards the offshore area. This pattern is different from that in June 2007, when highest diversity occurred in the western area of the northern Yellow Sea and in the southern area of the southern Yellow Sea (Meng et al., 2012) . Nonetheless, the average species number in the southern Yellow Sea was lower in July 2011 than in June 2007 (18 vs. 31) . As indicated by the power function relationship between the ciliate abundance and the number of species (Fig. 5a) , the relatively lower species number in July 2011 was probably due to the relatively lower ciliate abundance (8 cells/cm 3 in July 2011 vs. 26 cells/cm 3 in June 2007) , which made rare species less likely to be detected. This may also explain the high number of species in the inshore area influenced by the macroalgal bloom. Thus, it is still premature to conclude whether the effect of macroalgal bloom on ciliate diversity is positive or negative at the current state of knowledge.
Water temperature has been demonstrated as an important factor shaping the distribution of benthic microorganisms (Dietrich and Arndt,2000; Hamels et al.,2005; Du et al.,2012) . The BIOENV analysis revealed that ciliate communities were mainly regulated by the bottom water temperature and Chl-a concentrations in July. Since the standing crops of the microphytobenthos were low in the inshore area in July 2011 (authors’ unpubl. data) , the high Chl-a concentrations in sediments in this area may have been due to the decomposition of green macroalgae, which stimulated the growth of ciliates. Nonetheless, the average biomass of ciliates in the southern Yellow Sea was lower in July 2011 than in June 2007 (0.07 μg C/cm 3 vs. 0.08 μg C/cm 3) . This relatively lower ciliate biomass can be partly ascribed to the lower bottom water temperature in July 2011 (11.4°C) than in June 2007 (13.3°C) . No significant difference could be seen in the ciliate community structure between the YSCWM and its surrounding area, though the two compartments were significantly different in their bottom water temperature and Chl-a, Ph-a and total nitrogen contents. The non-significance was likely not a result of the macroalgal bloom because in June 2007 when no macroalgal bloom occurred, the ciliate communities had also no significant difference between the two compartments (Meng et al., 2012) . The data indicate the YCSWM has no decisive effect on the distribution and community structure of ciliates, which might be regulated by a combination of multiple variables.
4.2 Distribution and community structure ofbenthic ciliates in November In November 2011, the abundance and biomass of ciliates were high in the sea areas off the Shandong Peninsula and Changjiang estuary, where a large quantity of jellyfish was observed in August. Compared with that in the southern Yellow Sea in July 2011, the average biomass of benthic ciliates increased by about 28% in November. However, neither the ciliate abundance nor the biomass had significant difference between seasons, or between different compartments of the Yellow Sea. By contrast, the species number as well as the main diversity index values in the southern Yellow Sea greatly increased in November compared with those in July. The species number as well as the Margalef and Shannon-Wiener diversity index values was high in the sea areas off the Shandong Peninsula and Changjiang estuary. The increase of species diversity may also be a result of the positive correlations between the diversity indices and abundance as well as biomass, as explained above.
The BIOENV analysis indicated that ciliates in November were regulated mainly by the total nitrogen content and bottom water temperature. The average total nitrogen content in November 2011 increased 23% relative to that in July in the southern Yellow Sea. The increase of total nitrogen content could have resulted from the decomposition of dead jellyfish, which sink to the seafloor after death and result in large and concentrated release of nutrients (West et al., 2009) . Meanwhile, the average bottom water temperature in the southern Yellow Sea increased from 11.4°C in July to 14.8°C in November. The decomposition of jellyfish and the increased bottom water temperature may both have induced the increase of ciliate standing crops.
In consistent with the composition in June 2007, carnivorous ciliates constituted the primary feeding type in terms of biomass as well as species richness, followed by bacterivores, algivores and omnivores in July and November 2011. Besides, prostomateans and karyorelicteans consistently constituted the first and second most important groups of ciliates in biomass. This is more likely a characteristic pattern of ciliate community in the offshore sediments of the Yellow Sea. Carnivorous ciliates are defined by Pratt andCairns (1985) as predators or raptors for ciliates that feed primarily on other non-photosynthetic protozoa or higher taxa, and usually function in regulating the community structure of heterotrophic protists and even of some small metazoans (Muylaert et al., 2000) . Compared with that in July 2011, the relative biomass contribution of carnivores to total ciliates increased, while that of bacterivores decreased in different compartments of the Yellow Sea in November. The rise in carnivores may be due to the substantial increase of haptorians, which are typically rapacious ciliates. Thus, carnivorous ciliates constituted the primary trophic type at all stations in November, while in July bacterivores constituted the primary type at certain stations near the Changjiang estuary and inshore area. The increasing dominance of carnivorous ciliates is likely a response to the increase of predominant heterotrophic nanoflagellates in the sediments of the Yellow Sea. The latter situation might be ascribed to the subsequent effects of the green macroalgal and giant jellyfish blooms.
5 CONCLUSIONWe investigated the distribution and community composition of benthic ciliates in the Yellow Sea in July and November 2011. In July, ciliates had high standing crops and diversity in the northern Yellow Sea and in the inshore area off the southern Shandong Peninsula; in November, the abundance, biomass and diversity of ciliates were high in the sea areas off the Shandong Peninsula and Changjiang estuary. In both seasons, prostomateans and karyorelicteans consistently constituted the first and second most important ciliate groups in biomass; carnivorous ciliates constituted the primary feeding type in terms of biomass as well as species richness, followed by bacterivores, algivores and omnivores. The proportion of bacterivorous ciliates increased as the result of the decomposition of green macroalgae in July. The increasing dominance of benthic carnivorous ciliates in November is likely a response to the increase of predominantly heterotrophic nanoflagellates, which might be ascribed to the subsequent effects of the green macroalgal and giant jellyfish blooms in the Yellow Sea.
6 ACKNOWLEDGEMENTThe CTD data were provided by conducting group of the Open Research Cruise offshore China by R/V Kexue No . 3, IOCAS. We thank Dr. ZHAO Feng and Dr. YU Tingting for their assistance in sampling, and Ms. LI Ju for help in measurement of environmental factors.
| ArcGIS 10.2 Help, 2014. Spatial Autocorrelation (Global Moran's I) (Spatial Statistics). Esri Release, 26 . |
| Bohórquez J, Papaspyrou S, Yúfera M, van Bergeijk S A, García-Robledo E, Jiménez-arias J L, Bright M, Corzo A, 2013. Effects of green macroalgal blooms on the meiofauna community structure in the Bay of Cádiz. Marine Pollution Bulletin, 70 (1-2) : 10 –17. Doi: 10.1016/j.marpolbul.2013.02.002 |
| Børsheim K Y, Bratbak G, 1987. Cell volume to cell carbon conversion factors for a bacterivorous Monas sp. enriched from seawater. Marine Ecology Progress Series, 36 (2) : 171 –175. |
| Calbet A, Saiz E, 2005. The ciliate-copepod link in marine ecosystems. Aquatic Microbial Ecology, 38 (2) : 157 –167. |
| China Oceanic Information Network. 2012. China Bulletin of Marine Disasters in 2011. State Oceanic Administration |
| Release, 9 July 2012, http://www.nmdis.org.cn/gongbao/nrzaihai/nr2011/201207/t20120709_23174.html. Accessed on 2015-03-09. |
| Clarke K R, Gorley R N. 2006. PRIMER v6: User Manual/Tutorial. 2nd edn. PRIMER-E Ltd, Plymouth. 189p. |
| Dietrich D, Arndt H, 2000. Biomass partitioning of benthic microbes in a Baltic inlet: relationships between bacteria, algae, heterotrophic flagellates and ciliates. Marine Biology, 136 (2) : 309 –322. Doi: 10.1007/s002270050689 |
| Du Y F, Xu K D, Warren A, Lei Y L, Dai R H, 2012. Benthic ciliate and meiofaunal communities in two contrasting habitats of an intertidal estuarine wetland. Journal of Sea Research, 70 : 50 –63. Doi: 10.1016/j.seares.2012.03.004 |
| Epstein S S, 1997. Microbial food webs in marine sediments. I. Trophic interactions and grazing rates in two tidal flat communities. Microbial Ecology, 34 (3) : 188 –198. |
| Fenchel T, 1968. The ecology of marine microbenthos II. The food of marine benthic ciliates. Ophelia, 5 (1) : 73 –121. |
| Fenchel T, 2008. The microbial loop-25 years later. Journal of Experimental Marine Biology and Ecology, 366 (1-2) : 99 –103. Doi: 10.1016/j.jembe.2008.07.013 |
| Hamels I, Muylaert K, Sabbe K, Vyverman W, 2005. Contrasting dynamics of ciliate communities in sandy and silty sediments of an estuarine intertidal flat. European Journal of Protistology, 41 (4) : 241 –250. Doi: 10.1016/j.ejop.2005.02.002 |
| Hamels I, Sabbe K, Muylaert K, Vyverman W, 2004. Quantitative importance, composition, and seasonal dynamics of protozoan communities in polyhaline versus freshwater intertidal sediments. Microbial Ecology, 47 (1) : 18 –29. Doi: 10.1007/s00248-003-2011-x |
| Kuipers B R, de Wilde P A W J, Creutzberg F, 1981. Energy flow in a tidal flat ecosystem. Marine Ecology Progress Series, 5 (2) : 215 –221. |
| Lynn D H, Small E B, 2002. Phylum ciliophora doflein, 1901. In: Lee J J, Bradbury P C, Leedale G F eds. An Illustrated Guide to the Protozoa. Society of Protozoologists, Lawrence, Kansas : 371 –656. |
| Lyons D A, Arvanitidis C, Blight A J, Chatzinikolaou E, Guy-Haim T, Kotta J, Orav-Kotta H, Queirós A M, Rilov G, Somerfield P J, Crowe T P, 2014. Macroalgal blooms alter community structure and primary productivity in marine ecosystems. Global Change Biology, 20 (9) : 2712 –2724. Doi: 10.1111/gcb.12644 |
| Meng Z C, Xu K D, Dai R H, Lei Y L, 2012. Ciliate community structure, diversity and trophic role in offshore sediments from the Yellow Sea. European Journal of Protistology, 48 (1) : 73 –84. Doi: 10.1016/j.ejop.2011.08.001 |
| Muylaert K, van Mieghem R, Sabbe K, Tackx M, Vyverman W, 2000. Dynamics and trophic roles of heterotrophic protists in the plankton of a freshwater tidal estuary. Hydrobiologia, 432 (1-3) : 25 –36. |
| Pratt J R, Cairns Jr J, 1985. Functional groups in the protozoa: roles in differing ecosystems. Journal of Protozoology, 32 (3) : 415 –423. Doi: 10.1111/jeu.1985.32.issue-3 |
| Sherr E B, Sherr B F, 1993. Preservation and storage of samples for enumeration of heterotrophic protists. In: Kemp P F, Sherr B F, Sherr E B, Cole J J eds. Handbook of Methods in Aquatic Microbial Ecology.. Lewis Publishers, Florida. p : 207 –212. |
| Song W B, Warren A, Hu X Z, 2009. Free-living Ciliates in the Bohai and Yellow Seas, China. Science Press, Beijing, China : 518p . |
| West E J, Welsh D T, Pitt K A, 2009. Influence of decomposing jellyfish on the sediment oxygen demand and nutrient dynamics. Hydrobiologia, 616 (1) : 151 –160. Doi: 10.1007/s10750-008-9586-7 |
| Wickham S, Gieseke A, Berninger U G, 2000. Benthic ciliate identification and enumeration: an improved methodology and its application. Aquatic Microbial Ecology, 22 (1) : 79 –91. |
| Xu K D, Du Y F, Lei Y L, Dai R H, 2010. A practical method of Ludox density gradient centrifugation combined with protargol staining for extracting and estimating ciliates in marine sediments. European Journal of Protistology, 46 (4) : 263 –270. Doi: 10.1016/j.ejop.2010.04.005 |
| Yamamoto J, Hirose M, Ohtani T, Sugimoto K, Hirase K, Shimamoto N, Shimura T, Honda N, Fujimori Y, Mukai T, 2008. Transportation of organic matter to the sea floor by carrion falls of the giant jellyfish Nemopilema nomurai in the Sea of Japan. Marine Biology, 153 (3) : 311 –317. |
| Yu F, Zhang Z X, Diao X Y, Guo J S, Tang Y X, 2006. Analysis of evolution of the Huanghai Sea Cold Water Mass and its relationship with adjacent water masses. Acta Oceanologica Sinica, 28 (5) : 26 –34. |
 2016, 34


