 2016, 34
Institute of Oceanology, Chinese Academy of Sciences
Article Information
- Lu YANG(杨璐), Jie CHEN(陈杰), Shengyun YANG(杨圣云), Huiqi ZHONG(钟慧琪), Peilong JU(鞠培龙), Shunliang YANG(杨顺良), Qinqin SUN(孙芹芹), Mingru CHEN(陈明茹)
- Niches of dominant fish in the waters surrounding the Taishan Islands, China
- Journal of Oceanology and Limnology, 34(4): 697-708
- http://dx.doi.org/10.1007/s00343-016-5047-8
Article History
- Received: Mar. 6, 2015
- Accepted: May. 27, 2015


2. Fujian Institute of Oceanography, Xiamen 361013, China;
3. Fujian Provincial Key Laboratory of Coast and Island Management Technology Study, Xiamen 361013, China
The niche of a species can be described by the set of environmental conditions (both bioticand abiotic) within which a population can persist without immigration (Hutchinson, 1957b; Martínez-Meyer et al., 2004) . Thus, a niche is bounded by the ability of a speciesto use resources in the community as manifested by its distribution and biomass (Zhang, 2004) . Niche analysis plays an importantrole in understanding the targeted population status within a community, community structure and function, intra-and interspecific relationships, biodiversity, community succession and population evolution (Zhang, 2004; Peng et al., 2009; Fisher-Reid et al., 2012) . The physical environment, resource availability and competitor presence are believed to affect the niche of a population over ecological or evolutionary time (Feinsinger et al., 1981) . Two geometric descriptors, niche breadth and niche overlap, are used to quantify a species’ability to use natural resources (Dias and Rocha, 2007) as well as a species’functional position within the community or ecosystem and community stability (Martínez-Meyer et al., 2004) .
Many theoretical explorations, including competitive coexistence, species packing and limiting similarity, have advanced our understanding of niche analyses (Grinnell, 1917; Elton, 1927; Hutchinson, 1957b; Wang et al., 1984; Silvertown, 2004) and laid a foundation for theoretical and field ecology. Based on the Simpson and Shannon-Wiener indices, Levins (1968) proposed a method for measuring niche breadth that has been widely used in the field of plant and animal ecology because of its conciseness, convenience andexplicit ecological meaning (Arlettaz et al., 2000; Peng et al., 2009; Rutishauser et al., 2012) . The Levins methodassumes that the population used all of its resources in equal proportions; however, resources are not equally abundant in most natural communities. Colwell and Futuyma (1971) modified the Levinsmethod by weighting the measurement by resource availability (Hurlbert, 1978) . Thereafter, several measurements of niche breadth were advanced that used a maximumlikelihood ratio or proportional similarity (Hurlbert, 1978; Petraitis, 1979; Feinsinger et al., 1981; Smith, 1982) . Among these, the Feinsinger method, which is based on the Proportional Similarity Index, is easy to interpret and more appropriate for ecological specialization than the Levins or Colwell-Futuyma methods (Feinsinger et al., 1981; Smith, 1982) . Furthermore, a variety of approaches and metrics have been used to measureniche overlap, such as indices of similarity (Margalef, 1956; MacArthur, 1965) or heterogeneity (Kohn, 1959; King, 1962) , symmetric models (Pianka, 1973) and informationmeasurements (Horn, 1966) .
Currently, niche analysis, including niche measurements that assess a population’s ability to divide and use resources and evaluate the variability and adaptation of niches that have different resource states and competitive relationships and include more thantwo species, has been used extensively in community studies, especially in terrestrial species or populations (Gehring and Swihart, 2003; Potts et al., 2004; Vieira and Port, 2007) . In addition, research has focused on the nichesof aquatic organisms, primarily benthic (Woodward and Hildrew, 2002) and planktonic communities (Rutherford et al., 1999; Zhao et al., 2012) . Current research on fish niches emphasizes the relationship between trophic niches and predator-prey activity (Næsje et al., 1991; Scharf et al., 2000; Colloca et al., 2010) .However, limited research is available on fish population niches (Li et al., 2013) .
The niche and habitat of a species are incorporated into species distribution and biodiversity determinations. By considering a species’ ability to use resourcesand the adaptive capacity within an environment, niche studiescould reveal the position of a species in the ecosystemand relationships between different species, which effectively connect the fish communityto the habitat and ecosystem. Although it is diffcult to distinguish accurately between the effects of niche and habitat, a better understanding of such effects can facilitate the effectivedesign of conservation measures and increase our appreciation of the wonderfulcomplexity of our biosphere.It may be misleading to establish conservation strategies that considerspecies distributionswithout considering resource-use ability or adaptive capacity (Turlure et al., 2009) and, as a result, be unable to fully use resources or effectively respond to threats.
The Taishan Islands (26°55′-27°00′N, 120°39′-120°43′E) , which are located in the East China Sea, are 30 km from the Chinesemainland in subtropical waters of depths rangingfrom 0-40 m. Two types of currents intersect around the Taishan Islands—the high-temperature/salinity KuroshioBranch and Taiwan Warm Current, and the low-temperature/ salinity Zhejiang-Fujian Coastal Current. Thus, the study area is rich in nutrientsand abundant in plankton and other food organisms, which provide optimal breeding groundsfor fish and shrimp.Furthermore, larval fish and shrimp are food organismsfor larger fish and play an importantrole in the food web of the Mindong fishingground. The study area, which is in the north central area of the Mindong fishing ground and the northernmost distribution boundary of scleractinian corals in China (Yang et al., 2014) , exhibits typicalmarine environmental and ecological features. However, to date, there is a paucity of research literature on the fishery resourcesand ecology of the area. Here, we discussthe characteristics of communitystructure and analyze the dominantfish niches withinthis area using data from four seasonal trawl surveys, which were carriedout between 2012 and 2013. The goal of the study was to determinethe community structure and function as well as inter-and intraspecific relationships among fish. In addition, the ecological niche approach considers a population’s abilityto use resources and interspecific competition that could offset deficiencies in species diversity, enrich fish ecology studies and provide a referencefor ecosystem-based management and sustainable use of fishery resourcesin this area.
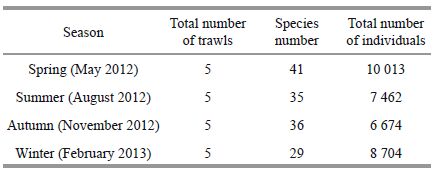
2 MATERIAL AND METHOD 2.1 SamplingFour fishery resourcesurveys were conductedin May, August and November 2012, and February 2013, and fish samples were collectedfrom five stations using a single otter trawl (Table 1) . The trawl net was 28.5 m in length with a 16-m entrance diameter and mesh sizes varying from 13 to 25 mm. The durationof each haul was 30 min at an average ship speed of 3 knots (1 knot=1.852 km/h) . To estimate the trawled area, locations were recordedvia a global positioning system (GPS) when the trawl first touched the bottom and when the winch started to haul up the net. For each trawl, samples were preliminary classified, counted and weighed on site. Specimens were frozen and further classified, measured and analyzed statistically in the laboratory.
The dominant fish were identified by the indexof relative importance (IRI) (Pinkas, 1971) :

where N is the proportionof the individual number of one species to the total number; W is the proportionof the biomass of one species to the total biomass; and F is the proportion of stations in which a species was recorded to the totalstations. Those fish with an IRI>500 were regardedas dominant species (Cheng, 2000) .
2.2.2 Measurement of nichebreadthNiche breadth was measured according to the following formula (Feinsinger et al., 1981) :
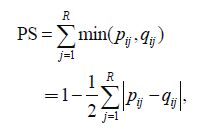
where PS is the niche breadth, pij is the proportion of individuals of species I in resource state j ( j =1, 2, …,R ) out of the total number of individuals of this species, and q ij is the proportion of resource state j available to species i out of all resource states. Here, PS values range from a minimum q ij for the narrowest possible niche (a species or population is specialized exclusively to the rarest resource state and consequently bypasses all other resource states) to a q ij of 1.0 for the broadest possible niche (a species or population uses resources in proportion to their availability) . Species were divided into three groups according to their niche breadth values: wide niche breadth species (PS=0.500-1.000) , medium niche breadth species (PS=0.300-0.500) and narrow niche breadth species (PS=0.000-0.300) (Smith, 1982; Zheng et al., 2014) .
2.2.3 Measurement of niche overlapNiche overlap was measuredby the Morisita-Horn Index (Morisita, 1971) :

where Pijand Pkjare the proportions of individuals of species i and species k in resource state j out of all the individuals of each species. When the niche overlap value was greater than 0.6, the interspecific niche overlap was considered to be significant, as suggested by Wanthne et al. (2000) . The relationships between species were divided into three groups according to their niche overlap values: high niche overlap (Oik=0.600-1.000) , medium nicheoverlap (Oik=0.300-0.600) and low niche overlap (Oik=0.000-0.300) .
2.2.4 Non-metric multidimensional scaling and cluster analysisNon-metric multidimensional scaling (NMDS) and a clusteranalysis were conductedusing interspecies Euclidean distances.
The Euclidean distancewas calculated using the following equation:

where Xijand Xkjare the fourth roots of abundances of species i and species k in resource state j, respectively.
In the NMDS analysis, stress coeffcients were used to reflect consistency betweenthe levels of similarity and relative distance:stress<0.05 indicates very high agreement, stress<0.1 indicates high agreement, stress<0.2 indicates general agreement, and stress>0.3 indicates low agreement. Statistical analyses were conducted using the PlymouthRoutines in Multivariate Ecological Research statistical software package (PRIMER 5, provided by Plymouth Marine Laboratory, Plymouth, UK) .
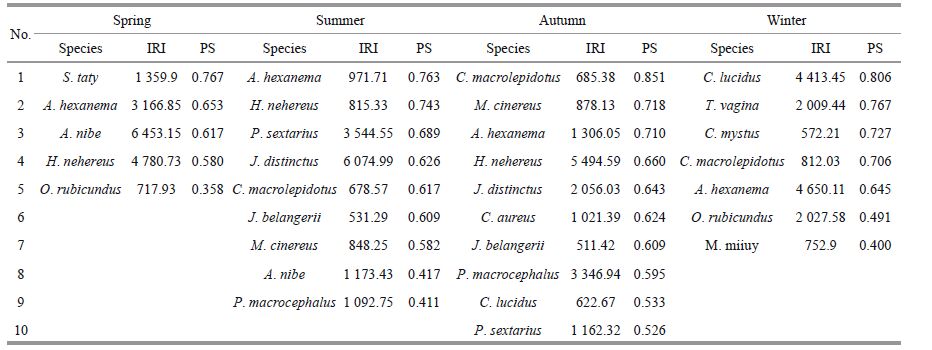
3 RESULT 3.1 Dominant fishFig. 1Eighty species of fish were identified from the 2012/2013 surveys in the waters surrounding the Taishan Islands.In spring (May 2012) , 41 species of fish were identified. Among them, Atrobucca nibe, Harpadon nehereus, Amblychaeturichthys hexanema and Setipinna taty were identified as dominant species (Table 2) , accountingfor 78.72% of the total seasonal biomass. In summer (August 2012) , 35 species were identified: Johnius distinctus, Polydactylus sextarius, A. nibe and Pennahia macrocephaluswere identified as dominant species, accounting for 85.36% of the total seasonal biomass.In autumn (November 2012) , from a total of 36 species, H.nehereus, P.macrocephalus, J. distinctus, A. hexanema, P. sextarius and Chrysochir aureus were identifiedas the dominant species, accounting for 91.73% of the total seasonalbiomass. In winter (February 2013) , 29 species were identified:A. hexanema, Collichthys lucidus, Odontamblyopus rubicundus and Trypauchen vagina were identifiedas thedominant species, accounting for 75.20% of the totalseasonal biomass. of the 16 dominant species recorded, A. hexanema was the only dominant species recorded throughout the year.

|
| Figure 1 Sampling stations of the bottom trawls conducted around the Taishan Islands between 2012 and 2013 |
|
Niche breadth values (PS) are shown in Table 2. The PS of the seasonal dominantspecies displayed a wider range in spring than in other seasons, ranging from 0.358 to 0.767. In spring, the PS of S. taty was the highest, followed by A. hexanema. In summer, PS values ranged from 0.411 to 0.763, and A. hexanema had the highestvalue, followed by H. nehereus. In autumn, PS values ranged from 0.526-0.851 and were generally higher than in other seasons.The highest PS in autumn and for the entire year was for C. macrolepidotus. In winter, the PS valuesranged from 0.400 to 0.806, and C. lucidus had the highest value, followedby T. vagina. PS values for the same species varied by season;for example, the PS values for A. hexanema were 0.653, 0.763, 0.710 and 0.645 for the four seasons, respectively. Niche breadth values were more similarbetween spring and winter and betweensummer and autumnthan for other seasonal combinations.
Based on the seasonaland annual nichebreadth values (Fig. 2) , the 16 dominant species in the study area couldbe grouped into three types: (1) wide niche breadth species (PS=0.500-0.700) , which included certain demersal or near demersal fish, such as C. macrolepidotus, A. hexanema, H. nehereus, T. vagina and O. rubicundus; (2) medium niche breadth species (PS=0.300-0.500) , which included S. taty and demersal or near demersal fish, such as J. belangerii, C. lucidus, Muraenesox cinereus, P. macrocephalus, J. distinctus and P. sextarius; in addition, niche breadth values for this group varied significantly in different seasons (PS=0.000-0.806) ;and (3) narrow niche breadth species (PS=0.150-0.300) , which includedC. mystus, a pelagic fish, and demersal or near demersal fish, such as A. nibe, C. mystus, C. aureus, Miichthys miiuy, etc.; these species were only observedin one or two seasons.

|
| Figure 2 Niche breadth of the dominant fish in the waters surrounding the TaishanIslands |
The results of NMDS analysis (Fig. 3) indicated that wide niche breadth species had the highest distribution similarity. Within the mediumniche breadth species, warm-water demersal or near demersal fish (J. belangerii, M. cinereus, P. macrocephalus, J. distinctus, P. sextarius) had more similar distributions, whereas pelagic fish (S. taty) and temperate, warm-water fish (C. lucidus) were less similar comparedwith the formertwo groups. Furthermore, narrow niche breadthspecies displayed more discrete NMDS values, which reflected a higher degree of similarity comparedwith niche breadth classifications and more accurately reflected the species distribution characteristics.

|
| Figure 3 Non-metric multidimensional scaling (NMDS) results for the dominant fish in the waters surrounding the Taishan Islands |
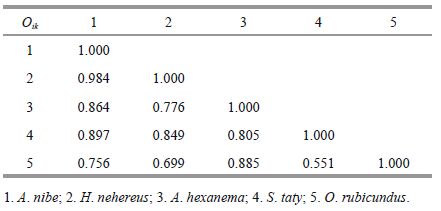
In spring, niche overlap (Oik) values between the dominant fish ranged from 0.551 to 0.984 (Table 3) with little variation. The greatest niche overlap (Oik=0.984) occurred between two near demersal carnivore species (feeding primarilyon small nekton) , A. nibe and H. nehereus, followedby A. nibe and S. taty (Oik=0.897) and A. hexanema and O. rubicundus (Oik=0.885) . The lowest niche overlap was between S. taty and O. rubicundus (Oik=0.551) .
|
In summer, niche overlap values ranged from 0.021 to 0.994 between the dominant fish (Table 4) , which displayed the greatest variation. P . macrocephalus and J. belangerii had the highest niche overlap (Oik=0.994) , followed by J.distinctus and M. cinereus (Oik=0.986) , P. macrocephalus and M. cinereus (Oik=0.966) , M. cinereus and J. belangerii (Oik=0.948) , J. distinctus and P.macrocephalus (Oik=0.944) , and J. distinctus and J.belangerii (Oik=0.926) , with each of these pairs displaying niche overlap values greater than 0.900. Therefore, niche overlap was greatest between near demersal species, such as the Sciaenidae family, and between Sciaenidae and certain demersal species, such as M. cinereus. Niche overlapvalues were relatively low betweenthe narrow niche breadthspecies A. nibe and other species, i.e. A. nibe and P. macrocephalus (Oik=0.021) , A. nibe and J. belangerii (Oik=0.028) , and A. nibe and J.distinctus (Oik=0.128) .

|
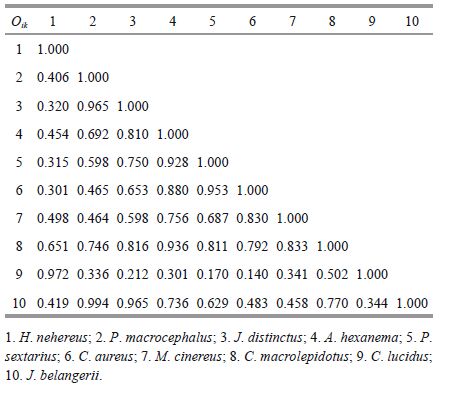
In autumn, the niche overlap values ranged from 0.140 to 0.994 (Table 5) , with the highest value observed between P. macrocephalusand J. belangerii (Oik=0.994) . Niche overlapvalues greater than 0.900 were also found for seven pairs: H. nehereus and C. lucidus (Oik=0.972) , P. macrocephalus and J. distinctus (Oik=0.965) , and J.distinctus and J. belangerii (Oik=0.965) , etc. More pairs with high niche overlapswere found in autumn than in the other seasons. The lowest nicheoverlap values were between C. lucidus and P. sextarius (Oik=0.170) and C. lucidus and C. aureus (Oik=0.140) .
|
In winter, niche overlapvalues ranged from 0.147 to 0.948 (Table 6) . The highest niche overlap occurred between A. hexanema and T. vagina (Oik=0.948) , followed by C. lucidus and C. macrolepidotus (Oik=0.925) and A. hexanema and O. rubicundus (Oik=0.911) . Most of these species are carnivorous demersal or near demersalspecies and primarilyfeed on small benthic invertebrates and benthic diatoms.C. macrolepidotus and M. miiuy had the lowest niche overlap value (Oik=0.147) .

|
Average values for seasonal niche overlaps within each pair of dominant species in the study area were calculated to obtainthe niche overlapvalues throughout the year (Table 7) . The annual niche overlap ranged from 0.000 to 0.886, with an average of 0.314. Throughout the year, there were a total of 12 species pairs with high niche overlapat Oik≥0.600, accounting for 10.00% of all pairs. High values typically occurredbetween wide niche breadth species and other species.Only two pairs had a value of Oik≥0.800: C. macrolepidotus and T. vagina (Oik=0.886) and A. hexanema and O. rubicundus (Oik=0.839) . The 48 pairs of species with medium niche overlaps (0.600≥Oik>0.300) accounted for 40.00%. Low niche overlappairs (0.300≥Oik>0.000) , most of which included one narrow niche breadth species and another species, accounted for 46.67% (56 pairs) . The proportion of non-overlapping pairs (Oik=0.000) was 3.33%. Niche overlap was not observed between S. taty and M. miiuy, A. nibe and C. mystus, A. nibe and C. aureus, or A. nibe and M. miiuy over the temporal and spatial scale of the study. In different seasons, 17 pairs were observed with overlap values of Oik≥0.900, with peak values of Sciaenidae family and, in autumn, within species of the Gobiidaefamily, revealing that high niche overlap could occurbetween certain species.

|
Figure 4 depicts the results of cluster analysisof seasonally dominant fish in the waters surrounding the Taishan Islands.Clusters were delineatedby niche breadth and niche overlap.In each season, species with wider niche breadthvalues usually clustered together, i.e., S. taty and A. hexanema in spring and A. hexanema, P. sextarius and H. nehereus in summer. Specieswith narrower niche breadth values usually clustered with those species with which they had high niche overlap, i.e., J. belangerii and P. macrocephalus insummer (PSJ. belangerii=0.609, PSP. macrocephalus=0.411, Oik=0.994) . Species with the narrowest niche breadth and low niche overlapvalues, such as O. rubicundus in spring, A. nibe in summer and M. miiuy in winter, usually had a lower degree of aggregation and larger differences in distribution comparedwith other species.
The calculation of species dominance (IRI) considersthe body weight, abundance and occurrence frequency of each species. Therefore, the relative position of a species or population in the community can be comprehensively described (Pinkas et al., 1971) . Niche breadth representsthe degree of environmental adaptation as well as the resource utilization of fish (Hutchinson, 1957a) , which determines their competitive capacity and distribution patterns (i.e., whetherthe distribution is uniform) (Pulliam, 2000) .The IRIs of C. macrolepidotus and A. hexanema were relatively high in all seasons, indicating their higher degree of dominancein the fish communities. As wide nichebreadth species, their niche breadth values were correspondingly large. Furthermore, the IRI of C. macrolepidotus was lower than that of A. hexanema, whereas the PS of the former was higher than that of the latter. This result indicates that although the abundance of A. hexanema was higher, the distribution of C. macrolepidotus was more even and allowed for increased resourceutilization.
4.2 Niche breadth and fish ecologyNiche breadth refers to the summationof resources used by a population in a communityand depends on habitat heterogeneity and species adaptability to the environment and capacity to use resources. Therefore, niche breadth can be applied to measure a population’s utilization capacity withindiverse environments and stability in the community (Williamson, 1957; Smith, 1982) . Accordingto the NMDS analysis, in conjunction with niche breadthand feeding habits, the dominant fish in the waters surrounding the Taishan Islands could be classified into three types: wide niche breadth species, medium niche breadth species and narrow niche breadth species. Those species with a large number of individuals and vast resource utilization generally had a wider niche breadth, indicating their greater adaptivecapacity in relation to diversified habitats and resources (Brown, 1984) . Thus, they tended to be competitive generalists, whereas a species with a narrow niche breadth would be termeda specialist.
In our study, the wide niche breadth species were usually demersalfish with a lower swimming capability (Chen and Yang, 2013) , such as C. macrolepidotus, A. hexanema, T. vagina and O. rubicundus. These fish were observed in all seasons and distributed uniformly at all stations. During the same period, species with a wider niche breadth could easily surmountthe ecological limitations to their growth and distribution (Xu et al., 2012) , which enabled them to occupya wider area compared with species with a narrowerniche breadth.
Over different seasons, the niche breadth of narrow niche breadth species, such as A. nibe, C. mystus and M. miiuy, could change dramatically. For example, M. miiuy, which forages around the Taishan Islandsin autumn and winter, was distributed widely in the study area and displayeda wide niche breadth;thus, these results reveal adaptations to the eco-environment over this time period. In spring, the populationmigrates from the Taishan Islands to the Niushan fishing ground (located southwestof the Taishan Islands) for breeding in April and May. Therefore, the niche breadth of M.miiuy narrowed within the study area, which indicates that a niche is a synthesisof species or population adaptations to environmental factors (Hutchinson, 1957b) . Within a specific area, the niche breadth of fish may change along with their ecological habits and adaptability to environmental changes.
4.3 Niche overlapand niche specializationNiche overlap can represent similarenvironmental adaptationsand resource utilization capacities within differentspecies or populations and the extent to which population distributions co-occur (Wang, 1997; Silvertown, 2004) . Niche overlapsare related to niche specialization, includingdifferentiation in habitats, territories, feedinghabits, and physiological and physical features (Woodward and Hildrew, 2002; Vieira and Port, 2007; Maci and Basset, 2009) . Niche specialization and overlap result from evolutionand natural selection (Tokeshi and Schmid, 2002) .
Our research indicated that species with higher niche overlap usually had more similar ecological habits, which was observedwithin C. macrolepidotus, T. vagina, A. hexanema and O. rubicundus as well as within J. distinctus, P. macrocephalus and J. belangerii. Species in the former group are all demersal sedentary species, lacking a strong swimming capability, that feed on benthic invertebrates (e.g., polychaetes and crustaceans) , and species in the latter group are all warm-water fish living on or near the bottom and feedingpreferentially on the benthos.
When niches overlap, interspecific competition might occur between species.In this study, species with high niche overlapwere observed to co-occur in the same area with fish that displayedhigh IRIs, which may be explained as follows:
(1) Gause (1934) suggested that if two competing species could co-occur in a communityfor a long period, then theymight evolve differences to minimize competition. For example, although the species mentioned above were all feeding on benthic invertebrates, their priority food organismswere different. The priority food organismsof A. hexanema were Calanus sinicus, Leucon sp. and Gammarus sp., whereas those of O. rubicundus were Harpacticoida, Nereis and Leucon sp., etc. A. hexanema and O. rubicundus displayed subtle differentiation in feeding habits to reduceinterspecific competition;
(2) Scientists have reported that niche overlapmay not lead to interspecific competition when common resources are suffcient (Losos, 1996; Shi et al., 2014) ; although, if resources are insuffcient, competitive exclusion may occur (Cáceres and Machado, 2013) . The studyarea is locatedat a convergence zone for different types of ocean currents (Fig. 5) . The Kuroshio Branch and Zhejiang-Fujian Coastal Current bring rich nutrients to the study area and provide optimal eco-environmental conditions for plankton and benthos. Thus, food organisms are abundant and equally distributed in this area with Shannon-Wiener diversity indicesgreater than 3.0. In our study, although J. distinctus, P. macrocephalus and J. belangerii share similar food organisms, they co-occur within the same area with relatively high dominance, indicating that an adequate supply of food organisms is not a major factor influencing interspecies competition for these species in this area.

|
| Figure 5 Ocean currents around the study area |
In additionto the physic-chemistry of the environment and availability of food organisms, the distribution patternsof populations are affected by predator-prey relationships, which may increaseniche overlapping (Hurlbert, 1978; Scharf et al., 2000) . Among the 16 dominantfish in our study, H. nehereus, M. cinereus and M. miiuy areat higher trophic levels. H. nehereus, primarily preys upon H. nehereus, J. belangerii and A. hexanema (Pan and Cheng, 2011) , and J. belangerii primarily preys on A. hexanema, S. taty and O. rubicundus (Li et al., 2009) . From niche overlap values, it was found that the pairs H. nehereus and J. belangerii (Oik=0.435) , J. belangerii and A. hexanema (Oik=0.500) , and J. belangerii and S. taty (Oik=0.538) followed the same spatial pattern.
4.4 Niche study and ecosystem-based managementA better understanding of how a species or population uses resourcesor adapts to the environmenton different niche axes can facilitatepredictions on species or population reactions to changes in habitat, thereby enablingbetter planning of conservation measures. The Taishan Islands are distant from the mainland and not significantly influenced by human activities or continental runoff. As a consequence, ecosystem resilience is relatively high and the eco-environment of the study area providesan important habitat for marine organisms, especially fishery resources. The study area is locatedin the north central region of the Mindongfishing ground (one of the most important fishing groundsin Fujian, China) . Based on an ecosystem-based management approach, the following recommendations are suggested for fish conservation.
(1) Natural habitatsplay an important role in the survival of a species;therefore, the fundamental unit in the conservation of biodiversity is not speciesbut habitat. Pressure caused by human activities primarily originates from the trawl fishery, which threatens entire bottom habitats and the survivalof certain commercial fish (e.g., croakers) . Studies, including ecologicalstudies, have rarelybeen conducted in this area, which greatly constrains conservation and management. Therefore, ecosystem-based management and adaptive management approaches should be considered when developing conservation measures. Measures that include temporal and spatial restrictionsof fishing, supervision and control of fishing gear, long-term monitoring of population dynamics, and alternative livelihood provisioning for fishermen shouldbe implemented to maintain the integrity of the ecosystem structure and function as well as the resilience of natural ecosystems.
(2) Generally, species with a wider niche breadth will have a higher environmental tolerance, and species with a narrower nichebreadth will be more sensitive to environmental changes (Gehring and Swihart, 2003) . When habitats are modified, the environment requiredfor community survivalis changed and the realized niches of endemicorganisms are constrained. Frequently, the altered niche does not permit the survival of certain species (Swihart et al., 2003) . Here, it was found that the niche breadth of migratory fish was narrower than that of settled fish, indicating that migratory fish were more sensitiveto environmentalchanges caused by human activities. Therefore, the focus should be on protecting migration pathways for important fishery resource species, especially specieswith a narrow niche breadth.
(3) The highest nicheoverlaps in our study appeared within species with similar ecological habits, such as species of the Gobiidae and Sciaenidae families. For these species, those with greater economic value can be protected by controlling fishing gear and mesh sizes. In addition to interspecific competition between nativespecies, native species may compress or modify their utilization of resources if a community is invaded by an alien species; this phenomenon is termed niche compression or niche shift. Such changes to a species niche may lead to the disappearance of local specieswithin an area (Zabin, 2009; Hahn et al., 2011) . Therefore, measures should be taken to preventchanges to and destruction of the ecological equilibrium caused by the invasion of alien species.
5 ACKNOWLEDGEMENTThe authors are gratefulto Professor LU Zhenbin of the Fisheries ResearchInstitute of Fujian and Dr. LIU Min of Xiamen University for providing valuable assistance in species identification.
| Arlettaz R, Godat S, Meyer H, 2000. Competition for food by expanding pipistrelle bat populations (Pipistrellus pipistrellus) might contribute to the decline of lesser horseshoe bats (Rhinolophus hipposideros). Biological Conservation, 93 (1) : 55 –60. Doi: 10.1016/S0006-3207(99)00112-3 |
| Brown J H, 1984. On the relationship between abundance and distribution of species. The American Naturalist, 124 (2) : 255 –279. Doi: 10.1086/284267 |
| Cáceres N C, Machado A F, 2013. Spatial, dietary and temporal niche dimensions in ecological segregation of two sympatric, congeneric marsupial species. The Open Journal of Ecology, 6 (1) : 10 –23. Doi: 10.2174/1874213001306010010 |
| Chen M R, Yang S Y, 2013. Fish Illustrations in Taiwan Strait and Its Adjacent Sea. Beijing: China Science and Technology Press. |
| Cheng J S, 2000. The structure and diversity of demersal fish communities in winter in the East China Sea and the Yellow Sea. Marine Fisheries Research, 21 (3) : 1 –8. |
| Colloca F, Carpentieri P, Balestri E, et al, 2010. Food resource partitioning in a Mediterranean demersal fish assemblage: the effect of body size and niche width. Marine Biology, 157 (3) : 565 –574. Doi: 10.1007/s00227-009-1342-7 |
| Colwell R K, Futuyma D J, 1971. On the measurement of niche breadth and overlap. Ecology, 52 (4) : 567 –576. Doi: 10.2307/1934144 |
| Dias E J R, Rocha C F D, 2007. Niche differences between two sympatric whiptail lizards (Cnemidophorus abaetensis and C. ocellifer, Teiidae) in the restinga habitat of northeastern Brazil. Brazilian Journal of Biology, 67 (1) : 41 –46. |
| Elton C S. 1927. Animal Ecology. University of Chicago Press, Chicago. 296p. |
| Feinsinger P, Spears E E, Poole R W, 1981. A simple measure of niche breadth. Ecology, 62 (1) : 27 –32. Doi: 10.2307/1936664 |
| Fisher-Reid M C, Kozak K H, Wiens J J, 2012. How is the rate of climatic-niche evolution related to climatic-niche breadth?. Evolution, 66 (12) : 3836 –3851. Doi: 10.1111/evo.2012.66.issue-12 |
| Gehring T M, Swihart R K, 2003. Body size, niche breadth, and ecologically scaled responses to habitat fragmentation: mammalian predators in an agricultural landscape. Biological Conservation, 109 (2) : 283 –295. Doi: 10.1016/S0006-3207(02)00156-8 |
| Grinnell J, 1917. The niche-relationships of the California Thrasher. The Auk, 34 (4) : 427 –433. Doi: 10.2307/4072271 |
| Gause G F. 1934. The struggle for existence. Williams and Wilkins, Baltimore, MD. |
| Hahn M W, Lang E, Tarao M, et al, 2011. Polynucleobacter rarus sp. nov., a free-living planktonic bacterium isolated from an acidic lake. International Journal of Systematic and Evolutionary Microbiology, 61 : 781 –787. |
| Horn H S, 1966. Measurement of “Overlap” in comparative ecological studies. The American Naturalist, 100 (914) : 419 –424. Doi: 10.1086/282436 |
| Hurlbert S H, 1978. The measurement of niche overlap and some relatives. Ecology, 59 (1) : 67 –77. Doi: 10.2307/1936632 |
| Hutchinson G E. 1957a. A Treatise on Limnology. Volume 1. Geography, Physics and Chemistry. John Wiley & Sons Inc, New York. 1 015p. |
| Hutchinson G E, 1957b. Concluding remarks. Cold Spring Harbor Symposia on Quantitative Biology, 22 : 415 –427. Doi: 10.1101/SQB.1957.022.01.039 |
| King C E, 1962. Some aspects of the ecology of psammolittoral nematodes in the northeastern Gulf of Mexico. Ecology, 43 (3) : 515 –523. Doi: 10.2307/1933379 |
| Kohn A J, 1959. The ecology of Conus in Hawaii. Ecological Monographs, 29 (1) : 47 –90. Doi: 10.2307/1948541 |
| Levins R. 1968. Evolution in Changing Environments: Some Theoretical Explorations. Princeton University Press, Princeton. 132p. |
| Li X S, Yu Z H, Sun S, et al, 2013. Ecological niche breadth and niche overlap of dominant species of fish assemblage in Yangtze river estuary and its adjacent waters. Chinese Journal of Applied Ecology, 24 (8) : 2353 –2359. |
| Li Z Y, Dai F Q, Zuo T, et al, 2009. Studies on food competition between Pseudosciaena polyactis and Johnius belengerii from Changjiang Estuary and adjacent southern Yellow Sea in autumn. Journal of Hydroecology, 2 (2) : 67 –72. |
| Losos J B, 1996. Phylogenetic perspectives on community ecology. Ecology, 77 (5) : 1344 –1354. Doi: 10.2307/2265532 |
| MacArthur R H, 1965. Patterns of species diversity. Biological Reviews, 40 (4) : 510 –533. Doi: 10.1111/brv.1965.40.issue-4 |
| Maci S, Basset A, 2009. Composition, structural characteristics and temporal patterns of fish assemblages in non-tidal Mediterranean lagoons: a case study. Estuarine, Coastal and Shelf Science, 83 (4) : 602 –612. Doi: 10.1016/j.ecss.2009.05.007 |
| Margalef R, 1956. Informacióny diversidad específicaenlas comunidades de organismos. Investigacion Pesquera (Barcelona), 3 : 99 –106. |
| Martínez-Meyer E, Townsend Peterson A, Hargrove W W, 2004. Ecological niches as stable distributional constraints on mammal species, with implications for Pleistocene extinctions and climate change projections for biodiversity. Global Ecology and Biogeography, 13 (4) : 305 –314. Doi: 10.1111/geb.2004.13.issue-4 |
| Morisita M, 1971. Composition of the Iδ-index. Research on Population Ecology, 13 (1) : 1 –27. Doi: 10.1007/BF02522010 |
| Næsje T F, Jonsson B, Sandlund O T, et al, 1991. Habitat switch and niche overlap in coregonid fishes: effects of zooplankton abundance. Canadian Journal of Fisheries and Aquatic Sciences, 48 (12) : 2307 –2315. Doi: 10.1139/f91-271 |
| Pan X W, Cheng J H, 2011. Feeding ecology of Harpadon nehereus in areas adjacent to Changjiang River estuary. Journal of Fishery Sciences of China, 18 (5) : 1132 –1140. |
| Peng Y S, Chen G Z, Tian G H, et al, 2009. Niches of plant populations in mangrove reserve of Qi'ao Island, Pearl River Estuary. Acta Ecologica Sinica, 29 (6) : 357 –361. Doi: 10.1016/j.chnaes.2009.09.017 |
| Petraitis P S, 1979. Likelihood measures of niche breadth and overlap. Ecology, 60 (4) : 703 –710. Doi: 10.2307/1936607 |
| Pianka E R, 1973. The structure of lizard communities. Annual Review of Ecology and Systematics, 4 : 53 –74. Doi: 10.1146/annurev.es.04.110173.000413 |
| Pinkas L, Oliphant M S, Iverson I L K, 1971. Food habits of albacore, bluefin tuna, and bonito in California waters. Fish Bulletin, 152 : 1 –105. |
| Pinkas L, 1971. Food habits study. Fishery Bulletin, 152 : 5 –10. |
| Potts M D, Davies S J, Bossert W H, et al, 2004. Habitat heterogeneity and niche structure of trees in two tropical rain forests. Oecologia, 139 (3) : 446 –453. Doi: 10.1007/s00442-004-1525-3 |
| Pulliam H R, 2000. On the relationship between niche and distribution. Ecology Letters, 3 (4) : 349 –361. Doi: 10.1046/j.1461-0248.2000.00143.x |
| Rutherford S, D'Hondt S, Prell W, 1999. Environmental controls on the geographic distribution of zooplankton diversity. Nature, 400 (6746) : 749 –753. Doi: 10.1038/23449 |
| Rutishauser M D, Bontadina F, Braunisch V, et al, 2012. The challenge posed by newly discovered cryptic species: disentangling the environmental niches of long-eared bats. Diversity and Distributions, 18 (11) : 1107 –1119. Doi: 10.1111/ddi.2012.18.issue-11 |
| Scharf F S, Juanes F, Rountree R A, 2000. Predator size-prey size relationships of marine fish predators: interspecific variation and effects of ontogeny and body size on trophicniche breadth. Marine Ecology Progress Series, 208 : 229 –248. Doi: 10.3354/meps208229 |
| Shi Y R, Chao M, Quan W M, et al, 2014. Spatial and seasonal variations in fish assemblages of the Yangtze River estuary. Journal of Applied Ichthyology, 30 (5) : 844 –852. Doi: 10.1111/jai.2014.30.issue-5 |
| Silvertown J, 2004. Plant coexistence and the niche. Trends in Ecology & Evolution, 19 (11) : 605 –611. |
| Smith E P, 1982. Niche breadth, resource availability and inference. Ecology, 63 (6) : 1675 –1681. Doi: 10.2307/1940109 |
| Swihart R K, Gehring T M, Kolozsvary M B, et al, 2003. Responses of ‘resistant' vertebrates to habitat loss and fragmentation: the importance of niche breadth and range boundaries. Diversity and Distributions, 9 (1) : 1 –18. Doi: 10.1046/j.1472-4642.2003.00158.x |
| Tokeshi M, Schmid P E, 2002. Niche division and abundance: an evolutionary perspective. Population Ecology, 44 (3) : 189 –200. Doi: 10.1007/s101440200022 |
| Turlure C, van Dyck H, Schtickzelle N, et al, 2009. Resourcebased habitat definition, niche overlap and conservation of two sympatric glacial relict butterflies. Oikos, 118 (6) : 950 –960. Doi: 10.1111/oik.2009.118.issue-6 |
| Vieira E M, Port D, 2007. Niche overlap and resource partitioning between two sympatric fox species in southern Brazil. Journal of Zoology, 272 (1) : 57 –63. Doi: 10.1111/jzo.2007.272.issue-1 |
| Wang G, Zhao S L, Zhang P Y, et al, 1984. On the definition of niche and the improved formula for measuring niche overlap. Acta Ecologica Sinica, 4 (2) : 119 –127. |
| Wang R Z, 1997. The niche breadths and niche overlaps of main plant populations in Leymus chinensis grassland for grazing. Acta Phytoecologica Sinica, 21 (4) : 304 –311. |
| Wanthne J A, Haug T, Lydersen C, 2000. Prey preference and niche overlap of ringed seals Phoca hispida and harp seals P. groenlandica in the Barents Sea. Marine Ecology Progress Series, 194 : 233 –239. Doi: 10.3354/meps194233 |
| Williamson M H, 1957. An elementary theory of interspecific competition. Nature, 180 (4583) : 422 –425. Doi: 10.1038/180422a0 |
| Woodward G, Hildrew A G, 2002. Body-size determinants of niche overlap and intraguild predation within a complex food web. Journal of Animal Ecology, 71 (6) : 1063 –1074. Doi: 10.1046/j.1365-2656.2002.00669.x |
| Xu C Y, Yu Q J, Xu F J, et al, 2012. Niche analysis of phytoplankton's dominant species in Dianshan Lake of East China. Chinese Journal of Applied Ecology, 23 (9) : 2550 –2558. |
| Yang S L, Zhao D B, Ren Y S, et al, 2014. Species composition and distribution of Scleractinian corals discovered in the East Fujian waters. Journal of Applied Oceanography, 33 (1) : 29 –37. |
| Zabin C J, 2009. Battle of the barnacle newcomers: niche compression in invading species in Kaneohe Bay, Oahu, Hawaii. Marine Ecology Progress Series, 381 : 175 –182. Doi: 10.3354/meps07968 |
| Zhang J T, 2004. Quantitative Ecology. Beijing: Science Press186-187. |
| Zhao C S, Liu C M, Xia J, et al, 2012. Recognition of key regions for restoration of phytoplankton communities in the Huai River basin, China. Journal of Hydrology, 420-421 : 292 –300. Doi: 10.1016/j.jhydrol.2011.12.016 |
| Zheng T, Lin Y S, Cao W Q, et al, 2014. Ecosystem structure and function in northern Beibu Gulf: zooplankton spatial niche and its differentiation. Acta Ecologica Sinica, 34 (13) : 3635 –3649. |