 2016, 34
Institute of Oceanology, Chinese Academy of Sciences
Article Information
- Lin REN(任林), Jingsong YANG(杨劲松), Gang ZHENG(郑罡), Juan WANG(王隽)
- A joint method to retrieve directional ocean wave spectra from SAR and wave spectrometer data
- Journal of Oceanology and Limnology, 34(4): 847-858
- http://dx.doi.org/10.1007/s00343-015-5043-4
Article History
- Received: Feb. 5, 2015
- Accepted: May. 11, 2016


The measurement of ocean wave fields is important for many industries including shipping, fisheries, and oil extraction, and is also important for the safety and security of nations with coastal borders. Currently, Synthetic Aperture Radar(SAR) and wave spectrometers are the only spaceborne radar systems available to measure the directional characteristics of ocean wave fields. The two systems use different measurement scales and principles.
Spaceborne SAR measures waves in cells at scales of thousands of meters. The system images two dimensional ocean wave fields based on Bragg scattering theory with a fine resolution in the azimuth dimension(flight)(Alpers, 1983; Beal et al., 1983). The SAR imaging theory of ocean waves is now well known(Hasselmann et al., 1985). The theory can be described by a closed spectrum integral transformation relationship(Hasselmann and Hasselmann, 1991), which was reformulated by Krogstad(1992)and later extended to the cross spectrum case(Engen and Johnsen, 1995). Smearing imaging effects over a moving surface may cause a cutoffof wave information in the azimuth dimension. As a result, only waves with a wavelength longer than 150–200 m in the azimuth are detectable(Hauser et al., 2001). Therefore, only swell wave spectra can be retrieved directly from single-polarization SAR imagery (Lyzenga, 2002; Collard et al., 2005; European Space Agency, 2007) or multi-polarization SAR imagery (He et al., 2006; Zhang et al., 2010). Problems related to 180° wave propagation ambiguity have been resolved by the use of image cross spectra(Vachon and Raney, 1991; Engen and Johnsen, 1995). To obtain full wave spectra, first guess spectra are incorporated to complement priori short waves, usually provided by numerical wave models (Hasselmann et al., 1996; Heimbach et al., 1998). However, long sequence historical data are needed to generate first guess spectra to run a global wave model. To overcome the dependence of models on historical data, first guess spectra are derived from theoretical wind wave spectra(Mastenbroek and Valk, 2000). However, inaccurate input wind vectors and uncertainty in the theoretical spectra limit the quality of these first guess spectra.
Wave spectrometers such as Real Aperture Radars (RARs) can measure waves based on quasi-specular scattering theory. The low incidence beam(about 10°) is designed to rotate by 360° to derive measurements of waves in all directions. The radius of the measurement cell of wave spectrometers is approximately 130 km for a satellite altitude of 700 km and an incidence angle of 10°(Jackson et al., 1985). The signal is integrated over the azimuth footprint to obtain a directional resolution of better than 5°(Jackson et al., 1985). The main parameter used to characterize waves is the linear relationship between signal modulation spectra and wave slope spectra. The principles of measurement of this parameter have been widely discussed in the literature (Jackson et al., 1985; Hauser et al., 1992). Moreover, the relationships between RAR backscatter at low incidence and wave parameters have been studied and confirmed(Tran et al., 2007; Chu et al., 2012). Kuband and C-band airborne wave spectrometers have been developed, including the Radar Ocean Wave Spectrometer(ROWS) and RESSAC, later renamed STORM(Jackson, 1987; Hauser et al., 1992; Mouche et al., 2005). The Surface Wave Investigation and Monitoring from SATellite(SWIMSAT) mission, conceived and simulated based on instrument parameters, further supported the concept of spaceborne wave spectrometers(Hauser et al., 2001; Tison et al., 2009; Ren et al., 2010). The investigation on spaceborne wave spectrometers will continue with the Surface Wave Investigation and Monitoring (SWIM) system due to be launched as part of the Chinese French Ocean SATellite(CFOSAT) mission in 2018. Estimation of the sensitivity coefficient is a key step in the retrieval of wave spectra from wave spectrometer data. The empirical relationship between the mean square slope(MSS) and wind speed(WSPD) is used to estimate the coefficient(Jackson et al., 1985). However, swell waves are not directly wind dependent, therefore this method is not effective to detect swell waves. Furthermore, the relationship between MSS and WSPD varies considerably with different sea states(Wu, 1990; Walsh et al., 1998). Therefore, observational data are used to estimate the sensitivity coefficient for airborne wave spectrometer data(Hauser et al., 1992; Ren et al., 2011). For spaceborne wave spectrometers, the significant wave height(SWH) derived from the nadir beam is used to estimate the coefficient(Hauser et al., 2001). Because the nadir beam footprint is relatively narrow relative to the large area of the sea surface being observed, the coefficient estimated using this method might not correctly represent the energy of the entire observed area in inhomogeneous sea states. Moreover, the problem of 180° wave direction ambiguity remains unresolved.
The objective of this paper was to overcome limitations to the retrieval of wave spectra data from SAR and wave spectrometers by combining the output of the two systems. Both simulated and collocated data were used to validate the method. We propose that this method could be used to complement traditional retrieval methods.
2 METHOD 2.1 Ocean-to-SAR image cross spectrum mappingtransformation The expression for ocean-to-SAR image cross spectrum mapping transformation developed by Engen et al.(2000) is as follows:
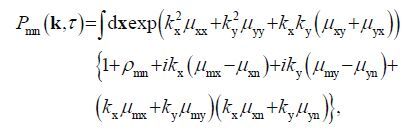 (1)
(1)where m, n ∈ N, denotes different looks, k =(k x, k y) is the wavenumber, τ is the time separation between two looks, x is the horizontal distance, ρmn = ρmn(x, τ) and μ mn = ρab(x, τ)– ρmn(0, 0). The various covariance functions ρab are related to the modulation transfer functions T a and T b and to the ocean wave spectrum F(k) by
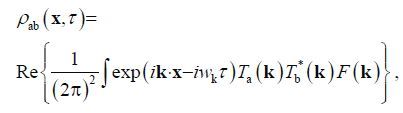 (2)
(2)
where 
From Eq.1, it is clear that the expression is complex and nonlinear, and an iteration method is needed to retrieve the wave spectra. SAR has a high spatial resolution in range and in the azimuth direction, and derives wave spectra at small spatial scales. A major limitation of this system is the loss of short waves in the azimuth dimension related to the wavenumber cutoff. To overcome this limitation, first guess spectra are used to complement the lost waves. Therefore, the quality of first guess spectra is important for the accuracy of SAR wave spectra retrieval data.
2.2 Wave spectrometer measurement principlesThe spatial resolution in the azimuth dimension for wave spectrometers is much less than that for SAR. The directional resolution of spectra is strengthened by integrating the radar returns laterally across the beam spot. Through rotation of the beam, waves in all directions can be measured. Unlike SAR, the transfer function between the signal modulation spectrum P m and wave slope spectrum k 2 F(k, φ) is linear and has no cutoff. The transfer function is given by the formula
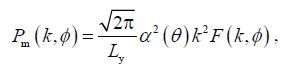 (3)
(3)where L y is the azimuth width of the radar footprint, θ is the incidence, φ is the look direction, and α is the sensitivity coefficient.
To retrieve wave slope spectra or wave spectra, it is important to estimate α . This coefficient is related to the slope probability density function p, and is estimated by
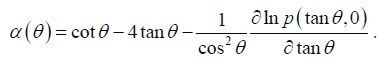 (4)
(4)However, the p is wind dependent and difficult to measure directly. For spaceborne wave spectrometers, scientists propose to estimate α using an independent measurement of SWH extracted from the narrow nadir beam itself. The α value is then given by
 (5)
(5)When the altitude of the sensor is 500 km(e.g., for SWIMSAT), wave spectra are retrieved from a large circular sea surface area with a radius of about 90 km. However, the area observed by the narrow nadir beam has a radius of only 5 km. Hence, in inhomogeneous sea surface states, the measured SWH is unlikely to correctly represent the energy distribution over the entire observation area.
2.3 Description of the joint retrieval methodTo overcome the limitations of data retrieval from SAR and wave spectrometers, a joint method is proposed. First, the SWH is derived from SAR data to estimate the sensitivity coefficient, which is then used with wave spectrometer data to retrieve wave spectra at large spatial scales. Next, wave spectrometerderived spectra are used as first guess spectra in SAR retrieval procedures, to retrieve full wave spectra at small spatial scales. Finally, the 180° ambiguity of both retrieved spectra is removed using SAR image cross spectra. In practice, this method involves the following operations.
(1) The SAR cutoff λ c is estimated by fitting the image autocorrelation function(ACF)(Kerbaol et al., 1998). The ACF is obtained by Fourier transformation of the real part of the image cross spectrum. Next, λ c is obtained by fitting the ACF along the azimuth using the Gaussian function C(x) as follows
 (6)
(6)where x is the spatial distance in the azimuth dimension.
(2) The SWH is retrieved from SAR data using an empirical model related to λ c . This model is derived based on RADARSAT-2 SAR data and collocated National Data Buoy Center(NDBC) buoy data. The model coefficients are obtained by retraining the data presented in Ren et al.(2014)using a similar method. The expression for the model of horizontal–horizontal (HH) polarization is given by
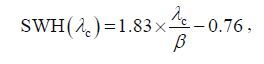 (7)
(7)where β is the range-to-velocity ratio.
Meanwhile, the SWH is also retrieved from wave spectrometer data using the narrow nadir beam as for spaceborne altimeters(e.g., those on TOPEX/ Poseidon or HY-2).
(3) To improve the accuracy of the sensitivity coefficient α in inhomogeneous sea states, the SARderived and wave spectrometer-derived SWHs are averaged to estimate the coefficient as follows:
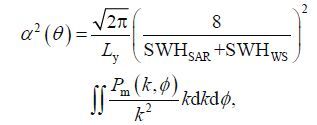 (8)
(8)where SWH SAR is the SAR-derived SWH, and SWH WS is the wave spectrometer-derived SWH. We propose that using the average of two kinds of SWH can extend the sea surface sampling area and reduce the estimation error of the sensitivity coefficient α .
(4) Wave spectra at small scales are retrieved from wave spectrometer data by substituting the P m(k, φ) and α into Eq.3. These retrieved spectra have 180° ambiguity. The modulation spectrum P m(k, φ) is derived using Fourier transform(FT) of the ACF of the modulation function m(x, φ). The m(x, φ) in each look direction φ is extracted from radar returns of the wave spectrometer by
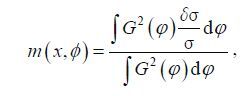 (9)
(9)where G(φ) is the power gain of the transmitting and receiving antennas, and δσ / σ is the relative variation in the normalized radar cross section(NRCS).
(5) Wave spectrometer-derived wave spectra are seen as the background wave fields at large scales and used as first guess spectra for SAR. Full wave spectra at small scales are retrieved from SAR image cross spectra together with first guess spectra using the Max-Planck-Institut(MPI) scheme.
Image cross spectra are calculated by two imagettes after multi-look processing. Details of the MPI scheme are given in Hasselmann and Hasselmann (1991). However, the scheme used in the present study is slightly modified. In each iteration step, the first guess spectrum is normalized to have the same SWH value as the initial one. The wave spectra retrieved from SAR also have 180° ambiguity.
(6) The 180° ambiguity of the SAR-derived and wave spectrometer-derived wave spectra is removed by the imaginary image cross spectra. The peak wave direction(PWD) of the positive imaginary spectra closely approximates the real PWD. The PWD from the imaginary spectra are compared and the closer of two ambiguous directions for the retrieved spectra is the final retrieved PWD.
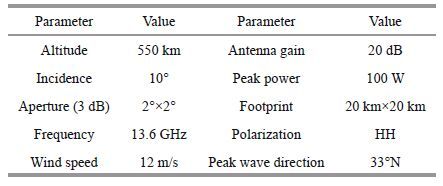
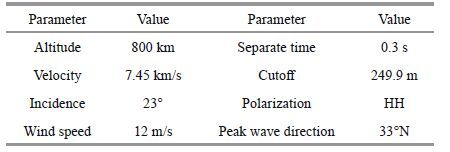
3 SIMULATION 3.1 Simulation methodSimulated data are used to validate the joint method described in Section 2. It is assumed that the SAR and the wave spectrometer are detecting the same sea surface. For the wave spectrometer, observations are simulated as described by Ren et al.(2010). Typical CFOSAT SWIM parameters are used as shown in Table 1. For SAR, image cross spectra are simulated based on the ocean-to-SAR mapping relationship proposed by Engen et al.(2000). Typical ENVISAT ASAR parameters are used as shown in Table 2. Both simulations use Wen’s theoretical wind wave spectrum (Wen et al., 1993) as the system input.
Wen’s reference wind wave spectrum used to compare retrieved wave spectra is shown in Fig. 1. The corresponding SWH, peak wave length(PWL), and PWD clockwise from north are 3.4 m, 160 m and 33°, respectively.

|
| Figure 1 Wen’s reference wind wave spectrum used in the simulation |
Figure 2 shows the simulated wave spectrometer data. Figure 2a shows a simulated sea surface in terms of wave slopes. The waves are propagating towards a certain direction. Figure 2b shows the normalized signal modulation spectrum P m, which is the FT of the modulation function m estimated from the simulated sea surface using Eq.9. Unlike SAR image spectra, the P m has no clear cutoffin the high wavenumber region.

|
| Figure 2 Simulated wave spectrometer data a. simulated sea surface in terms of wave slopes; b. normalized signal modulation spectrum. |
The simulated SAR data are shown in Fig. 3. Figure 3a shows the real part of the SAR image cross spectrum, while Fig. 3b shows the positive imaginary part of the spectrum. Both spectra are derived using the image cross spectrum mapping transformation in equation. Figure 3 shows that spectra cutoffs exist in the high wavenumber region in the azimuth dimension. The PWD of the cross spectrum(Fig. 3b) is the same as that in Fig. 1. Therefore, imaginary cross spectra can be used to remove 180° wave ambiguity in data retrieval.

|
| Figure 3 Simulated SAR data a. real part of the image cross spectrum; b. imaginary part of the image cross spectrum. |
Wave spectra retrieved from SAR and the wave spectrometer using the joint method are shown in Fig. 4. First, the cutoffλ c is estimated from Fig. 3a using Eq.6. The estimated value is 249.9 m. Substituting λ c and β into Eq.7, the SAR-derived SWH has a value of 3.2 m. For simplification, the nadir beam of the wave spectrometer is not considered. It is directly assumed that the wave spectrometerderived SWH is the same as the SAR-derived SWH. The sensitivity coefficient α is then estimated using Eq.8. The wave spectrum is derived from the wave spectrometer modulation spectrum P m using α, as shown in Fig. 4a. The 180° ambiguity of the retrieved spectrum is removed by the imaginary image cross spectra. The final wave spectrometer-derived wave spectrum without ambiguity is shown in Fig. 4b.

|
| Figure 4 Simulated wave spectra retrieved from SAR and wave spectrometer data a. wave spectrum retrieved from wave spectrometer data using the joint method; b. same as(a) but without ambiguity; c. wave spectrum retrieved from SAR data with no first guess spectrum using the ENVISAT ASAR Level 2 scheme; d. wave spectrum without ambiguity retrieved from SAR data using the joint method. |
To complement the waves lost in SAR data retrieval, the wave spectrometer-derived wave spectrum is used as the first guess spectrum. Next, the full wave spectrum is retrieved from the SAR real image cross spectrum in collaboration with the first guess spectrum using the MPI scheme. The 180° ambiguity in this retrieved spectrum is also removed by the imaginary image cross spectrum. The retrieved spectrum without ambiguity is shown in Fig. 4d. As a comparison, the wave spectrum was also retrieved with no first guess spectrum using the scheme of ENVISAT ASAR Level 2. This scheme proposed by the European Space Agency(2007)was originally used for ENVISAT ASAR wave mode products. The retrieved spectrum is shown in Fig. 4c. It is clear from the figures that, in terms of the reference wave spectrum shown in Fig. 1, the joint method derives more short waves in the azimuth dimension than the ENVISAT ASAR Level 2 scheme.
Wave parameters extracted from reference, wave spectrometer-derived, and SAR-derived spectra are listed in Table 3. Compared with the reference spectrum, parameters derived from the wave spectrometer-derived spectrum had biases of -0.2 m, -10.7 m, and 0.6° for SWH, PWL, and PWD, respectively. Meanwhile, parameters derived from the SAR-derived spectrum had biases of -0.2 m, -2.9 m, and 0.7°. Results show good consistency between the two retrieved spectra and the reference spectrum.

|
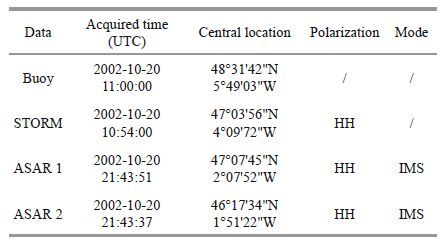
In this section, collocated data were used to validate the proposed method. Data were collected from ENVISAT ASAR Single Look Complex(SLC) images, from the airborne wave spectrometer STORM, from the PHAROS buoy, and from the European Centre for Medium-Range Weather Forecasting(ECMWF) numerical model. The collocated in situ measurements were obtained from observation buoy data, while the reanalysis data were obtained from the ECMWF. These data were compared with SAR-derived and wave spectrometerderived data. The locations of collocated data used in this study are shown in Fig. 5 and details of the data are listed in Table 4. There are some temporal and spatial differences among these data, but in light of the rarity of wave spectrometer data, they were considered suitable to verify the feasibility of the proposed method. The airborne STORM spectrometer has the same measurement principles as spaceborne spectrometers, but has flight levels around 2.5 km and an incidence range from 5° to 35°. Here, the data used are from 6° to 20°, in which range reflectivity is dominated by quasi-specular reflection. Details of STORM have been previously described in the literature(Mouche et al., 2005). Note that the radius of STORM measurement cells is only about 1 km because of the lower flight level. The joint method is not necessary to retrieve airborne wave spectrometer data because of the small beam spot, but the method can still be effectively applied in this setting.

|
| Figure 5 Map of the study area The diamond indicates the location of the buoy observations and the circle indicates the location of the STORM observations. The frames indicate the extent of ENVISAT ASAR 1 and ASAR 2 coverage as shown in Table 4. |
STORM data were processed using the same steps used for RESSAC(Hauser et al., 1992). Figure 6a shows the radar signal returns from the 360° scanning beam. The range resolution is 1.53 m. Figure 6b shows the modulation spectrum P m extracted and normalized from the signal shown in Fig. 6a. The spectrum in Fig. 6b shows a mixed wave system consisting of swell and wind waves. Here, the WSPD from the buoy is 12.4 m/s. The retrieved WSPD from ENVISAT ASAR image 2 using the CMOD-IFR2 Geophysical Model is about 8.6 m/s(Quilfen et al., 1998). Both sets of wind data indicate that there is probably a wind wave system and are consistent with the modulation spectrum P m shown in Fig. 6b.

|
| Figure 6 STORM data |
The ENVISAT ASAR images were divided into several imagettes(about 5 km×10 km). Figure 7a shows an NRCS imagette of an ASAR 2 image from the area outlined in Fig. 5. Unlike the STORM radar returns, this image displays some clear wave stripes, which are induced by the imaging of ocean waves. The real and imaginary part of the image cross spectra were calculated from the imagette, as shown in Fig. 7b and c. Figure 7c shows that waves only propagate towards a single direction, which can be used to remove the 180° ambiguity of retrievals. The ENVISAT ASAR Level 2 scheme was used to retrieve the swell wave spectrum from Fig. 7b, as shown in Fig. 7d. This figure shows swell waves but does not show the wind waves seen in Fig. 6b.

|
| Figure 7 ENVISAT ASAR data a. NRCS imagette of an ASAR 2 image from the area outlined in Fig. 5; b. real part of the image cross spectrum of(a); c. positive imaginary part of the image cross spectrum of(a); d. swell spectrum retrieved from(b) using the ENVISAT ASAR Level 2 scheme. |
The wave spectra retrieved from STORM and ENVISAT ASAR data using the joint method are shown in Fig. 8. First, the estimated cutoffλ c of 200.5 m is obtained by fitting the spectrum shown in Fig. 7b. The β of 108.0 is obtained from SAR auxiliary records. Next, the estimated SWH value of 2.7 m is derived from SAR data with the empirical model. Because STORM does not use a fixed nadir beam like spaceborne spectrometers, the expected SWH from the wave spectrometer is assumed to be equal to the SAR-derived SWH. Therefore, the sensitivity coefficient α is estimated using the SAR-derived SWH. Combining P m and α, the wave spectrum retrieved from STORM data has 180° ambiguity, as shown in Fig. 8a. In the spectrum retrieved with the joint method, the ambiguity of the swell wave component is removed using the SAR image cross spectrum shown in Fig. 7c. Because the wind wave is not mapped onto the SAR image, the removal of the ambiguity of the retrieved wind wave component depends on the wind direction(WDIR) extracted from ECMWF data. The final spectrum retrieved from STORM data without ambiguity is shown in Fig. 8b.

|
| Figure 8 The wave spectra retrieved from ENVISAT ASAR and STORM data using the joint method a. STORM-derived wave spectrum with 180° ambiguity; b. same as(a) but without 180° ambiguity; c. ENVISAT ASAR-derived wave spectrum with 180° ambiguity; d. same as(c) but without 180° ambiguity. |
Next, the STORM-derived wave spectrum is used as the first guess spectrum in the SAR retrieval. Using the MPI scheme together with the first guess spectrum, the full wave spectrum is retrieved from SAR, as shown in Fig. 8c. Compared to the SAR-derived swell spectrum in Fig. 7d, it is clear that the short waves in Fig. 8c are complemented. The same method as used for STORM data is used to remove 180° ambiguity in the SAR data. The final spectrum retrieved from SAR data is shown in Fig. 8d.
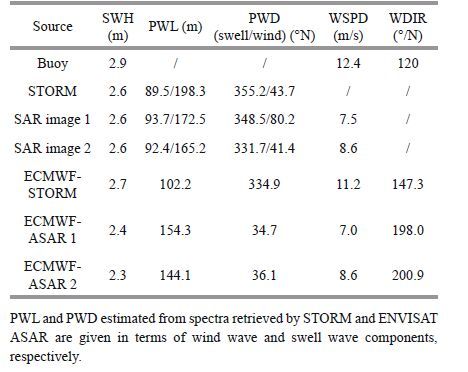
Table 5 compares the wave parameters extracted from STORM-derived spectra, ENVISAT ASARderived spectra, PHAROS buoy data, ECMWF model data, and associated wind field data. Note that the PWL and PWD estimated from the STORM-retrieved and ENVISAT ASAR-retrieved spectra are given in terms of wind wave and swell wave components, respectively. The PWL is converted from the mean wave period(MWP) using the dispersion relationship ω 2 =g k tan(kd), in which g is the gravity acceleration and d is the water depth. The mean wave direction (MWD) in the ECMWF model data is approximated as the PWD. In addition, parameters retrieved from ENVISAT ASAR are the average of all imagettes in each image.
|
According to location, the buoy and ECMWF model data were compared with the STORM-derived wave parameters, while the ECMWF model data were compared with the SAR-derived parameters. The results shown in Table 5 indicate that the STORMderived SWH is in good agreement with the buoy data with a bias of -0.3 m, and with the ECMWF model data with a bias of -0.1 m. The STORM-derived PWL and PWD of wind waves have biases of -12.7 m and 20.3°, respectively, compared to ECMWF model data. Compared to ECMWF model data, wind wave parameters retrieved from ASAR 1 images had biases of 0.2 m, 18.2 m, and 45.5° for SWH, PWL, and PWD, respectively, while those retrieved from ASAR2 images had biases of 0.3 m, 21.1 m, and 5.3°, respectively. These comparisons show that the SWH and PWL retrieved from STORM and ENVISAT ASAR data are consistent with buoy measurements and ECMWF model data. Because complete collocation was not possible, partial parameters of PWD show considerable deviation. However, on the whole, retrieved parameters are comparable to reference parameters.
5 CONCLUSIONThe SAR system can image and measure two dimensional ocean wave fields at small spatial scales. However, because of the cutoffin the azimuth, only swell waves along that dimension can be retrieved directly from SAR image data, depending on nonlinear ocean-to-SAR mapping relationships. Therefore, first guess spectra are needed to obtain full wave spectra from SAR data. Wave spectrometers detect wave spectra at large spatial scales using a relatively simple linear modulation relationship. However, there are also some challenges in terms of wave retrieval including estimation of the sensitivity coefficient, especially in inhomogeneous sea states, and removal of 180° wave direction ambiguity.
In this paper, we propose a joint method to simultaneously retrieve wave spectra at different scales from spaceborne SAR and wave spectrometers. This method combines the output of the two sensors to overcome the limitations to data retrieval in some sea states. First, the SAR cutoffis estimated from its image cross spectrum. SAR estimates SWH from the cutoffusing an empirical model, while wave spectrometers derive SWH from the narrow nadir beam itself. Next, SAR-derived and wave spectrometer-derived SWHs are averaged to extend the area of the sea surface sampled. The averaged SWH is an effective SWH for the entire area observed by the wave spectrometer, and is used to estimate the sensitivity coefficient. This coefficient estimated from the effective SWH can describe the absolute energy distribution better than that estimated from the wave spectrometer’s single narrow nadir beam in inhomogeneous states. After estimation of the sensitivity coefficient, wave spectra at large spatial scales are derived from the wave spectrometer modulation spectra extracted from the observations. Meanwhile, these spectra at large spatial scale are seen as the background wave field, and are used as the first guess spectra in SAR retrieval. Finally, full wave spectra at small spatial scales are retrieved from the SAR image cross spectra in collaboration with first guess spectra using the MPI scheme. The 180° ambiguity in both retrieved wave spectra is removed using the SAR imaginary cross spectra.
Simulated data are first used to validate the joint method. Wave spectrometer simulation is carried out as previously described by Ren et al.(2010). The SAR simulation is based on the ocean-to-SAR image cross spectra mapping relationship described by Engen et al.(2000). In the simulation, wave parameters retrieved from SAR and wave spectrometers using the joint method are compared with those derived from an input reference spectrum. For the wave spectrometer, there is a bias of -0.2 m for SWH, -10.7 m for PWL, and 0.6° for PWD. For SAR, the biases are -0.2 m for SWH, -2.9 m for PWL and 0.7° for PWD. Overall, the retrieved parameters were in good agreement with the reference parameters.
In addition, collocated ENVISAT ASAR data, data from the airborne wave spectrometer STORM, PHAROS buoy data, and ECMWF numerical model data were used to verify the proposed method. The SWH estimated from ENVISAT ASAR data was used to derive the sensitivity coefficient to retrieve the wave spectra from STORM. Meanwhile, STORMderived wave spectra were used as the first guess spectra to make up for the short waves lost in SAR retrieval. Wave parameters from STORM data and two SAR images were compared to parameters obtained from buoy and ECMWF data. Comparisons show that the retrieved SWH and PWL were in agreement with reference values, although there was some difference in PWD parameters, possibly as a result of the incomplete collocation of collected data. However, most of the retrieved parameters were comparable to reference parameters, suggesting that this joint method could be used to complement traditional methods used to retrieve wave spectra data, particularly in inhomogeneous sea states.
6 ACKNOWLEDGMENTThe authors would like to thank the CETP LATMOS laboratory in France for providing STORM data. We also thank the Dragon Programme for providing the ENVISAT ASAR images.
| Alpers W, Rufenach C, 1979. The effect of orbital motions on synthetic aperture radar imagery of ocean waves. I EEE Transactions on Antennas and Propagation, 27 (5) : 685 –690. Doi: 10.1109/TAP.1979.1142163 |
| Alpers W, 1983. Monte Carlo simulations for studying the relationship between ocean wave and synthetic aperture radar image spectra. Journal of Geophysical Research, 88 (C3) : 1745 –1759. Doi: 10.1029/JC088iC03p01745 |
| Beal R C, Tilley D G, Monaldo F M, 1983. Large-and smallscale spatial evolution of digitally processed ocean wave spectra from the SEASAT synthetic aperture radar. Journal of Geophysical Research, 88 (C3) : 1761 –1778. Doi: 10.1029/JC088iC03p01761 |
| Chu X Q, He Y J, Karaev V Y, 2012. Relationships between Ku-band radar backscatter and integrated wind and wave parameters at low incidence angles. IEEE Transactions on Geoscience and Remote Sensing, 50 (11) : 4599 –4609. Doi: 10.1109/TGRS.2012.2191560 |
| Collard F, Ardhuin F, Chapron B, 2005. Extraction of coastal ocean wave fields from SAR images. IEEE Journal of Oceanic Engineering, 30 (3) : 526 –533. Doi: 10.1109/JOE.2005.857503 |
| Engen G, Johnsen H, 1995. SAR-ocean wave inversion using image cross spectra. IEEE T ransactions on G eoscience and R emote S ensing, 33 (4) : 1047 –1056. |
| Engen G, Vachon P W, Johnsen H, et al, 2000. Retrieval of ocean wave spectra and RAR MTF's from dualpolarization SAR data. IEEE T ransactions on G eoscience and R emote S ensing, 38 (1) : 391 –403. |
| European Space Agency. 2007. EnviSat ASAR Product Handbook (Issue 2.2, Feb. 27, 2007). http://earth.esa.int/handbooks/asar/CNTR.htm. |
| Gower J F R, 1983. “Layover” in satellite SAR radar images of ocean waves. Journal of Geophysical Research, 88 (C12) : 7719 –7720. Doi: 10.1029/JC088iC12p07719 |
| Hasselmann K, Hasselmann S, 1991. On the nonlinear mapping of an ocean wave spectrum into a synthetic aperture radar image spectrum and its inversion. Journal of Geophysical Research, 96 (C6) : 10713 –10729. Doi: 10.1029/91JC00302 |
| Hasselmann K, Raney R K, Plant W J, et al, 1985. Theory of synthetic aperture radar ocean imaging: a MARSEN view. Journal of Geophysical Research, 90 (C3) : 4659 –4686. Doi: 10.1029/JC090iC03p04659 |
| Hasselmann S, Brüning C, Hasselmann K, Heimbach P, 1996. An improved algorithm for the retrieval of ocean wave spectra from synthetic aperture radar image spectra. Journal of Geophysical Research, 101 (C7) : 16615 –16629. Doi: 10.1029/96JC00798 |
| Hauser D, Caudal G, Rijchenberg G, et al, 1992. RESSAC: a new airborne FM/CW radar ocean wave spectrometer. IEEE Transactions on Geoscience and Remote Sensing, 30 (5) : 981 –995. Doi: 10.1109/36.175333 |
| Hauser D, Soussi E, Thouvenot E, et al, 2001. SWIMSAT: a real-aperture radar to measure directional spectra of ocean waves from space-main characteristics and performance simulation. Journal of Atmospheric and Oceanic Technology, 18 (3) : 421 –437. Doi: 10.1175/1520-0426(2001)018<0421:SARART>2.0.CO;2 |
| He Y J, Shen H, Perrie W, 2006. Remote sensing of ocean waves by polarimetric SAR. Journal of Atmospheric and Oceanic Technology, 23 (12) : 1768 –1773. Doi: 10.1175/JTECH1948.1 |
| Heimbach P, Hasselmann S, Hasselmann K, 1998. Statistical analysis and intercomparison of WAM model data with global ERS-1 SAR wave mode spectral retrievals over 3 years. Journal of Geophysical Research, 103 (C3) : 7931 –7977. |
| Jackson F C, Walton W T, Baker P L, 1985. Aircraft and satellite measurement of ocean wave directional spectra using scanning-beam microwave radars. Journal of Geophysical Research, 90 (C1) : 987 –1004. Doi: 10.1029/JC090iC01p00987 |
| Jackson F C, 1987. The radar ocean-wave spectrometer. Johns Hopkins APL Technical Digest, 8 : 116 –127. |
| Kerbaol V, Chapron B, Vachon P W, 1998. Analysis of ERS-1/2 synthetic aperture radar wave mode imagettes. Journal of Geophysical Research, 103 (C4) : 7833 –7846. Doi: 10.1029/97JC01579 |
| Krogstad H E, 1992. A simple derivation of Hasselmann's nonlinear ocean synthetic aperture radar transform. Journal of Geophysical Research, 97 (C2) : 2421 –2425. Doi: 10.1029/91JC03010 |
| Lyzenga D R, 2002. Unconstrained inversion of waveheight spectra from SAR images. IEEE Transactions on Geoscience and Remote Sensing, 40 (2) : 261 –270. Doi: 10.1109/36.992783 |
| Mastenbroek C, de Valk C F, 2000. A semiparametric algorithm to retrieve ocean wave spectra from synthetic aperture radar. Journal of Geophysical Research, 105 (C2) : 3497 –3516. Doi: 10.1029/1999JC900282 |
| Monaldo F M, Lyzenga D R, 1986. On the estimation of wave slope-and height-varnance spectra from SAR imagery. IEEE Transactions on Geoscience and Remote Sensing, GE, 24 (4) : 543 –551. |
| Mouche A A, Hauser D, Daloze J F, et al, 2005. Dualpolarization measurements at C-band over the ocean: results from airborne radar observations and comparison with ENVISAT ASAR data. IEEE Transactions on Geoscience and Remote Sensing, 43 (4) : 753 –769. Doi: 10.1109/TGRS.2005.843951 |
| Quilfen Y, Chapron B, Elfouhaily T, et al, 1998. Observation of tropical cyclones by high-resolution scatterometry. Journal of Geophysical Research, 103 (C4) : 7767 –7786. Doi: 10.1029/97JC01911 |
| Ren L, Mao Z H, Huang H Q, et al, 2010. Satellite-based RAR performance simulation for measuring directional ocean wave spectrum based on SAR inversion spectrum. Acta Oceanologica Sinica, 29 (4) : 13 –20. Doi: 10.1007/s13131-010-0046-7 |
| Ren L, Pan D L, Mao Z H, 2011. Measurements of ocean wave spectrum from airborne radar at small incidence angles. Acta Oceanologica Sinica, 30 (1) : 40 –46. Doi: 10.1007/s13131-011-0089-4 |
| Ren L, Yang J S, Zheng G, et al, 2014. The significant wave height estimation by the azimuth cutoffof the quadpolarization SAR image. SPIE Ocean Remote Sensing and Monitoring from Space, 9261 : 926115 . |
| Romeiser R, Schmidt A, Alpers W, 1994. A three-area composite surface model for the ocean wave-radar modulation transfer function. Journal of Geophysical Research, 99 (C5) : 9785 –9801. Doi: 10.1029/93JC03372 |
| Tison C, Amiot T, Bourbier J et al. 2009. Directional wave spectrum estimation by swim instrument on CFOSAT. In: Proceedings of 2009 IEEE International Geoscience and Remote Sensing Symposium, IGARSS'09. IEEE, Cape Town, South Africa. p.V-312-V-315. |
| Tran N, Chapron B, Vandemark D, 2007. Effect of long waves on Ku-band ocean radar backscatter at low incidence angles using TRMM and altimeter data. IEEE Geoscience and Remote Sensing Letters, 4 (4) : 542 –546. Doi: 10.1109/LGRS.2007.896329 |
| Vachon P W, Raney R K, 1991. Resolution of the ocean wave propagation direction in SAR imagery. IEEE Transactions on Geoscience and Remote Sensing, 29 (1) : 105 –112. Doi: 10.1109/36.103299 |
| Walsh E J, Vandemark D C, Friehe C A, et al, 1998. Measuring sea surface mean square slope with a 36-GHz scanning radar altimeter. Journal of Geophysical Research, 103 (C6) : 12587 –12601. Doi: 10.1029/97JC02443 |
| Wen S C, Guo P F, Zhang D C, 1993. Analytically derived wind-wave directional spectrum Part 1. Derivation of the spectrum. Journal of Oceanography, 49 (2) : 131 –147. Doi: 10.1007/BF02237285 |
| Wu J, 1990. Mean square slopes of the wind-disturbed water surface, their magnitude, directionality, and composition. Radio Science, 25 (1) : 37 –48. Doi: 10.1029/RS025i001p00037 |
| Zhang B, Perrie W, He Y J, 2010. Validation of RADARSAT-2 fully polarimetric SAR measurements of ocean surface waves. Journal of Geophysical Research, 115 (C6) : C06031 . |