 2016, 34
Institute of Oceanology, Chinese Academy of Sciences
Article Information
- Dongyang FU(付东洋), Hong LUAN(栾虹), Delu PAN(潘德炉), Ying ZHANG(张莹), Li'an WANG(王立安), Dazhao LIU(刘大召), Youzhuan DING(丁又专), Xue LI(李薛)
- Impact of two typhoons on the marine environment in the Yellow Sea and East China Sea
- Journal of Oceanology and Limnology, 34(4): 871-884
- http://dx.doi.org/10.1007/s00343-016-5049-6
Article History
- Received: Mar. 8, 2015
- Accepted: Jan. 30, 2016


2. State Key Laboratory of Satellite Ocean Environment Dynamics (Second Institute of Oceanography, State Oceanic Administration), Hangzhou 310012, China
The Yellow Sea (YS) is a semi-enclosed continental margin sea with mainland China to the west, the Korean Peninsula to the east, and connections to the Bohai Sea to the north and the East China Sea(ECS) to the south. The YS is about 3.8×10 5 km 2 with an average depth of 44 m, and it is controlled by southerly winds with speeds of 4–6 m/s in the summer(Su, 2005; Shi and Wang, 2012). The average water temperature is about 24℃ in summer and 15–19℃ in autumn(Chu, 1979).
The ECS has mainland China to the west and it joins the YS in the north. It links to the western Pacific in the east and the South China Sea (SCS) through the Taiwan Strait in the south. The ECS has an area of about 1.25×10 6 km 2 with an average depth of 188 m (Shi and Wang, 2012). The average temperature is 24–28℃ in summer and 18–24℃ in autumn(Chu, 1979). The ECS is one of the most productive parts of the world’s oceans. The ECS shelf has complex hydrology because it is affected by the Changjiang (Yangtze)River discharge, intrusions of YS, Taiwan Strait, and Kuroshio waters, as well as alternating monsoons(Liu et al., 2003). There are usually high levels of diffusion, migration, and deposition of terrestrial detritus(sediment), which contribute large concentrations of nutrients and pollutants to the continental shelves of the YS and ECS, resulting in high chlorophyllChl- a(ChlChl- a) concentration and suspended sediment concentration(SSC). In this area, seasonal variations in sedimentation and the resultant fluxes have far-reaching influences on the ecology, environment, and resources(Wen, 2010). This abbreviation was not used again in the text and so it has been deleted.
Typhoons are violent weather systems over the tropical western Pacific, with maximum sustained surface wind speeds of >33 m/s (Zhao et al., 2008), which often enter the YS and ECS during the summer and autumn(Fu et al., 2009a, b). Typhoons can create oceanic eddies and upwelling near their paths that can increase primary productivity and trigger phytoplankton blooms(Chang et al., 1996; Chen et al., 2003; Lin et al., 2003a, b; Prasad and Hogan, 2007; Zheng and Tang, 2007; Fu et al., 2008; Zhao et al., 2008; Liu et al., 2009; Ye et al., 2013), and increase both the pre-typhoon depth of the mixed layer and the strength of the pycnocline. Previous studies have focused on the effects of individual typhoons on primary production(Lin et al., 2003a, b; Zheng and Tang, 2007; Ye et al., 2013), average effects of multiyear typhoons, and relative effects of intensity and translation speed of typhoons in the western Pacific and SCS(Zhao et al., 2008; Fu et al., 2009a, b). Furthermore, typhoons can cause entrainment, strong vertical mixing, upwelling, and cooling of nearsurface waters, especially to the right-hand side of the storm track(Hazelworth, 1968; Price, 1981; Stramma et al., 1986; Dickey et al., 1998; Shi and Wang, 2007, 2011; Wang and Zhao, 2008; Fu et al., 2009a, b; Liu et al., 2009). The ‘right bias effect’ on sea surface temperature(SST) of a typhoon travelling northward in the ECS and SCS has been observed and documented(Fu et al., 2009a, b); however, the effects on the SST and ecosystem, should two typhoons pass through the YS and ECS almost simultaneously, remain unknown.
2 MATERIAL AND METHOD 2.1 Study areaThe study area (23°–37°N, 120°–130°E) was located in the region of the Northwest Pacific Ocean adjoining East China (Fig. 1). This area receives a large volume of freshwater discharge from the Changjiang River Estuary(CRE) and Hangzhou Bay. To analyze the impacts of the typhoons on the marine environment, we divided the study area into 35 bins (sea bins), each 2°×2°. As shown in Fig. 1, box A contained 10 bins(6, 7, 11, 12, 16, 17, 21, 22, 26, and 27), representing the area close to the CRE that usually comprises Case-II waters(Morel and Prieur, 1977) with high SSC and ChlChl- a concentration. Box B contained six bins (4, 5, 9, 10, 14, and 15), representing an offshore area that usually comprises Case-I waters (Morel and Prieur, 1977) with low levels of surface SSC, ChlChl- a, and nutrients.

|
| Figure 1 The study area, tracks, and intensities of typhoons Nari (#12) and Wipha (#13) in the East China Sea and Yellow Sea in 2007 |
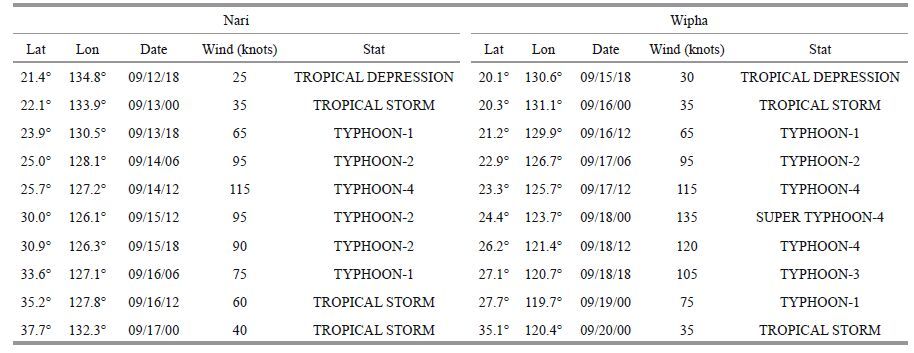
Typhoons Nari and Wipha were both category 4 typhoons (according to the Saffir–Simpson hurricane wind scale) that originated from tropical depressions in the Northwest Pacific (18.3°N, 139.8°E/16.3°N, 134.2°E) at 0600 UTC on September 11 and 14, 2007, respectively. Nari strengthened to a typhoon at 1800 UTC on September 13, and reached its peak wind speed of 125 knots at 1800 UTC on September 14. It traversed the ECS, passed over the south of the Korean Peninsula, and ended in the sea at 0000 UTC on September 17. Wipha strengthened to a typhoon at 1200 UTC on September 16, reached its peak wind speed of 135 knots at 0000 UTC on the 18. It then traversed the ECS, made landfall in Zhejiang Province, passed over Zhejiang and Jiangsu Provinces, and entered the YS. It ended in the YS at 0000 UTC on September 20, 2007(Fig. 1 and Table 1).
Daily level-3 remote sensing data of sea surface temperature(SST), Chl- a, and SSC with 1.1-km resolution were obtained from the Aqua/Terra MODIS. In addition, SST data were obtained simultaneously from the NOAA AVHRR.
In situ temperature (five sets) and salinity (one set) profiles from the waters near the typhoons’ tracks, both before and after their passage, were obtained by the CTD of NOAAs Argo buoys(http://www.aoml. noaa.gov) in the southeast ECS(Fig. 1: p1–p5).
Surface wind and rainfall data were derived from the SeaWinds microwave sensor on the Quick Scatterometer satellite (http://poet.jpl.nasa.gov). Typhoon data were downloaded from the Unisys Weather website(http://weather.unisys.com/ hurricane/w_pacific/), which uses the best-track typhoon data from the Joint Typhoon Warning Center. These data include the maximum sustained surface wind speed(i.e., maximum winds in Table 1) and the six-hourly latitude/longitude position of the typhoon’s center.
2.3 Methods 2.3.1 Multi-Day-Average(MDA)Daily ChlChl- a concentrations were calculated using the ocean chlorophyll 4 algorithm (O’Reilly et al., 1998) and SSC by Pan et al.(1999). The multi-dayaverage (MDA)SST/ChlChl- a /SSC of the remote sensing data was obtained using a sliding-window-average fusion algorithm, as in Eq.(1):
 (1)
(1)where Aver is the MDA value of SST/ChlChl- a /SSC in the study area, m is the number of split windows in the area, and N is the number of remote sensing images involved in the calculation. Value (i) p represents the current value of point “ p ” within the study area, whose number is “ i ” (if the value of point p is missing, the result is not included). First, an average was calculated for a small bin(2°×2°), as shown in Fig. 1, and then the sliding was performed for small window(bin) from the first to the last over the entire study area. The ChlChl- a and SSC data were both log10 transformed.
The dates of the MDA-ChlChl- a and MDA-SSC acquisitions were 0901–0910 (before the typhoons) and 0911–0924(after the typhoons). The dates of the MDA-SST acquisitions were 0905–0910(before the typhoons) and 0911–0922(after the typhoons).
2.3.2 Ekman pumping velocityEkman pumping velocity (EPV) caused by the wind was calculated as follows:
 (2)
(2)and the pseudo wind stress was derived as follows:
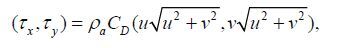 (3)
(3)where water density(ρ 0)=1 030 kg/m3, air density (ρ a)=1.26 kg/m3, the Coriolis parameter (f)=2 ω sin φ, and the wind drag coefficient(C D)=1.29×10 -3 .
2.3.3 Mixed layer depthWe defined the mixed layer depth (MLD) as that depth within the top 10 m at which the temperature decreased by 1℃ from its average(Kara et al., 2000). The MLD was estimated from CTD data.
3 RESULT 3.1 SST decline after typhoon passageThe SST in the YS and ECS decreased significantly after the passage of the typhoons, especially in the YS area and coastal waters (Fig. 2). The MDA-SST during September 1–10 within the study area was 25.72℃ (Fig. 2a), but it dropped to 24.32℃(average drop of 1.44℃) during and after the passage of the typhoons (September 11–22; Fig. 2b). A prominent “cold pool” (average decline of SST of 1.78℃) appeared in the YS, between the tracks of the two typhoons(33– 37°N, 120–126°E). Furthermore, the maximum decline in SST was observed in bin 27(in the YS), declining from 24.91℃ before, to 22.42℃ after the passage of the typhoons. In the open-sea area(i.e., box B; Fig. 1), the MDA-SST declined by only 0.74℃, i.e., less than half that in the YS. The smallest reduction of SST was in bin 5 of box B(outer area of the ECS), which declined from 27.54 to 27.41℃ with only a 0.14℃ average decline.

|
| Figure 2 Distribution of multi-day-average sea surface temperature (MDA-SST) from MODIS and NOAA18 |
Within the study area, the average daily SST was lower in mid-September during the passage of the typhoons. The highest SST of 28.37℃ was recorded on September 3. On September 10, before the typhoons arrived, the average SST was 26.33℃, which then dropped to 22.79℃ on September 16. From September 11, the influence of Typhoon Nari appeared and SST started to decline. On September 14, the SST declined to 24.23℃ as the center of Typhoon Nari entered the study area. With the intrusion of Typhoon Wipha on September 16, the average SST decreased to its minimum. When Typhoon Nari left the area on September 17, the SST started to increase. When Typhoon Wipha disappeared on September 19, the SST rose to 25.47℃, similar to its pre-typhoon level(Fig. 3).

|
| Figure 3 Diurnal variation of average sea surface temperature (SST) within the study area from September 1–22, 2007(unit: ℃) |
The ChlChl- a concentration increased markedly after the passage of the typhoons (Fig. 4). The MDA-ChlChl- a in the study area increased from 1.21 mg/m3 before (Fig. 4a), to 1.35 mg/m3, after the passage of the typhoons(Fig. 4b), with an average rate of increase of 11.54%. Overall, the ChlChl- a concentration of the coastal waters(box A) was higher than in the offshore waters(box B). In box A, the MDA-ChlChl- a was 2.24 and 2.71 mg/m3 before and after the passage of the typhoons, respectively. There was a prominent tongue of water with high ChlChl- a concentration from the coast to the central southern YS, both before and after the passage of the typhoons. As the ChlChl- a concentrations were lower in the open-sea area of the ECS(box B), it was difficult to observe differences in ChlChl- a concentration before and after the passage of the typhoons using the same scale as in the near-shore waters. Therefore, box B was magnified to a smaller scale, as shown in Fig. 4. The remarkable color differences indicated a significant increase in ChlChl- a after the passage of the typhoons; the MDA-ChlChl- a increased from 0.106 to 0.129 mg/m3, which equates to a 21.69% increase on the average in box B, much larger than that of the entire study area.

|
| Figure 4 Distribution of the multi-day-average ChlChl- a concentration from MODIS |
In September, the average daily ChlChl- a concentration in box B (near to the southeast of the ECS, which is an open-sea area with close to Case-I waters) had a trend of “Low-High-Low”(Fig. 5). From September 1 to 13 (before the typhoons), average ChlChl- a concentration was only 0.10 mg/m3 in box B. From September 13 to 14, average ChlChl- a concentration increased from 0.079 to 0.14 mg/m3, i.e., a 75% increase. During the period of the typhoons from September 14–21, average Chla concentration in box B was about 0.15 mg/m3, with an average increase of 50% compared with before the typhoons. On both September 18 and 19, ChlChl- a concentration reached its peak(>0.17 mg/m3)After September 22, ChlChl- a concentration gradually returned to its normal rep-typhoon level.

|
| Figure 5 Diurnal variation in average daily ChlChl- a concentration from September 1–25, 2007 in open-sea area(box B of Fig. 1)(unit: mg/m3) |
After the passage of the typhoons, the SSC within the study area increased notably, especially in coastal waters, such as near the CRE and north of the Jiangsu Shoal(Figs. 1, 6). The MDA-SSC within the study area was 9.54 mg/L before the passage of the typhoons and it increased to 11.84 mg/L after the passage of the typhoons, i.e., an average increase of 24.18%. Bins 16 and 21, located close to Hangzhou Bay and the CRE, respectively, had the highest SSCs in box A. In both bins, the MDA-SSC was >100 mg/L both before and after the passage of the typhoons. In bin 16, the SSC increased to 164.86 mg/L after the passage of the typhoons(an increase of 32%). In the offshore ECS (box B), the MDA-SSC was very low both before and after the passage for the typhoons, i.e., only 0.18 and 0.17 mg/L, respectively. After the passage of the typhoons, increases in the SSC occurred mainly in coastal waters, while it hardly changed in the offshore waters of the ECS.

|
| Figure 6 Distribution of multi-day-average suspended sediment concentration (MDA-SSC) from MODIS |
the outer ECS In the offshore area of the ECS, both temperature and salinity (as measured in situ by CTDs) varied in the upper ocean layer during the passage of the typhoons. Temperature and salinity data at station p1 are shown in Fig. 7. It should be noted that during the passage of the typhoons, many data were lost; however, the variations in temperature and salinity were clear at p1. At p1, the surface temperature measured by the CTD was 29.95, 28.82, and 28.73℃ on September 4(red), 14(blue), and 18(black), respectively. The average water temperature below 700 m was 19.49, 18.69, and 18.85℃ on September 4, 14, and 18, respectively. This indicated a clear decrease in water temperature within the upper layer during the passage of the typhoons.

|
| Figure 7 (a) and (b) seawater temperature measured by CTD at station p1; red line denotes data from September 4, 2007 (before the passage of the typhoons); blue and black lines denote data from September 14 and 18, 2007(during the passage of the typhoons), respectively(unit: ℃);(c) salinity measured by CTD; blue, black, and red lines indicate data from September 4, 14, and 19, 2007, respectively |
Temperature and salinity profiles at station p1 showed clear changes before and after the typhoons (Fig. 5). The MLD was at about 44 m on September 4, with a high SST of 28.89℃. During and after the passage of the typhoons, the MLD deepened to 55 m on September 14 and 75 m on September 18, with low SSTs of 27.85 and 27.75℃, respectively(Fig. 7a, b). Salinity profiles from the surface to a depth of 1 000 m were “S” shaped, which is typical of oceanic waters. Shallower than 600 m, salinity was markedly lower on September 14 and 19 compared with September 4. At 20-m depth, salinity declined by about 0.28 during and after the passage of the typhoons(Fig. 7c).
Temperature profiles at stations p2–p5 showed clear changes during the typhoons(Fig. 8). The MLD at p2 was about 40 m on September 8 with a high SST of 29.87℃. During and after the passage of the typhoons, the MLD deepened to 50 m on September 13 and it was deeper than 60 m by September 18, with SSTs of 29.14 and 28.56℃, respectively. At p3, the MLD was about 50 m with a high SST of 29.26℃ on September 3 and at 55 m with a low SST of 27.11℃ on September 13. At p4, the MLD was about 44 m with a high SST of 29.36℃ on September 7 and at 54 m with a low SST of 27.09℃ on September 19. At p5, the MLD was about 70 m on both September 14 and 18, but the SST declined from 28.56 to 26.88℃ between those dates(Fig. 8a–d).

|
| Figure 8 Water temperature profiles derived from CTDs at stations p2–p5 before and after the passage of the typhoons |
The upwelling was much stronger than usual during the typhoons. The EPV was very small, i.e., <4×10 -5 m/s on September 8. On September 15, the two strong typhoons entered the study area with maximum wind speeds of >50 m/s, by which time the EPV was >1×10 -4 m/s, with a maximum of up to 3.5×10 -4 m/s near the center of the eddy region(Fig. 9).

|
| Figure 9 Wind vectors and upwelling |
The average rainfall rate before and during the passage of the typhoons is shown in Fig. 10. From September 5–12, the average rainfall rate within the study area was very low, except to the south of Cheju Island. However, during the passage of the typhoons (September 13–20), rainfall covered almost the entire study area, and the rainfall rate was much higher than before, especially in the coastal waters of the YS and ECS. The highest rainfall rate was approximately 3 mm/h north of the Taiwan Strait. This heavy rainfall reduced SST and increased nutrient levels in the upper layers of the ocean, with sedimentation of the particulate matter(PM) within the rain(Li and Zhang,2013).

|
| Figure 10 Average rainfall rate within the study area |
During the passage of the typhoons, there was considerable decline in both the SST and the water temperature within the upper layer of the study area, consistent with the findings of other researchers (Price, 1981; Walker et al., 2005; Prasad and Hogan, 2007; Zhao et al., 2008; Fu et al., 2009a, b; Liu et al., 2009; Shi and Wang, 2011). There are three suggested mechanisms for these reductions in temperature.
First, stronger vertical mixing occurred during the passage of the typhoons, which was evident in the deepening of the thermocline. On September 4, the thermocline was at 39–54 m with a temperature gradient of 0.16℃/m, which reduced to 0.067℃/m on September 14(Fig. 7a, b). On September 18, it deepened to 75 m with a temperature gradient of 0.01℃/m. Figure 7 shows temperature–depth profiles from the surface to 150 m, with declines that were more gradual on September 14 and 18 than on September 4. At stations p1–p5, the temperature gradient weakened significantly from the surface to the subsurface layer and the MLD deepened during the passage of the typhoons(Fig. 8). Enhanced vertical mixing due to the typhoons made the ocean water temperature more homogeneous. Compared with the temperature on September 4, the average water temperature in the upper layer increased by 0.6℃ on September 14 and the MLD deepened from 54 to 120 m. On September 18, the temperature declined by 1.21℃ and the MLD deepened from 54 to 200 m, compared with the pre-typhoon situation. There was a prominent thermal inversion layer during the passage of the typhoons(Fig. 7a, b). When the SST decreased during the passage of the typhoons, the latent heat was removed by the wind. Furthermore, part of the sensible heat was transmitted into the sub-surface layer, as indicated by the increase of the water temperature within this layer.
Previous studies have indicated that vertical mixing is the main reason for the decline in SST after the passage of a typhoon. Prasad and Hogan(2007) performed numerical simulations to interpret the mechanism that triggered SST cooling after Hurricane Ivan in the Gulf of Mexico using the Hybrid Coordinate Ocean Model and they determined that about 64% of the cooling was due to vertical mixing resulting from the turbulence generated by the strong shear stress across the base of the mixed layer. In this case, strong vertical mixing played an important role in the SST decline as the two typhoons passed through the YS and ECS.
Second, greater rainfall during the passage of the typhoons caused a decline in the SST(Fig. 10). The typhoons brought a considerable amount of rain to the eastern area of China and over the study area. Thus, there was increased runoffinto the YS and ECS, with its cooler temperatures reducing the overall SST, especially in coastal waters. Thus, during the passage of the typhoons, the SST declined more in the nearshore waters of the study area than in the offshore waters(Fig. 2). At the same time, enhanced rainfall during the passage of the typhoons might have caused the reduced surface salinity observed at station p1 (Fig. 7c).
Third, stronger upwelling caused by the passage of the typhoons brought deeper colder water to the upper layers and thus, cooled the surface waters (Fig. 9). Previous studies(Lin et al., 2003a, b; Prasad and Hogan, 2007; Zheng and Tang, 2007; Fu et al., 2008, 2009a, 2009b; Zhao et al., 2008) have indicated that the intensity of a cyclone is an important factor in triggering upwelling that results in reduced SST.
Price(1981)highlighted that the large drop in SST occurs to the right of the typhoon’s track; a phenomenon also observed by Stramma et al.(1986), Walker et al. (2005), Fu et al.(2009b), and Shi and Wang(2011). This has been named the “right bias effect” of the SST in response to typhoons. In this study, bins 15, 20, 25, and 30 were located on the right-hand side of the paths of the two typhoons. However, they were not in the areas where SST decreased markedly; indeed, the greatest decline was seen in bins 22, 23, 27, 28, 32, and 33, which were located between the tracks of the typhoons, near the coastal waters of the YS and ECS. Heavier rainfall in these areas led to a decline in SST. Furthermore, Typhoons Nari and Wipha caused strong vertical mixing between their two paths, which led to the minimum SSTs being recorded on September 16 and 17, 2007.
4.4 Mechanism of the increase of the ChlChl- aconcentration Phytoplankton requires nutrients, light, and an appropriate temperature for growth(Gabric and Parslow, 1989; Behrenfeld et al., 2006; Tang et al., 2006a, b). The Yellow Sea Cold Water Mass, Changjiang River diluted water(CRDW), Taiwan Strait warm water, and the Kuroshio subsurface water are important environments in the YS and ECS, which have seasonal variations in both scale and characteristics(Quan et al., 2013), which determine the biological-environmental relationships within the study area. Coastal waters of this area have high levels of nutrients, chlorophyll concentration, and biomass due to the intrusion and diffusion of the CRDW, whereby large amounts of terrestrial detritus, suspended sediments, nutrients, and pollutants are carried into the continental YS and ECS(Wang, 2003; Fu et al., 2014). This intrusion has far-reaching influences on the ecology, environment, and resources of the region. In the offshore area(500 km from the CRE, usually east to 125 °E), the waters are typically oligotrophic, usually with very low plankton growth rates and chlorophyll concentrations(Pu et al., 2000; Wang et al., 2012). Under enhanced water conditions, such as during typhoons and tsunamis, the oligotrophic ocean might experience higher chlorophyll concentrations and even phytoplankton blooms(Tang et al., 2002, 2003, 2004a, 2003, b; Fu et al., 2008, 2009a, b).
In the offshore waters(i.e., box B of the study area; Fig. 1), the ChlChl- a concentration was generally low with poor nutrients. However, during the passage of Typhoons Nari and Wipha, there was a sharp rise in MDA-ChlChl- a concentration of 21.67% in box B, while only an 11.54% increase was observed across the entire study area. We suggest three possible reasons for this phenomenon.
First, high ChlChl- a concentration usually appears subsurface in open-sea areas(Fu et al., 2014). When the typhoons passed through the study area, the MLD deepened and the temperature gradient decreased (Figs. 7 and 8), leading to strong vertical mixing between the warm surface water and cold subsurface water, which subsequently brought additional ChlChl- a directly to the surface.
Second, in oligotrophic sea areas, abundant nutrients are usually located in the subsurface and deeper cooler waters (Lin et al., 2003a, b; Shi and Wang, 2011; Fu et al., 2014). Strong mixing and upwelling(as indicated in Fig. 9) can cause higher levels of nutrients to be brought to the surface (Lin et al., 2003a, b; Babin et al., 2004; Miller et al., 2006; Shi and Wang, 2011), promoting rapid phytoplankton reproduction and thus, increasing the ChlChl- a concentration. Some researchers have indicated that this increase of ChlChl- a concentration, derived by remote sensing, might be overrating in the strong wind(Hoge and Lyon, 2002; Acker et al., 2009). The mixing and upwelling associated with typhoons and hurricanes brings colored dissolved organic matter (CDOM) to the surface. The intensified absorption coefficient of the CDOM complicates the interpretation of elevated ChlChl- a concentrations being attributable solely to the increase in phytoplankton concentration, especially in the complex coastal waters(Acker et al., 2009). In offshore waters, such as the open-sea area far from the CRE(box B with depth of about 1 000 m; Fig. 1), the SSC, nutrients, and CDOM from the CRE are very low(Lei et al., 2009; Wu et al., 2013; Fu et al., 2014; Liu, 2014; Ma, 2014). From summer to autumn, the absorption coefficients of the CDOM at 443 and 555 nm in this area are only about 0.01/m (Lei et al., 2009), and the absorption band is affected by the components of the CDOM(Ma, 2014). Although a certain elevation of the CDOM in the surface resulted from the mixing and upwelling during the passage of the typhoons, the contribution of the elevated CDOM to the ChlChl- a concentration might be weak. Meanwhile, the contribution rate from CDOM to the ChlChl- a concentration is difficult to distinguish and it remains a subject for future research.
Third, although the overall SSC increased significantly within the study area during the passage of the typhoons, the SSC in the offshore area remained almost the same as before the typhoons. Thus, there was very little transportation of the increased suspended sediment in the coastal waters to the offshore waters, despite the strong diffusion, mixing, and entrainment resulting from the passage of the two typhoons. Subsequently, there were no discernible increases in nutrient concentrations in the offshore waters during the passage of the typhoons because of diffusion from the coastal waters. Many researchers have indicated that the offshore area of the ECS (box B; Fig. 1) has low SSC and is oligotrophic(Wang et al., 2008; Shi and Wang, 2012; Fu et al., 2014; Liu, 2014). Therefore, the nutrients in the upper layer could have been derived mainly from the strong mixing and upwelling caused by the passage of the typhoons.
During the past few decades, anthropogenic emissions of aerosol precursors have increased considerably in China because of the rapid increase in industrial activities(Choi et al., 2008). This PM not only contains a large amount of harmful substances, such as SO 2, NO 2, and heavy metals, but it also includes considerable quantities of organic matter and nutrients, such as NO 3 and NH 4(Yun et al., 2013). Because of strong winds or precipitation, these substances will settle to the earth’s surface, thereby reducing the PM concentration in the air(Li and Zhang, 2013). During the passage of the typhoons, there was continuous and widespread heavy rainfall (Fig. 10), which resulted in the deposition of many nutrients from the atmosphere to the ocean surface. These conditions would have been beneficial for phytoplankton growth and thus, could have led to the increase in ChlChl- a concentrations in the offshore waters. As vigorous phytoplankton growth takes approximately six days(Fu et al., 2009a), the maximum ChlChl- a concentration in box B(Fig. 1) occurred on September 19, 2007, six days after Typhoon Nari entered the region.
In the coastal waters (i.e., box A; Fig. 1), high levels of nutrients and sediment were observed during the passage of the two typhoons, with runoffand rainfall bringing additional nutrients into the coastal waters. This was shown by the substantially increased SSC in the coastal waters during the passage of the typhoons (Fig. 6). However, transparency was generally low in the coastal waters of the YS and ECS, on average <1 m(Zhu and Zhao, 1991) in the CRE and Hangzhou Bay areas. Strong vertical mixing and resuspension of sediment during the passage of the typhoons decreased the water transparency. The absence of solar radiation was unfavorable for photosynthesis by phytoplankton and thus, the ChlChl- a concentration increased. In this study, the ChlChl- a concentration derived by MODIS clearly increased in the coastal waters after the passage of the typhoons, which might have occurred for three reasons. First, Zhao et al.(2009)reported that the near-shore bloom in the Pearl River Estuary was probably due to increased discharge and favorable currents during the occurrence of a typhoon. During the passage of Typhoons Nari and Wipha, a large amount of rainfall led to increased discharge and stronger currents from the CRE, which could have carried vast numbers of phytoplankton. The increased level of ChlChl- a concentration might have also been derived from the subsurface via mixing and upwelling (Lin et al., 2003a, b; Babin et al., 2004; Miller et al., 2006; Fu et al., 2008, 2009a, b; Zhao et al., 2009). Second, many studies have shown that increases in remotely-sensed ChlChl- a concentration were misinterpreted in standard water color processing of MODIS data because of the contributions of the nearinfrared band for Case-II waters(Acker et al., 2002; Wren and Leonard, 2005; Hu and Muller-Karger, 2007). Third, the elevated CDOM associated with the discharge from the mainland, and the mixing and upwelling in the CRE and adjacent waters during the occurrence of a typhoon should increase the ChlChl- a signal(Hoge and Lyon, 2002; Acker et al., 2009). In short, the coastal waters of the YS and ECS are typical Case-II waters and thus, the higher ChlChl- a concentrations derived by MODIS after the passage of the typhoons might be due to larger errors attributable to higher SSCs and CDOM, especially in box A(Fig. 1).
5 CONCLUSIONThe SST in the YS and ECS dropped sharply during and after the passage of Typhoons Nari and Wipha in 2007, especially in coastal waters and in areas between the tracks of the two typhoons, rather than on the right-hand sides of the two tracks. In the southeast of the study area, strong vertical mixing and a deeper MLD were observed. With strong mixing, upwelling, high levels of rainfall, and the influx of colder diluted water from the CRE during the passage of the typhoons, the SST dropped obviously. However, the ChlChl- a concentration increased markedly within the study area both during and after the passage of the typhoons, with the greatest increase in the offshore waters in the southeast of the ECS. These changes might be linked to higher concentrations of ChlChl- a in the subsurface, brought into the upper layer via strong mixing and upwelling during, as well as to vigorous growth of surface phytoplankton under optimal conditions of abundant nutrients, suitable temperatures, and high transparency in offshore areas during the passage of Typhoons Nari and Wipha.
| Acker J G, Brown C W, Hine A C, et al, 2002. Satellite remote sensing observations and aerial photography of storminduced neritic carbonate transport from shallow carbonate platforms. Int. J. Remote Sens., 23 (14) : 2853 –2868. Doi: 10.1080/01431160110106122 |
| Acker J, Lyon P, Hoge F, et al, 2009. Interaction of Hurricane Katrina with optically complex water in the Gulf of Mexico: interpretation using satellite-derived inherent optical properties and chlorophyll concentration. IEEE Geosc. Remote S ens. L ett., 6 (2) : 209 –213. Doi: 10.1109/LGRS.2008.2007658 |
| Babin S M, Carton J A, Dickey T D, et al, 2004. Satellite evidence of hurricane-induced phytoplankton blooms in an oceanic desert. J. Geophys. Res. Oceans, 109 (C3) : C03043 . |
| Behrenfeld M J, O'Malley R T, Siegel D A, et al, 2006. Climatedriven trends in contemporary ocean productivity. Nature, 444 (7120) : 752 –755. Doi: 10.1038/nature05317 |
| Chang J, Chung C C, Gong G C, 1996. Influences of cyclones on chlorophyll a concentration and Synechococcus abundance in a subtropical western Pacific coastal ecosystem. Mar. Ecol-Prog. Ser., 140 (1-3) : 199 –205. |
| Chen C T A, Liu C T, Chuang W S, et al, 2003. Enhanced buoyancy and hence upwelling of subsurface Kuroshio waters after a typhoon in the southern East China Sea. J. Mar. Syst., 42 (1-2) : 65 –79. Doi: 10.1016/S0924-7963(03)00065-4 |
| Choi Y S, Ho C H, Kim J, et al, 2008. The impact of aerosols on the summer rainfall frequency in China. J. Appl. Meteorol. Clim., 47 (6) : 1802 –1813. Doi: 10.1175/2007JAMC1745.1 |
| Chu C, 1979. Physical Geography of China-Ocean Geography. Beijing: Science Pressp.6-14. |
| Dickey T, Frye D, Mcneil J, et al, 1998. Upper-ocean temperature response to Hurricane Felix as measured by the Bermuda Testbed Mooring. Mon. Weather Rev., 126 (5) : 1195 –1201. Doi: 10.1175/1520-0493(1998)126<1195:UOTRTH>2.0.CO;2 |
| Fu D Y, Ding Y Z, Liu D Z, et al, 2009a. Delayed effect of typhoon on marine chlorophyll-a concentration. Journal of Tropical Oceanography, 28 (2) : 15 –21. |
| Fu D Y, Pan D L, Ding Y Z et al. 2008. Statistic study of effect of the sea surface temperature caused by typhoon based on remote sensing. Proc. SPIE, 7153, http://dx.doi.org/10.1117/12.804901. |
| Fu D Y, Pan D L, Mao Z H et al. 2009b. The effects of chlorophyll-a and SST in the South China Sea area by typhoon near last decade. Proc. SPIE, 7478, http://dx.doi.org/10.1117/12.830215. |
| Fu D Y, Pan D L, Wang D F, et al, 2014. The analysis of phytoplankton blooms offthe Yangtze River Estuary in the spring of 2007. Aquat. Ecosyst. Health. Manag., 17 (3) : 221 –232. |
| Gabric A J, Parslow J, 1989. Effect of physical factors on the vertical distribution of phytoplankton in eutrophic coastal waters. Mar. Freshwater Res., 40 (5) : 559 –569. Doi: 10.1071/MF9890559 |
| Hazelworth J B, 1968. Water temperature variations resulting from hurricanes. J. Geophys. Res., 73 (16) : 5105 –5123. Doi: 10.1029/JB073i016p05105 |
| Hoge F E, Lyon P E, 2002. Satellite observation of chromophoric dissolved organic matter (CDOM) variability in the wake of hurricanes and typhoons. Geophys. Res. Lett., 29 (19) : 14 –1. |
| Hu C, Muller-Karger F E, 2007. Response of sea surface properties to Hurricane Dennis in the eastern Gulf of Mexico. Geophys. Res. Lett., 34 (7) : L07606 . |
| Kara A B, Rochford P A, Hurlburt H E, 2000. An optimal definition for ocean mixed layer depth. J. Geophys. Res., 105 (C7) : 16803 –16821. Doi: 10.1029/2000JC900072 |
| Lei H, Pan D L, Tao B Y, et al, 2009. The spectral absorption and distribution characteristics of CDOM in the typical waters of the East China Sea. Acta Oceanol. Sin ica, 31 (2) : 57 –62. |
| Li F, Zhang C Z, 2013. Analysis on the relationship between PM2. 5 and the precipitation in Xi'an. Environmental Monitoring in China, 29 (6) : 22 –28. |
| Lin I I, Liu W T, Wu C C, 2003a. Satellite observations of modulation of surface winds by typhoon-induced upper ocean cooling. Geophys. Res. Lett., 30 (3) : 1131 –1135. Doi: 10.1029/2002GL015674 |
| Lin I I, Liu W T, Wu C C, 2003b. New evidence for enhanced ocean primary production triggered by tropical cyclone. Geophys. Res. Lett., 30 (13) : 1718 –1722. |
| Liu K K, Peng T H, Shaw P T, et al, 2003. Circulation and biogeochemical processes in the East China Sea and the vicinity of Taiwan: an overview and a brief synthesis. Deep. Sea. Res. Pt. II, 50 (6-7) : 1055 –1064. Doi: 10.1016/S0967-0645(03)00009-2 |
| Liu X M, Wang M H, Shi W, 2009. A study of a hurricane katrina-induced phytoplankton bloom using satellite observations and model simulations. J. Geophys. Res., 114 (C3) : C3023 . Doi: 10.1029/2008JC004934 |
| Liu X. 2014. Seasonal Variation Research of Suspended Sediments in the East China Sea Based on Remote Sensing. Ocean University of China, Qingdao, China. p.1-69. (in Chinese) |
| Ma H P. 2014. The study on Characteristics and Distribution of Chromophoric Dissolved Organic Matter (CDOM) in the Yellow Sea and the East China Sea. Ocean University of China, Qingdao, China. p.1-91. (in Chinese) |
| Miller W D, Harding Jr L W, Adol J E, 2006. Hurricane Isabel generated an unusual fall bloom in Chesapeake Bay. Geophys. Res. Lett., 33 (6) : L06612 . |
| Morel A, Prieur L, 1977. Analysis of variations in ocean color 1. Limnol. Oceanogr., 22 (4) : 709 –722. Doi: 10.4319/lo.1977.22.4.0709 |
| O'Reilly J E, Maritorena S, Mitchell B G, et al, 1998. Ocean color chlorophyll algorithms for SeaWiFS. J. Geophys. Res., 103 (C11) : 24937 –24953. Doi: 10.1029/98JC02160 |
| Pan D L, Haung H, Mao T et al. 1999. Ocean color remote sensing by SeaWiFS in China, paper presented at 20th Asian Conference on Remote Sensing. Asian Assoc. Remote Sens., Hong Kong. |
| Prasad T G, Hogan P J, 2007. Upper-ocean response to Hurricane Ivan in a 1/25° nested Gulf of Mexico HYCOM. J. Geophysl. Res., 112 (C4) : C04013 . |
| Price J F, 1981. Upper ocean response to a hurricane. J. Phys. Oceanogr., 11 (2) : 153 –175. Doi: 10.1175/1520-0485(1981)011<0153:UORTAH>2.0.CO;2 |
| Pu X M, Wu Y L, Zhang Y S, 2000. Nutrient limitation of phytoplankton in the Changjiang Estuary, I. Condition in nutrient limitation in autumn. Acta Oceanol. Sin ica, 22 (4) : 60 –66. |
| Quan Q, Mao X Y, Yang X D, et al, 2013. Seasonal variation of several main water masses in the Southern Yellow Sea and East China Sea in 2011. J. Ocean Univ. China, 12 (4) : 524 –536. Doi: 10.1007/s11802-013-2198-5 |
| Shi W, Wang M H, 2007. Observations of a Hurricane Katrinainduced phytoplankton bloom in the Gulf of Mexico. Geophys. Res. Lett., 34 (11) : L11607 . Doi: 10.1029/2007GL029724 |
| Shi W, Wang M H, 2011. Satellite observations of asymmetrical physical and biological responses to Hurricane Earl. Geophys. Res. Lett., 38 (4) : L04607 . |
| Shi W, Wang M H, 2012. Satellite views of the BoHai Sea, Yellow Sea, and East China Sea. Prog. Oceanogr., 104 (10) : 30 –45. |
| Stramma L, Cornillon P, Price J F, 1986. Satellite observations of sea surface cooling by hurricanes. J. Geophys. Res., 91 (C4) : 5031 –5035. Doi: 10.1029/JC091iC04p05031 |
| Su J L, 2005. Coastal Waters Hydrology of China. Beijing, China: China Ocean Pressp.42-50. |
| Tang D L, Di B P, Wei G F, et al, 2006a. Spatial, seasonal and species variations of harmful algal blooms in the South Yellow Sea and East China Sea. Hydrobiologia, 568 (1) : 245 –253. Doi: 10.1007/s10750-006-0108-1 |
| Tang D L, Kawamura H, Doan-Nhu H, Takahashi W, 2004a. Remote sensing oceanography of a harmful algal bloom (HAB) offthe coast of southeastern Vietnam. J. Geophys. Res., 109 (C3) : C03014 . |
| Tang D L, Kawamura H, Lee M A, Dien T V, 2003. Seasonal and spatial distribution of chlorophyll-a concentrations and water conditions in the Gulf of Tonkin, South China Sea. Remote Sens. Environ., 85 (4) : 475 –483. Doi: 10.1016/S0034-4257(03)00049-X |
| Tang D L, Kawamura H, Luis A J, 2002. Short-term variability of phytoplankton blooms associated with a cold eddy in the northwestern Arabian Sea. Remote Sens. Environ., 81 (1) : 82 –89. Doi: 10.1016/S0034-4257(01)00334-0 |
| Tang D L, Kawamura H, Shi P, et al, 2006b. Seasonal phytoplankton blooms associated with monsoonal influences and coastal environments in the sea areas either side of the Indochina Peninsula. J. Geophys. Res., 111 (G1) : G01010 . |
| Tang D L, Kawamura H, van Dien T, Lee M A, 2004b. Offshore phytoplankton biomass increase and its oceanographic causes in the South China Sea. Mar. Ecol. Prog. Ser., 268 : 31 –41. Doi: 10.3354/meps268031 |
| Walker N D, Leben R R, Balasubramanian S, 2005. Hurricaneforced upwelling and chlorophyll a enhancement within cold-core cyclones in the Gulf of Mexico. Geophys. Res. Lett., 32 (18) : L18610 . |
| Wang B D, 2003. Nutrient distributions and their limitation on phytoplankton in the Yellow Sea and the East China Sea. J. Appl. Ecol., 14 (7) : 1122 –1126. |
| Wang D X, Zhao H, 2008. Estimation of phytoplankton responses to Hurricane Gonu over the Arabian Sea based on ocean color data. Sensors, 8 (8) : 4878 –4893. Doi: 10.3390/s8084878 |
| Wang F, Kang J C, Zhou S Z, et al, 2008. Nitrate and phosphate conditions and fishery resources in the offshore area of the East China Sea. Resources Sci ence, 30 (10) : 1592 –1599. |
| Wang K, Chen J F, Li H L, et al, 2012. The influence of freshwater-saline water mixing on phytoplankton growth in Changjiang Estuary. Acta Oceanol Sin ica, 32 (1) : 17 –26. |
| Wen T T. 2010. Preliminary Study Of Nutrients in Yellow Sea and the East China Sea and the Cold Eddy northeast of Taiwan. Ocean University of China, Qingdao, China. p.1-109. (in Chinese) |
| Wren P A, Leonard L A, 2005. Sediment transport on the midcontinental shelf in Onslow Bay, North Carolina during Hurricane Isabel. Estuar. Coast. Shelf S ci., 63 : 43 –56. Doi: 10.1016/j.ecss.2004.10.018 |
| Wu S Y, Wu Y S, Zhang S K, 2013. The satellite retrieval of marine yellow substance in Yellow Sea and East China Sea. Oceanologia et Limnologia Sinica, 44 (5) : 1223 –1228. |
| Ye H J, Sui Y, Tang D L, et al, 2013. A subsurface chlorophyll a bloom induced by typhoon in the South China Sea. J. Mar. Syst., 128 : 138 –145. Doi: 10.1016/j.jmarsys.2013.04.010 |
| Yun H, He L Y, Huang X F, et al, 2013. Characterising seasonal variation and spatial distribution of PM2. 5 species in Shenzhen. Environmental Science, 34 (4) : 1245 –1251. |
| Zhao H, Tang D L, Wang D X, 2009. Phytoplankton blooms near the Pearl River estuary induced by Typhoon Nuri. J. Geophys. Res., 114 (C12) : C12027 . Doi: 10.1029/2009JC005384 |
| Zhao H, Tang D L, Wang Y Q, 2008. Comparison of phytoplankton blooms triggered by two typhoons with different intensities and translation speeds in the South China Sea. Mar. Ecol. Prog. Ser., 365 : 57 –65. Doi: 10.3354/meps07488 |
| Zheng G M, Tang D L, 2007. Offshore and nearshore chlorophyll increases induced by typhoon winds and subsequent terrestrial rainwater runoff. Mar. Ecol. Prog. Ser., 333 : 61 –74. Doi: 10.3354/meps333061 |
| Zhu L B, Zhao B R, 1991. Distributions and variations of the transparency in the Bohai Sea, Yellow sea, and East China Sea. Transactions of Oceanology and Limnology (3) : 1 –11. |