 2016, Vol. 34
Institute of Oceanology, Chinese Academy of Sciences
Article Information
- KANG Zhenjun(亢振军), YU Rencheng(于仁成), KONG Fanzhou(孔凡洲), WANG Yunfeng(王云峰), GAO Yan(高岩), CHEN Jianhua(陈建华), GUO Wei(郭伟), ZHOU Mingjiang(周名江)
- Records of bulk organic matter and plant pigments in sediment of the “red-tide zone” adjacent to the Changjiang River estuary
- Chinese Journal of Oceanology and Limnology, 34(5): 915-927
- http://dx.doi.org/10.1007/s00343-016-4313-0
Article History
- Received Nov. 15, 2014
- accepted in principle Dec. 24, 2014
- accepted for publication Jul. 31, 2015


2 University of Chinese Academy of Sciences, Beijing 100049, China;
3 Qinzhou University, Qinzhou 535099, China;
4 Laboratory of Marine Ecology and Environmental Science, Qingdao National Laboratory for Marine Science and Technology, Qingdao 266071, China
Human activities such as fossil-fuel burning, fertilizer application, and land-use changes have changed the global nitrogen and phosphorus cycles significantly over the last several decades, and they have led to extensive eutrophication of fresh waters and coastal zones (Galloway et al., 2004; Filippelli, 2008; Canfield et al., 2010). Cultural eutrophication, which is defined as “excessive plant growth resulting from nutrient enrichment by human activity” (Smith and Schindler, 2009; p.201), has been considered a primary water quality issue of coastal marine ecosystems around the world. Surveys in the USA and Europe have found that about 78% of the assessed USA coast and 65% of Europe’s Atlantic coast exhibited symptoms of eutrophication (OSPAR, 2005; Bricker et al., 2008). Serious eutrophication problems have been reported in many large river estuaries and semi-enclosed bays, e.g., the Baltic Sea, North Sea, Adriatic Sea, Black Sea, Chesapeake Bay, Long Island Sound, and the Gulf of Mexico (Boesch, 2002). Studies of eutrophic coastal waters have found that nutrient over-enrichment would lead to a cascading set of ecosystem changes, ranging from excessive growth of microalgae to more severe secondary impacts such as the loss of subaquatic vegetation, shift in phytoplankton species compositions, and formation of hypoxic “dead zones” (Cloern, 2001; Hagy et al., 2004; Heisler et al., 2008). Among the symptoms of coastal eutrophication, harmful algal blooms (HABs) and hypoxia constitute the most significant ecological consequences (Glibert et al., 2008; Breitburg et al., 2009), both of which have extensive impacts on marine biological resources (Landsberg, 2002; Díaz and Rosenberg, 2008).
In China, coastal waters adjacent to the Changjiang (Yangtze) River estuary constitute the region most notable for cultural eutrophication. As the largest river in China, the Changjiang River brings around 2×10⁶ tonnes of particulate organic carbon, 1.7×10⁶ tonnes of dissolved inorganic nitrogen, and 2×10⁴ tonnes of phosphate-phosphorus annually into the East China Sea (Wu et al., 2007; Shen and Liu, 2009). Over the six decades since the 1950s, nitrate concentration at the mouth of the Changjiang River has increased by about three times, which has led to significant increases of both the N concentration and the N/P ratio in the coastal waters adjacent to the estuary (Wang, 2006; Zhou et al., 2008; Jiang et al., 2010). Meanwhile, both the number and the scale of HAB occurrences have increased dramatically in this region (Zhou et al., 2008; Wang and Wu, 2009). Approximately 30–80 HAB events have been recorded annually from 2000 to 2011 in the East China Sea. Recurrent blooms of dinoflagellates, such as Prorocentrum donghaiense, Karenia mikimotoi, and Alexandrium catenella, have been reported in this region, with the red-tide area exceeding 10 000 km2. Seasonal hypoxic events have also been reported in coastal waters adjacent to the Changjiang River estuary. The hypoxic zone in this region could cover an area of over 10 000 km2. From the late 1990s onwards, the hypoxic zone has been observed over a wide area and the probability of hypoxia events in summer has increased by 90% (Wang, 2009).
Despite the apparent ecosystem changes observed in the coastal waters adjacent to the Changjiang River estuary, little is known regarding the progression of eutrophication and the associated ecosystem changes because of the lack of time series data, particularly prior to 2000. In many eutrophic coastal zones, historical records of the ambient environment are limited in terms of providing a complete picture of past events. Therefore, records preserved in sediments have been scrutinized to establish pre-impact baselines and to reconstruct ecosystem changes in areas affected by eutrophication (Bianchi and Allison, 2009; Gooday et al., 2009). Sediment cores collected from eutrophic areas, such as the northern Gulf of Mexico and Baltic Sea, have been applied successfully in tracing eutrophication history with fine temporal scales (Bianchi et al., 2000; Rabalais et al., 2007). Multiple indicators derived from both the sediment and the water column, such as bulk C, N content, lipids, and pigments, have been adopted in studying the progression of eutrophication and its associated ecosystem changes (Chen et al., 2001; Pinturier-Geiss et al., 2002; Gooday et al., 2009). During a cruise in 2009, a sediment core was collected from the “redtide zone” adjacent to the Changjiang River estuary where HABs occur frequently, to retrieve the eutrophication history and associated ecosystem changes. Multiple proxies including organic carbon (OC), total nitrogen (TN), stable C and N isotopes (δ13C and δ15N), and plant pigments were analyzed.
2 MATERIAL AND METHOD 2.1 Sampling siteThe core was collected on May 22, 2009 from the site (29.5°N, 123.0°E) adjacent to the Changjiang River estuary (Fig. 1) at a depth of 62 m. The sampling site was located in an important mud patch on the continental shelf of the East China Sea (Xu et al., 2012). This site is southeast of the Zhoushan archipelago, which is the largest fishing ground in China (Zhoushan Fishing Ground). An abundant supply of nutrients from the Changjiang, Qiantangjiang, and Yongjiang Rivers and seasonal upwelling supports a high level of primary production. From the beginning of the 21st century, however, recurrent large-scale blooms of dinoflagellates have occurred in this region (Zhou et al., 2008; Wang and Wu, 2009), which have posed significant threats to the fishery resource.

|
| Figure 1 Sampling location (star) of the sediment core in the “red-tide zone” adjacent to the Changjiang River estuary |
The sediment core was collected using a free-fall gravity corer and the length of the core was 57 cm. After collection, the core was capped and frozen immediately at -20°C. After the cruise, the core was thawed and subdivided at 1-cm intervals for the upper 20 cm and at 2-cm intervals for the remainder of its length. The sediment of the core was composed mainly of gray-black fine clay and silt with no apparent change of color or sign of bioturbation. For each layer sampled along the core, sediment from the marginal area was removed carefully to prevent potential interference by the tube wall and then, the remainder of the sediment was mixed thoroughly before further analysis.
2.3 Radionuclide analysesTwelve sub-samples at different depths were dried in an oven at 105°C overnight and then ground to fine particles prior to the analysis of radionuclides. Activity of 137Cs was analyzed by a gamma-ray spectroscopy (Canberra, Meriden, Connecticut, USA), and the specific 210Pb activity (i.e., the total and excess 210Pb specific radioactivity) was measured using a 576A Alpha spectrometer (EG & G ORTEC, Oak Ridge, Tennessee, USA) according to DeMaster et al. (1985) and Wang et al. (2014). To determine the 210Pb activity, a known quantity of 209Po standard was spiked into the sediment samples to determine the extraction yield, and the 210Pb activity was measured indirectly through determination of the 210Po by alpha counting. Based on the profile of 210Pb activity, a constant initial concentration model (supposing the 210Pb activity and the mass of the deposited materials are constant) was used to calculate the sedimentation accumulation rate within the timescale of 100 years (Zaborska et al., 2007):
 (1)
(1)where Ax is the 210Pbex activity at layer x, A0 is the 210Pbex activity at the surface layer, λ is the decay constant (0.031/a) of 210Pb, and υ is the sediment accumulation rate.
2.4 Organic carbon, total nitrogen and stable C, N isotope analysesLayered samples of the sediment core from depths between 4 and 40 cm were selected (every 2–3 cm) and analyzed for OC, TN, and stable C and N isotopes. A fraction of the sediment samples was lyophilized using an Alpha 1-2 LDplus freeze dryer (Christ, Osterode am Harz, Germany). Then, 0.5 g of the lyophilized samples were weighed and acidified with 6% HCl (wt%) for 48 h to remove carbonates, following which the samples were freeze-dried, homogenized, and weighed. An approximate 20-mg sample was weighed accurately and carefully crimpsealed in a tin capsule. The bulk content of OC and TN were measured using a Flash EA 1112 elemental analyzer (Thermo Scientific, Waltham, Massachusetts, USA), and the stable C and N isotopes were measured using an IsoPrime stable isotope ratio mass spectrometer (GV Instrument, Manchester, UK). The samples were calibrated with standard urea 1170 (δ13C vs. PDB=-27.00±0.02‰; δ15N vs. SMOW=5.00±0.03‰) from Elementar (USA), which was calibrated periodically in the laboratory against international isotope standards (IAEA N1). The relative precision based on repeated measurement of the standard was estimated at 0.12‰.
2.5 Pigment analysisPigments in the lyophilized sediment samples were extracted using the method of Reuss et al. (2005) with little modification. Briefly, 2 g of the freeze-dried and homogenized sediment sample was spiked with 100 μL 8'-apo-β, φ-Apocarotenal solution as an internal standard, and extracted with 3 mL HPLC grade methanol in a 10-mL glass centrifuge tube. The mixture was sonicated in an ice bath for 5 min and stored at -20°C overnight. Supernatant separated from the sediment after centrifugation (5 min, 5 000 r/min, 4°C) was filtered through a 0.22 μ m nylon syringe filter (Anpel, Shanghai, China) and blown dry under N2 flow. The extracts were re-dissolved in 1 mL methanol, and an aliquot (700 μ L) of methanol solution was mixed with 140 μ L Milli-Q water just prior to the high-performance liquid chromatography (HPLC) analysis.
The pigments were analyzed following the method developed by Zapata et al. (2000), using the Waters Alliance HPLC system (Waters, Milford, Massachusetts, USA), which consists of a Waters e2695 separation module and a Waters 2998 photodiode array detector (PDA) run under the Waters Empower 2 software. The pigments were separated through a reversed-phase Waters Symmetry C8 column (i.d. 150 mm×4.6 mm, 3.5-μm particle size) using a gradient method with two mobile phases. Mobile phase A was a mixed solution of methanol, acetonitrile, and 0.25 mol/L aqueous pyridine solution (50:25:25 v/v/v, pH 5.0), and mobile phase B was methanol, acetonitrile, and acetone (20:60:20, v/v/v). The gradient started from 100% mobile phase A at the beginning, and then ramped to 50% A in 22 min, 20% A in 28 min, 5% A in 40 min, which was maintained for another 3 min, and then increased back to 100% A and run isocratically for 2 min. The flow rate was 1 mL/min. Samples were kept at 4°C and the injection volume was 100 μL. Pigments were quantified at 440 nm except for chlorophyll a and its degradation products, which were quantified at 666 nm to avoid potential interference from carotenoids. The spectrum from 300 to 750 nm was also recorded simultaneously for qualitative identification of routine pigments.
Identification of pigments was achieved by cochromatography with authentic standards (DHI Water & Environment, Hørsholm, Denmark). Quantification of pigments was performed using the internal standard method, based on calibration curves established with the authentic pigment standards. Pigments without standards were identified based on the PDA spectra and were quantified based on the molar extinction coefficient from the references (Jeffrey, 1968; Wright and Jeffrey, 1987; Wright et al., 1991; Jeffrey and Vesk, 1997).
3 RESULT 3.1 Sediment chronologyAs the 137Cs activity within the sediment core was too low for use in the interpretation of sediment chronology, only 210Pb data were considered in dating the sediment core. The total 210Pb radioactivity exhibited a profile of down-core exponential decrease (Fig. 2a). Based on the constant initial concentration model, the sediment accumulation rate was estimated to be 0.27 cm/a. The core could be dated back to the 1910s at the depth of 30 cm, assuming that the sediment accumulation rate had been constant during the intervening period.

|
| Figure 2 Profiles of (a) total and (b) excess 210Pb radioactivity in the sediment core collected from the red-tide zone adjacent to the Changjiang River estuary |
Profiles of OC and δ13C within the core are illustrated in Fig. 3a, c. OC values within the core ranged from 0.21% to 0.32% (dry weight, mean=0.25±0.03, n=13). An apparent increase of OC content started from the 1970s, which reached a maximum value (0.32%) at around 2000, following which it decreased slightly to 0.27% in the mixed layer. The δ13C values within the core ranged from -23.4‰ to -20.4‰. An enrichment of 13C (between -22‰ and -20.5‰) concurrent with the rapid increase of OC content after the 1970s was observed, whereas before the 1970s, the δ13C values were mainly within the range of -23‰ to -22‰.

|
| Figure 3 Profiles of (a) organic carbon, (b) total nitrogen, (c)δ13C, (d)δ15N, and (e) molar C/N ratio within the sediment core |
TN values within the core ranged from 0.005% to 0.029% (dry weight, mean=0.014±0.009, n=13), and the profile of TN showed a similar variational pattern to OC, i.e., rapid increase after the 1970s. The value of δ15N ranged from 3.7‰ to 7.1‰. The values varied significantly and no clear pattern could be observed. The molar C/N ratio within the core decreased significantly from values of around 40 early in the 20th century to around 10 after 2000.
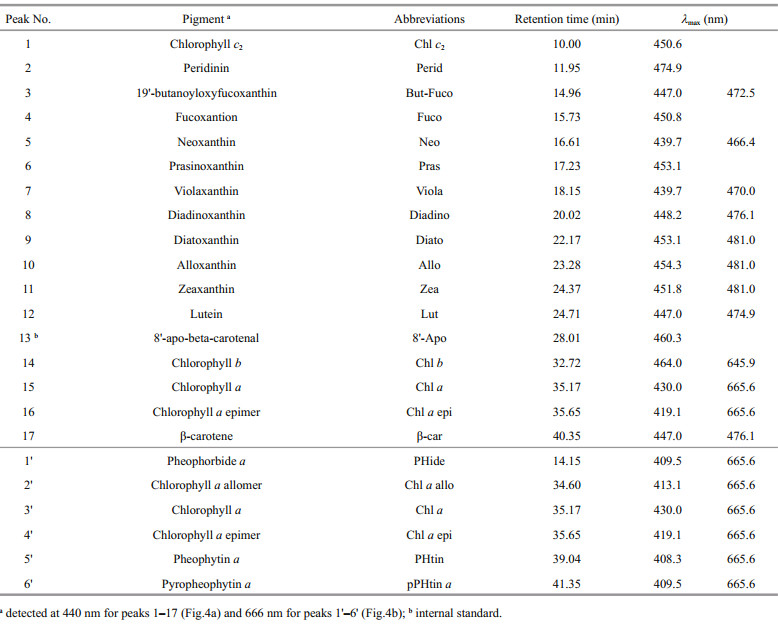
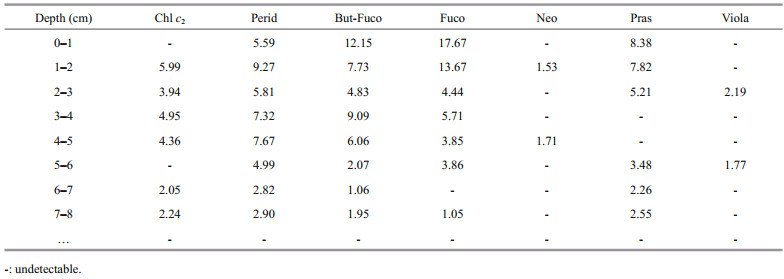
3.4 PigmentsPigments detected from the sediment core are listed in Table 1. Chlorophyll a, β -carotene, diadinoxanthin, diatoxanthin, alloxanthin, zeaxanthin, and lutein were more abundant than other pigments and were present in most of the sediment samples (Figs. 4–6). Concentrations of the other pigments detected are listed in Table 2.
 |

|
| Figure 4 Chromatograms of a layered sediment sample (section 0–1 cm) of the sediment core for plant pigments detected at (a) 440 nm and (b) 666 nm The numbers in the chromatograms are listed in peak No. of Table 1. |

|
| Figure 5 Profiles of chlorophylls in the sediment core, including (a) chlorophyll a (Chl a), (b) pheophorbide a (PHide a), (c) pheophytin a (PHtin a), (d) pyropheophytin a (pPHtin a), (e) total chlorophyll a (TChl a), and (f) the ratio of chlorophyll a to its degradation products (Chl a/deg a) |
Profiles of chlorophyll a and its degradation products in the core are illustrated in Fig. 5. Chlorophyll a was mainly detected in the upper 15 cm of the sediment core. The variational pattern of total chlorophyll a (chlorophyll a and its degradation products) generally followed the profile of OC, and the ratio of chlorophyll a to its degradation products exhibited no significant variation throughout the core.
Profiles of the carotenoids within the core are shown in Fig. 6. Most of the carotenoids showed gradual up-core increases over the last century. After the 1970s, however, carotenoids representative of different microalgal groups showed distinct responses. The profile of β -carotene, another ubiquitous pigment for phytoplankton, closely resembled the variational pattern of OC along the core. Diatoxanthin, which is representative of diatoms, also exhibited a profile similar to OC, with a rapid increase after the 1970s and a slight decrease in the mixed layer. Alloxanthin, however, decreased dramatically after the 1970s, which led to apparent peaks (maximum content at 5 ng/g dw) in the 1960s and 1970s. Zeaxanthin and lutein increased gradually up-core with no significant changes in the 1990s. The content of diadinoxanthin, which is often present in dinoflagellates, was relatively stable throughout the core and increased rapidly only at the surface layer.

|
| Figure 6 Profiles of carotenoids in the sediment core, including (a) β-carotene (β-car), (b) diatoxanthin (Diato), (c) diadinoxanthin (Diadino), (d) alloxanthin (Allo), (e) zeaxanthin (Zea), and (f) lutein (Lut) |
Because of the lack of 137Cs activity data, the chronology of this core was based only on 210Pb radioactivity. The mean accumulation rate calculated was 0.27 cm/a, a value that is within the range of sediment accumulation rate found previously within this region (DeMaster et al., 1985; Xia et al., 2004; Xu et al., 2012).
Analysis of the bulk organic matter of the core indicated a significant up-core increase of OC content after the 1970s. The increasing OC content, concurrent with the maximum δ13C values and minimum C/N ratios in the core after the 1970s, strongly supports the accumulation of organic matter originated from marine primary production during this period.
As one of the useful chemical markers, the stable isotope of C provides an integrated history of the sources and pathways of OC within sediment (Zhang et al., 2007; Rosenbauer et al., 2009), and it has been used to distinguish between terrestrial and marine sources of organic matter (Mead et al., 2005; Wang et al., 2008). The range of δ13C from -30‰ to -26‰ was generally considered indicative of terrestrial origin, and the range -22‰ to -18‰ indicative of marine phytoplankton production (Struck et al., 2000; Sampaio et al., 2010). In the East China Sea, the reported value of δ13C of phytoplankton was from -21‰ to -19‰, while that of terrestrial organic matter was from -27‰ to -25‰ (Zhang et al., 2007; Yu et al., 2012). The apparent enrichment of 13C (values between -23.0‰ and -22.0‰ before the 1970s; and between -22.0‰ and -20.5‰ after the 1970s), concurrent with the increase of OC content after the 1970s, suggested that the organic matter that accumulated during this period was mainly from marine primary production.
The marine origin of the recently accumulated organic matter was also supported by the molar C/N ratios. Organic matter from terrestrial origin generally has a much higher C/N ratio (>20) than algae in the sea (4–10) because of the high cellulose content in vascular plants of terrestrial origin (Meyers, 1994). The decreasing trend of the C/N ratio from the bottom (around 40) to the surface (around 10) of the core indicated a significant contribution of marine primary production in supplying organic matter to the sediment over the last four decades.
The up-core increase of OC content is often considered a symbol of increasing organic matter supply and cultural eutrophication (Gooday et al., 2009). In many coastal ecosystems, such as the North Sea, Baltic Sea, west coast of India, Chesapeake Bay, and Gulf of Mexico, up-core increases of OC content were found closely related to coastal eutrophication (Struck et al., 2000; Pinturier-Geiss et al., 2002; Turner et al., 2006; Kurian et al., 2009). In the sea area adjacent to the Changjiang River estuary, increased primary production has been described in previous studies. For example, a significant increase of the phytoplankton standing stock in spring has been reported, based on the synthesis of previous investigations in the red-tide zone (Zhou et al., 2008). In another study, Ning et al. (2011) found that the primary productivity and phytoplankton abundance has increased significantly since 1989, based on a long-term survey of the 32°N transect across the coastal waters. The study area is also the most significant region for HABs in the coastal waters of China, and the up-core increase of OC content within the sediment coincided with the historical records of red-tide events prior to 2009 in the East China Sea (Fig. 7).

|
| Figure 7 Comparison of the up-core profiles of (a) organic carbon and (b) historical records of red-tide events in the East China Sea |
Most previous studies have attributed the enhancement of primary production in the red-tide zone to over-enrichment of N (Zhou et al., 2008). N used to be the principal limiting macro element in most coastal ecosystems, and an increase in the supply of N could accelerate the synthesis of OC and lead to coastal eutrophication (Howarth and Marino, 2006). In estuarine and coastal marine ecosystems, the importance of N in driving the eutrophication process has been emphasized over the last two decades (Howarth, 2005; Howarth and Marino, 2006; Rabalais et al., 2007). Since the 1950s, the concentration of nitrate at the mouth of the Changjiang River has increased by at least three times (Zhou et al., 2008). In this study, it was also observed that an obvious accumulation of total N within the sediment has occurred since the 1970s.
Organic matter preserved within the sediment reflects the balance between organic matter supply and diagenesis, which have a close relationship with the status of coastal eutrophication and bottom-water hypoxia. Therefore, the potential role of hypoxia in the accumulation of OC, which could improve the preservation conditions for deposited organic matter, cannot be ruled out. Hypoxia in eutrophic coastal waters is a widespread phenomenon, which has expanded rapidly around the world over the last several decades (Díaz and Rosenberg, 2008; Rabalais et al., 2010). Seasonal hypoxic events have already been reported in the coastal waters adjacent to the Changjiang River estuary. Low levels of dissolved oxygen (DO) were first reported in the Yellow Sea close to the mouth of the Changjiang River in 1959 (Gu, 1980), and frequent large-scale seasonal hypoxia phenomena have been recorded in the sea area adjacent to the Changjiang River estuary since 1988 (Li et al., 2002, 2011; Chen et al., 2007). The red-tide zone has also been identified as a hypoxic zone in previous investigations (e.g., Chen et al., 2007). Previous studies have indicated that hypoxia in the coastal waters adjacent to the Changjiang River estuary are closely associated with the eutrophication process, as well as the strong stratification during summer and the intrusion of seawater from the open ocean (e.g., the Taiwan Warm Current) with relatively lower levels of DO (Wang, 2009). However, the exact role of hypoxia in the accumulation of OC is not fully understood, and additional proxies need to be adopted to reveal the potential role of hypoxia in the accumulation of organic matter.
4.2 Changes of phytoplankton community based on sedimentary pigment recordsPigments within sediment have been used successfully as biomarkers for phytoplankton production and OC flux (Jeffrey and Vesk, 1997; Chen et al., 2001; Reuss et al., 2005; Aneeshkumar and Sujatha, 2012). Ubiquitous pigments, such as chlorophyll a and β -carotene, are valuable indicators of phytoplankton abundance and primary productivity (Bianchi et al., 2000; Kowalewska, 2005; Rabalais et al., 2007). Significant up-core increases of total chlorophyll a and β -carotene were found within the core, concurrent with rapid increases of OC and TN contents, which further support marine primary production as a major source of the organic matter accumulated within the red-tide zone after the 1970s.
Of the two ubiquitous pigments, β -carotene appears better in depicting the long-term change of phytoplankton biomass within the red-tide zone. Although chlorophyll a is the pigment most representative of the phytoplankton biomass, and its concentration in the water column is much higher than β -carotene, the degradation of chlorophyll a is relatively faster, and it is affected by many factors, such as redox status, grazing pressure, and secondary reactions (Bianchi et al., 2000; Louda et al., 2002). Chlorophyll a and its degradation products have been proposed as useful biomarkers within this region in a previous study, because little post-depositional degradation has occurred within this area (Zhao et al., 2012). In the current study, however, chlorophyll a and its degradation products could not be detected beneath 15 cm, while β -carotene could be detected throughout the core.
Taxon-specific pigments, such as fucoxanthin, peridinin, diatoxanthin, diadinoxanthin, alloxanthin, lutein, and zeaxanthin, have been used to reconstruct the phytoplankton community within the water column. However, some of the characteristic pigments that appeared in high concentrations within the water column were less common or even undetectable within the sediments because of their selective preservation of pigments (Abele-Oeschger, 1991; Buchaca and Catalan, 2008). This preferential loss of pigments affects the relative abundance of pigments and therefore, it is almost impossible to retrieve the structure of a phytoplankton community over time simply from the pigments preserved within sediment. However, the analysis of historical changes of specific phytoplankton groups is more reliable based on the variation of individual pigments (Leavitt, 1993).
Both fucoxanthin and diatoxanthin have been suggested as pigments representative of diatoms; however, fucoxanthin is more labile and therefore less suitable to represent diatoms (Buchaca and Catalan, 2008). In the current study, fucoxanthin could not be detected below 8 cm in the core. Diatoxanthin, however, could be detected throughout the entire core and it showed a rapid increase from the 1970s, which coincided well with the two ubiquitous plant pigments and OC. These data suggested that diatoms contributed significantly to the deposited organic matter. A previous study in the same area (sediment core S0703-2) has shown that biogenic silicon showed a gradual increase after the 1970s (Zhou, 2007). All these studies have suggested that the biomass of diatoms in the red-tide zone has increased over the last four decades.
Increasing dominance of dinoflagellates in the phytoplankton community is the most significant phenomenon in the coastal waters adjacent to the Changjiang River estuary. Large-scale dinoflagellate blooms have occurred each spring within this area since 2000. However, it is difficult to deduce any long-term changes of dinoflagellates based on the pigment records within the core. Peridinin was generally considered as the pigment most representative of dinoflagellates, but it is amongst the most labile pigments (Leavitt, 1993) and it is often absent from sediments because of its poor stability (Brotas and Plante-Cuny, 2003). In the current study, peridinin could not be detected within the core below 8 cm. The specificity of diadinoxanthin to represent dinoflagellates was low and the rapid increase of diadinoxanthin in the upper layers probably reflected the increasing abundance of dinoflagellates.
Alloxanthin, zeaxanthin, and lutein, which represent cryptophytes, cyanobacteria, and chlorophytes, respectively, are relatively stable within sediment (Bianchi et al., 2002; Wysocki et al., 2006), and these pigments have been used to interpret the changes of specific phytoplankton groups. These three carotenoids showed distinct profiles in the core. Both zeaxanthin and lutein showed continued increases after the 1970s, indicating gradual increases of both cyanobacteria and chlorophytes. However, alloxanthin decreased rapidly after the 1970s, suggesting an apparent decrease of cryptophytes after that period. Using zeaxanthin in a sediment core as an indicator, Li et al. (2011) also proposed that the abundance of cyanobacteria has increased in the waters adjacent to the Changjiang River estuary.
The shift in the profiles of specific pigments suggested potential changes of the phytoplankton community in the coastal waters adjacent to the Changjiang River estuary. It is generally accepted that changes of nutrient amount, form, and ratio will lead to significant changes of both the standing stock and the structure of the phytoplankton community (Carstensen et al., 2011; Altman and Pearl, 2012). In the red-tide zone adjacent to the Changjiang River estuary, changes of the phytoplankton community have been suggested under the effects of nutrient over-enrichment (Zhou et al., 2008; Jiang et al., 2010). Based on the pigment profiles within the core, it could be deduced that the standing stock of the phytoplankton community started to increase from the 1970s. However, microalgal groups of the phytoplankton community have exhibited different changes. Diatoms, cyanobacteria, and chlorophytes have kept increasing, while cryptophytes have decreased significantly. Additional research is needed to examine this process and to understand the factors responsible for these dramatic changes since the 1970s.
5 CONCLUSIONA 210Pb-dated sediment core from the coastal waters adjacent to the Changjiang River estuary was analyzed to retrieve the history of cultural eutrophication and its associated ecosystem changes. The core exhibited a significant up-core increase of OC from the 1970s. The concurrent enrichment of 13C and decrease of the molar C/N ratio after the 1990s implied the accumulation of organic matter originated from marine primary production. Profiles of plant pigments along the core supported this idea and indicated the importance of diatoms in the accumulated organic matter. Profiles of the characteristic pigments for different microalgal groups suggested increasing standing stock of the phytoplankton community after the 1970s, with potential changes of the phytoplankton community structure. Coastal waters adjacent to the Changjiang River have faced serious problems from HABs and hypoxia since the beginning of the 21st century. Findings in the current study have offered evidence of the deteriorating trend of cultural eutrophication and its associated ecosystem changes in the red-tide zone adjacent to the Changjiang River estuary. However, further detailed studies, such as an investigation of the specific proxies of hypoxia, need to be conducted for a better understanding of the ecosystem changes.
6 ACKNOWLEDGEMENTWe thank Professor WANG Y. P. from Nanjing University, Professor DIAO S. B. from Qingdao Institute of Marine Geology, and Dr. NAN Q. Y. from IOCAS for their assistance in the analyses of the 210Pb, 137Cs, and stable C and N isotopes.
| Abele-Oeschger D, 1991. Potential of some carotenoids in two recent sediments of kiel bight as biogenic indicators of phytodetritus. Marine Ecology Progress Series, 70 : 83 –92. Doi: 10.3354/meps070083 |
| Altman J C, Paerl H W, 2012. Composition of inorganic and organic nutrient sources influences phytoplankton community structure in the New River Estuary, North Carolina. Aquatic Ecology, 46 (3) : 269 –282. Doi: 10.1007/s10452-012-9398-8 |
| Aneeshkumar N, Sujatha C H, 2012. Biomarker pigment signatures in Cochin back water system-A tropical estuary south west coast of India. Estuarine, Coastal and Shelf Science, 99 : 182 –190. Doi: 10.1016/j.ecss.2011.12.029 |
| Bianchi T S, Allison M A, 2009. Large-river delta-front estuaries as natural "recorders" of global environmental change. Proceedings of the National Academy of Sciences of the United States of America, 106 (20) : 8085 –8092. Doi: 10.1073/pnas.0812878106 |
| Bianchi T S, Johansson B, Elmgren R, 2000. Breakdown of phytoplankton pigments in Baltic sediments:effects of anoxia and loss of deposit-feeding macrofauna. Journal of Experimental Marine Biology and Ecology, 251 (2) : 161 –183. Doi: 10.1016/S0022-0981(00)00212-4 |
| Bianchi T S, Rolff C, Widbom B, Elmgren R, 2002. Phytoplankton pigments in Baltic Sea seston and sediments:seasonal variability, fluxes, and transformations. Estuarine Coastal and Shelf Science, 55 (3) : 369 –383. Doi: 10.1006/ecss.2001.0911 |
| Boesch D F, 2002. Challenges and opportunities for science in reducing nutrient over-enrichment of coastal ecosystems. Estuaries, 25 (4) : 886 –900. Doi: 10.1007/BF02804914 |
| Breitburg D L, Hondorp D W, Davias L A, Díaz R J, 2009. Hypoxia, nitrogen, and fisheries:integrating effects across local and global landscapes. Annual Review of Marine Science, 1 (1) : 329 –349. Doi: 10.1146/annurev.marine.010908.163754 |
| Bricker S B, Longstaff B, Dennison W, Jones A, Boicourt K, Wicks C, Woerner J, 2008. Effects of nutrient enrichment in the nation's estuaries:a decade of change. Harmful Algae, 8 (1) : 21 –32. Doi: 10.1016/j.hal.2008.08.028 |
| Brotas V, Plante-Cuny M R, 2003. The use of HPLC pigment analysis to study microphytobenthos communities. Acta Oecologica, 24 (S1) : S109 –S115. |
| Buchaca T, Catalan J, 2008. On the contribution of phytoplankton and benthic biofilms to the sediment record of marker pigments in high mountain lakes. Journal of Paleolimnology, 40 (1) : 369 –383. Doi: 10.1007/s10933-007-9167-1 |
| Canfield D E, Glazer A N, Falkowski P G, 2010. The evolution and future of Earth's nitrogen cycle. Science, 330 (6001) : 192 –196. Doi: 10.1126/science.1186120 |
| Carstensen J, Sánchez-Camacho M, Duarte C M, KrauseJensen D, Marbà N, 2011. Connecting the dots:responses of coastal ecosystems to changing nutrient concentrations. Environmental Science & Technology, 45 (21) : 9122 –9132. |
| Chen C C, Gong G C, Shiah F K, 2007. Hypoxia in the East China Sea:one of the largest coastal low-oxygen areas in the world. Marine Environmental Research, 64 (4) : 399 –408. Doi: 10.1016/j.marenvres.2007.01.007 |
| Chen N H, Bianchi T S, McKee B A, Bland J M, 2001. Historical trends of hypoxia on the Louisiana shelf:application of pigments as biomarkers. Organic Geochemistry, 32 (4) : 543 –561. Doi: 10.1016/S0146-6380(00)00194-7 |
| Cloern J E, 2001. Our evolving conceptual model of the coastal eutrophication problem. Marine Ecology Progress Series, 210 : 223 –253. Doi: 10.3354/meps210223 |
| DeMaster D J, McKee B A, Nittrouer C A, Qian J C, Cheng G D, 1985. Rates of sediment accumulation and particle reworking based on radiochemical measurements from continental shelf deposits in the East China Sea. Continental Shelf Research, 4 (1-2) : 143 –158. Doi: 10.1016/0278-4343(85)90026-3 |
| Díaz R J, Rosenberg R, 2008. Spreading dead zones and consequences for marine ecosystems. Science, 321 (5891) : 926 –929. Doi: 10.1126/science.1156401 |
| Filippelli G M, 2008. The global phosphorus cycle:past, present, and future. Elements, 4 (2) : 89 –95. Doi: 10.2113/GSELEMENTS.4.2.89 |
| Galloway J N, Dentener F J, Capone D G, Boyer E W, Howarth R W, Seitzinger S P, Asner G P, Cleveland C C, Green P A, Holland E A, Karl D M, Michaels A F, Porter J H, Townsend A R, Vöosmarty C J, 2004. Nitrogen cycles:past, present, and future. Biogeochemistry, 70 (2) : 153 –226. Doi: 10.1007/s10533-004-0370-0 |
| Glibert P M, Mayorga E, Seitzinger S, 2008. Prorocentrum minimum tracks anthropogenic nitrogen and phosphorus inputs on a global basis:application of spatially explicit nutrient export models. Harmful Algae, 8 (1) : 33 –38. Doi: 10.1016/j.hal.2008.08.023 |
| Gooday A J, Jorissen F, Levin L A, Middelburg J J, Naqvi S W A, Rabalais N N, Scranton M, Zhang J, 2009. Historical records of coastal eutrophication-induced hypoxia. Biogeosciences, 6 (8) : 1707 –1745. Doi: 10.5194/bg-6-1707-2009 |
| Gu H K, 1980. The maximum value of dissolved oxygen in its vertical distribution in yellow sea. Acta Oceanologica Sinica, 2 (2) : 70 –79. |
| Hagy J D, Boynton W R, Keefe C W, Wood K V, 2004. Hypoxia in Chesapeake Bay, 1950-2001:long-term change in relation to nutrient loading and river flow. Estuaries, 27 (4) : 634 –658. Doi: 10.1007/BF02907650 |
| Heisler J, Glibert P M, Burkholder J M, Anderson D M, Cochlan W, Dennison W C, Dortch Q, Gobler C J, Heil C A, Humphries E, Lewitus A, Magnien R, Marshall H G, Sellner K, Stockwell D A, Stoecker D K, Suddleson M, 2008. Eutrophication and harmful algal blooms:a scientific consensus. Harmful Algae, 8 (1) : 3 –13. Doi: 10.1016/j.hal.2008.08.006 |
| Howarth R W, Marino R, 2006. Nitrogen as the limiting nutrient for eutrophication in coastal marine ecosystems:evolving views over three decades. Limnology and Oceanography, 51 (1) : 364 –376. |
| Howarth R W, 2005. The development of policy approaches for reducing nitrogen pollution to coastal waters of the USA. Science in China Series C-Life Sciences, 48 (2) : 791 –806. |
| Jeffrey S W, 1968. Quantitative thin-layer chromatography of chlorophylls and carotenoids from marine algae. Biochimica et Biophysica Acta (BBA)-Bioenergetics, 162 (2) : 271 –285. Doi: 10.1016/0005-2728(68)90109-6 |
| Jeffrey S, Vesk M. 1997. Introduction to marine phytoplankton and their pigment signatures. In:Jefffrey S W, Mantoura R F C, Wright S W eds. Phytoplankton pigments in Oceanography:Guidelines to Modern Methods.UNESCO, Paris. p.37-82. |
| Jiang T, Yu Z M, Song X X, Cao X H, Yuan Y Q, 2010. Longterm ecological interactions between nutrient and phytoplankton community in the Changjiang estuary. Chinese Journal of Oceanology and Limnology, 28 (4) : 887 –898. Doi: 10.1007/s00343-010-9059-5 |
| Kowalewska G, 2005. Algal pigments in sediments as a measure of eutrophication in the Baltic environment. Quaternary International, 130 (1) : 141 –151. Doi: 10.1016/j.quaint.2004.04.037 |
| Kurian N P, Rajith K, Hameed T S S, Nair L S, Murthy M V R, Arjun S, Shamji V R, 2009. Wind waves and sediment transport regime off the south-central Kerala coast, India. Natural Hazards, 49 (2) : 325 –345. Doi: 10.1007/s11069-008-9318-3 |
| Landsberg J H, 2002. The effects of harmful algal blooms on aquatic organisms. Reviews in Fisheries Science, 10 (2) : 113 –390. Doi: 10.1080/20026491051695 |
| Leavitt P R, 1993. A review of factors that regulate carotenoid and chlorophyll deposition and fossil pigment abundance. Journal of Paleolimnology, 9 (2) : 109 –127. Doi: 10.1007/BF00677513 |
| Li D J, Zhang J, Huang D J, Wu Y, Liang J, 2002. Oxygen depletion off the Changjiang (Yangtze River) Estuary. Science in China Series D-Earth Sciences, 45 (12) : 1137 –1146. Doi: 10.1360/02yd9110 |
| Li X X, Bianchi T S, Yang Z S, Osterman L E, Allison M A, DiMarco S F, Yang G P, 2011. Historical trends of hypoxia in Changjiang River estuary:applications of chemical biomarkers and microfossils. Journal of Marine Systems, 86 (3-4) : 57 –68. Doi: 10.1016/j.jmarsys.2011.02.003 |
| Louda J W, Liu L, Baker E W, 2002. Senescence-and deathrelated alteration of chlorophylls and carotenoids in marine phytoplankton. Organic Geochemistry, 33 (12) : 1635 –1653. Doi: 10.1016/S0146-6380(02)00106-7 |
| Mead R, Xu Y P, Chong J, Jaffé R, 2005. Sediment and soil organic matter source assessment as revealed by the molecular distribution and carbon isotopic composition of n-alkanes. Organic Geochemistry, 36 (3) : 363 –370. Doi: 10.1016/j.orggeochem.2004.10.003 |
| Meyers P A, 1994. Preservation of elemental and isotopic source identification of sedimentary organic matter. Chemical Geology, 114 (3-4) : 289 –302. Doi: 10.1016/0009-2541(94)90059-0 |
| Ning X, Lin C, Su J, Liu C, Hao Q, Le F, 2011. Long-term changes of dissolved oxygen, hypoxia, and the responses of the ecosystems in the East China Sea from 1975 to 1995. Journal of Oceanography, 67 (1) : 59 –75. Doi: 10.1007/s10872-011-0006-7 |
| OSPAR. 2005. Ecological quality objectives for the Greater North Sea with regard to nutrients and eutrophication effects. http://www.ospar.org/documents/dbase/publications/p00229/p00229_bd%20on%20eutrophication%20ecoqos.pdf. Accessed on 2014-11-13. |
| Pinturier-Geiss L, Méjanelle L, Dale B, Karlsen D A, 2002. Lipids as indicators of eutrophication in marine coastal sediments. Journal of Microbiological Methods, 48 (2-3) : 239 –257. Doi: 10.1016/S0167-7012(01)00326-8 |
| Rabalais N N, Díaz R J, Levin L A, Turner R E, Gilbert D, Zhang J, 2010. Dynamics and distribution of natural and human-caused hypoxia. Biogeosciences, 7 (2) : 585 –619. Doi: 10.5194/bg-7-585-2010 |
| Rabalais N N, Turner R E, Sen Gupta B K, Platon E, Parsons M L, 2007. Sediments tell the history of eutrophication and hypoxia in the Northern Gulf of Mexico. Ecological Applications, 17 (5) : S129 –S143. |
| Reuss N, Conley D J, Bianchi T S, 2005. Preservation conditions and the use of sediment pigments as a tool for recent ecological reconstruction in four Northern European estuaries. Marine Chemistry, 95 (3-4) : 283 –302. Doi: 10.1016/j.marchem.2004.10.002 |
| Rosenbauer R J, Swarzenski P W, Kendall C, Orem W H, Hostettler F D, Rollog M E, 2009. A carbon, nitrogen, and sulfur elemental and isotopic study in dated sediment cores from the Louisiana Shelf. Geo-Marine Letters, 29 (6) : 415 –429. Doi: 10.1007/s00367-009-0151-9 |
| Sampaio L, Rodrigues A M, Quintino V, 2010. Carbon and nitrogen stable isotopes in coastal benthic populations under multiple organic enrichment sources. Marine Pollution Bulletin, 60 (10) : 1790 –1802. Doi: 10.1016/j.marpolbul.2010.06.003 |
| Shen Z L, Liu Q, 2009. Nutrients in the changjiang river. Environmental monitoring and assessment, 153 (1-4) : 27 –44. Doi: 10.1007/s10661-008-0334-2 |
| Smith V H, Schindler D W, 2009. Eutrophication science:where do we go from here?. Trends in Ecology & Evolution, 24 (4) : 201 –207. |
| Struck U, Emeis K C, Voss M, Christiansen C, Kunzendorf H, 2000. Records of southern and central Baltic Sea eutrophication in δ13C and δ15N of sedimentary organic matter. Marine Geology, 164 (3-4) : 157 –171. Doi: 10.1016/S0025-3227(99)00135-8 |
| Turner R E, Rabalais N N, Fry B, Atilla N, Milan C S, Lee J M, Normandeau C, Oswald T A, Swenson E M, Tomasko D A, 2006. Paleo-indicators and water quality change in the Charlotte Harbor estuary (Florida). Limnology and Oceanography, 51 (1) : 518 –533. |
| Wang B D, 2006. Cultural eutrophication in the Changjiang(Yangtze River) plume:history and perspective. Estuarine, Coastal and Shelf Science, 69 (3-4) : 471 –477. Doi: 10.1016/j.ecss.2006.05.010 |
| Wang B D, 2009. Hydromorphological mechanisms leading to hypoxia off the Changjiang estuary. Marine Environmental Research, 67 (1) : 53 –58. Doi: 10.1016/j.marenvres.2008.11.001 |
| Wang J H, Wu J Y, 2009. Occurrence and potential risks of harmful algal blooms in the East China Sea. Science of the T otal Environment, 407 (13) : 4012 –4021. Doi: 10.1016/j.scitotenv.2009.02.040 |
| Wang X L, Wang B D, Zhang C S, Shi X Y, Zhu C J, Xie L P, Han X R, Xin Y, Wang J T, 2008. Nutrient composition and distributions in coastal waters impacted by the Changjiang plume. Acta Oceanologica Sinica, 27 (5) : 111 –125. |
| Wang Y P, Gao S, Jia J J, Liu Y L, Gao J H, 2014. Remarked morphological change in a large tidal inlet with low sediment-supply. Continental Shelf Research, 90 : 79 –95. Doi: 10.1016/j.csr.2014.02.005 |
| Wright S W, Jeffrey S W, Mantoura R F C, Llewellyn C A, Bjornland T, Repeta D, Welschmeyer N, 1991. Improved HPLC method for the analysis of chlorophylls and carotenoids from marine phytoplankton. Marine Ecology Progress Series, 77 (2-3) : 183 –196. |
| Wright S W, Jeffrey S W, 1987. Fucoxanthin pigment markers of marine-phytoplankton analyzed by HPLC and HPTLC. Marine Ecology Progress Series, 38 : 259 –266. Doi: 10.3354/meps038259 |
| Wu Y, Zhang J, Liu S M, Zhang Z F, Yao Q Z, Hong G H, Cooper L, 2007. Sources and distribution of carbon within the Yangtze River system. Estuarine, Coastal and Shelf Science, 71 (1-2) : 13 –25. Doi: 10.1016/j.ecss.2006.08.016 |
| Wysocki L A, Bianchi T S, Powell R T, Reuss N, 2006. Spatial variability in the coupling of organic carbon, nutrients, and phytoplankton pigments in surface waters and sediments of the Mississippi River plume. Estuarine Coastal and Shelf Science, 69 (1-2) : 47 –63. Doi: 10.1016/j.ecss.2006.03.022 |
| Xia X M, Yang H, Li Y, Li B G, Pan S M, 2004. Modern sedimentation rates in the contiguous sea area of Changjiang Estuary and Hangzhou Bay. Acta Sedimentologica Sinica, 22 (1) : 130 –135. |
| Xu K H, Li A C, Liu J P, Milliman J D, Yang Z S, Liu C S, Kao S J, Wan S M, Xu F J, 2012. Provenance, structure, and formation of the mud wedge along inner continental shelf of the East China Sea:a synthesis of the Yangtze dispersal system. Marine Geology, 291-294 : 176 –191. Doi: 10.1016/j.margeo.2011.06.003 |
| Yu Y, Song J M, Li X G, Duan L Q, 2012. Geochemical records of decadal variations in terrestrial input and recent anthropogenic eutrophication in the Changjiang Estuary and its adjacent waters. Applied Geochemistry, 27 (8) : 1556 –1566. Doi: 10.1016/j.apgeochem.2012.05.002 |
| Zaborska A, Carroll J, Papucci C, Pempkowiak J, 2007. Intercomparison of alpha and gamma spectrometry techniques used in 210Pb geochronology. Journal of Environmental Radioactivity, 93 (1) : 38 –50. Doi: 10.1016/j.jenvrad.2006.11.007 |
| Zapata M, Rodriguez F, Garrido J L, 2000. Separation of chlorophylls and carotenoids from marine phytoplankton:a new HPLC method using a reversed phase C8 column and pyridine-containing mobile phases. Marine EcologyProgress Series, 195 : 29 –45. Doi: 10.3354/meps195029 |
| Zhang J, Wu Y, Jennejahn T C, Ittekkot V, He Q, 2007. Distribution of organic matter in the Changjiang (Yangtze River) Estuary and their stable carbon and nitrogen isotopic ratios:implications for source discrimination and sedimentary dynamics. Marine Chemistry, 106 (1-2) : 111 –126. Doi: 10.1016/j.marchem.2007.02.003 |
| Zhao J, Bianchi T S, Li X X, Allison M A, Yao P, Yu Z G, 2012. Historical eutrophication in the Changjiang and Mississippi delta-front estuaries:stable sedimentary chloropigments as biomarkers. Continental Shelf Research, 47 : 133 –144. Doi: 10.1016/j.csr.2012.07.005 |
| Zhou M J, Shen Z L, Yu R C, 2008. Responses of a coastal phytoplankton community to increased nutrient input from the Changjiang (Yangtze) River. Continental Shelf Research, 28 (12) : 1483 –1489. Doi: 10.1016/j.csr.2007.02.009 |
| Zhou P. 2007. Measurement of Biogenic Silica (BSi) in Marine Sediment Cores from East China Sea and Their Stratigraphical Application. Xiamen University, Xiamen, China. p.50-54. (in Chinese) |